Summary
Complex fractionated atrial electrograms (CFAEs) are thought to identify high frequency electrical sources and have become an important target for radiofrequency ablation of atrial fibrillation (AF). Methods used to identify CFAEs and locate suitable ablation sites usually depend on subjective analysis of the electrograms but may also involve objective, computer based paradigms through either time or frequency domain approaches.
Methods
We generated a set of simulated test electrograms, which were defined by a combination of a basic cycle length, phase-resetting noise and phase-preserving noise, accounting for far-field effects. The simulated electrograms were analyzed separately by well-known basic time-domain (Complex Fractionated Electrogram, CFE) and frequency-domain (Dominant Frequency, DF) methods and the results compared to each other to determine objectively the potential reliability of either method to accurately estimate the cycle length of the atrial electrogram.
Results
The behavior of the time-domain method depends on the assumed amplitude-sensitivity threshold and can be tuned to its optimal performance but only for signals having stable (and known a priori) amplitude. When the signal amplitude varies randomly (with ±20% standard deviation range), the time-domain method loses performance. By contrast, the performance of the frequency-domain method remains stable.
Conclusion
Despite potentially good performance of time-domain methods to estimate the cycle length during AF, and localize ablation sites, their performance is easily prone to degradation. The frequency-domain method seems to be much more robust.
Keywords: atrial fibrillation, complex atrial electrogram, dominant frequency, radio frequency ablation
Introduction
The use of complex fractionated atrial electrograms (CFAEs) has become an important tool in the clinical electrophysiology laboratory to guide radiofrequency (RF) ablation of atrial fibrillation (AF) sources (1). However, the underlying mechanisms and clinical significance of CFAE's remain controversial. Following a report by Konings et al (2), the first extensive use of CFAE-guided AF ablation in humans was by Nademanee et al (3). Subsequently, the approach was worked out by Oral et al. (4,5,6) and others (7). According to Oral et al (4), CFAE is defined as “electrograms with a cycle length ≥120 ms or shorter than in the coronary sinus, or that were fractionated or displayed continuous electric activity”. The method is based on both objective assessment of the signal, as it calls for absolute measurement of cycle lengths, and subjective assessment of whether the activity is “continuous” enough. Sites of electrograms whose CL is shorter than a cut-off value or having complex morphology are thought to be CFAE and subject to ablation. Several attempts have been made to make this approach more objective, by developing algorithms for automatic CFAE detection (8).
A similar method (Complex Fractionated Electrogram, CFE) was embedded in the NavX EnSite mapping system by St. Jude Medical (9). The principle of this method is based on two sequential steps. First, activation events are recognized in the signal; and second, time intervals between subsequent activations are calculated, and their average is denoted as CFE mean. Locations whose cycle length is shorter than a specified threshold (120 ms) are deemed to be ablation targets (9).
Despite variations in the details of the different methods to identify CF(A)Es, several properties remain the same. In all methods, the local activation events are recognized in the electrogram (either automatically or not) and subsequently their timing must be assessed (as CL shorter than a threshold) or be denoted as “continuous”.
To date, the only method that is based on the frequency domain is the Dominant Frequency (DF) mapping technique. DF mapping was developed originally by Berenfeld et al (10) and elaborated later in (11,12,13,14). The principle is to transform the signal from the time domain to the frequency domain. Subsequently, the highest peak in the spectrum is identified as the dominant frequency. The location with the highest DF value (DFmax) is subject to ablation (11). Notably, using this method to identify suitable ablation sites requires one to add some precision to the term “highest” DF. Since usually only one point would have the highest value, additional criteria are needed to specify how far from this point one should ablate.
In this report, we use a numerical approach to compare the CFE and DF methods in their potential reliability to estimate correctly the cycle length of synthetic electrograms. In the clinic this translates into a more accurate identification of AF sources.
Methods
Signal generation
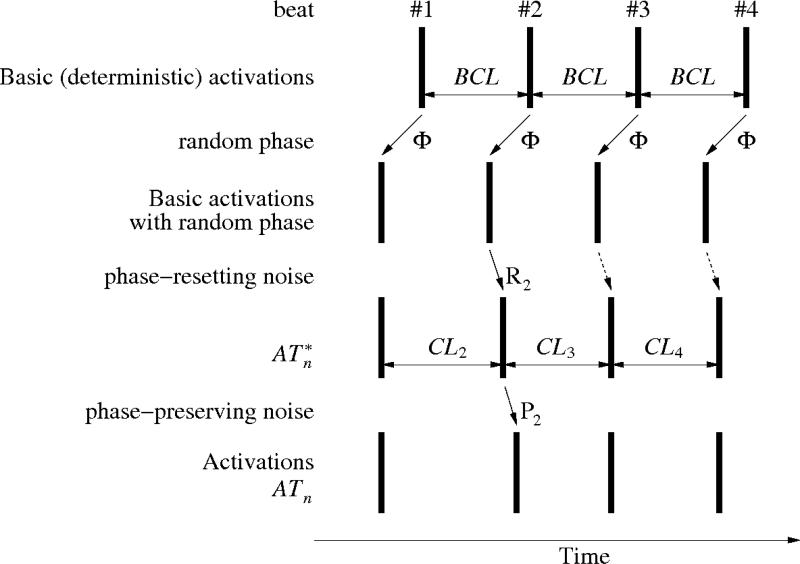
All simulations were performed on the LabView platform using a custom-built test application. To evaluate different methods of AF electrogram assessment, we generated several artificial signals. An elementary activation series is defined by the following parameters: basic cycle length (BCL), phase-resetting noise (R) and phase-preserving noise (P), as presented below and shown in Fig. 1.
Fig. 1.
Generation of simulated complex fractionated electrogram. A deterministic series of activations that occur at a given basic cycle length (BCL) is disturbed by a random phase Φ that shifts all beats by a value that is selected randomly but is conserved for all beats. Subsequently, phase-resetting noise R is applied; the diagram shows the effect of one element (R2) of that noise. It affects directly beat #2, and implicitly all subsequent beats. After that, a phase-preserving noise P is applied, leading to the activations series ATn.
We generated series of activation times:
where BCL is the basic cycle length, Rk, Pn are noise signals and Φ is a random initial phase. Then, we generated a time series TR[m] (indexed by discrete time – sample index, not beat numbers), with positive spikes of amplitude A (representing local activations) located at the calculated activation times ATn and 0's everywhere else. For example, when AT3 = 250 ms (meaning that the third beat will occur 250 ms from the beginning of the recording), we convert the latter value to a sample index (obtaining 300 at sampling frequency of 1200 Hz, rounding to integer towards –infinity, if needed) and subsequently set TR[300] = A. Formally, TR[m] is defined as
where A is the signal amplitude (we assumed A = 1mV, unless noted otherwise) and fs. is the sampling frequency for TR[m]. TR[m] looks like a train of 1 mV spikes.
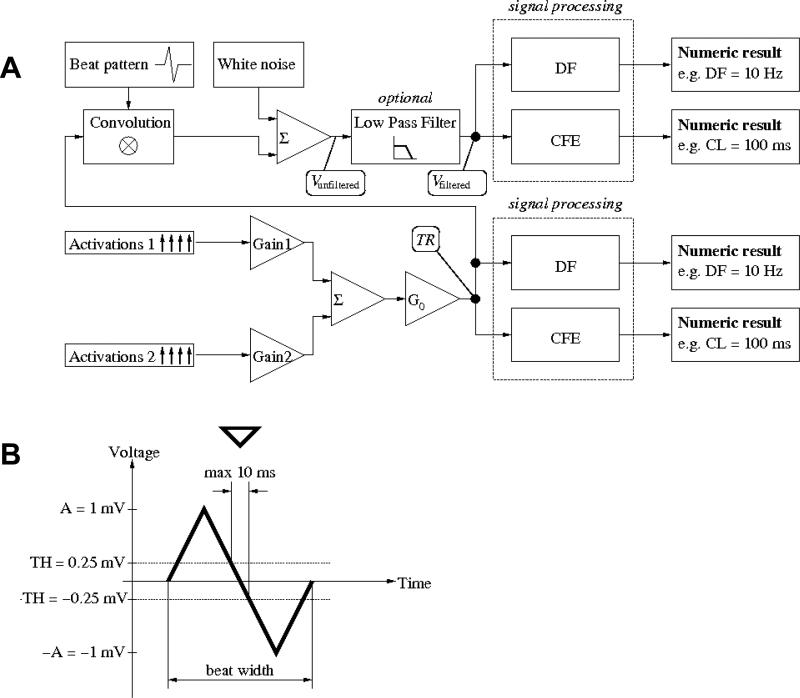
The next stage in the signal generation process is shown in Fig. 2A. We generate two signals TR1[m] and TR2[m], for various sets of timing parameters and different realizations of Φ, R and P. The two signals are added together:
where G1, G2 are constants in the range from 0 to 1 and represent the fractional contribution of TR1[m] and TR2[m], respectively, G0 is a “master gain” applied to the entire signal. G0 is either constant or varying randomly in time (“noisy gain”).
Fig. 2.
A. Comparison environment. Two activations series (1 and 2), each generated as in Fig. 1 with different parameters are multiplied by constant weights (gains G1,G2) and added together; the sum is multiplied by a random master gain G0. The signal is then processed by the DF or CFE methods to provide numeric results in Hz or ms, respectively. B. Individual beat pattern used in actual simulation (13.3 ms width; please note that, formally, pattern h is dimensionless with an amplitude of 1. The amplitude of 1 mV in the figure results from A = 1mV and unitary gain G0 = 1). Detection criteria: crossing from above positive threshold (TH = 0.25 mV in this example) to below negative threshold (–TH = –0.25 mV in this example) within less than 10 ms. Down pointing triangle indicates the activation time detected.
Unless noted otherwise, we generate a weighted sum of elementary signals of BCL = 80 ms with weights G80 ms (G1) and BCL = 180 ms with weight G180 ms (G2), where G80 ms + G180 ms = 1. The biophysical rationale is to account for the far field effect. Each test signal lasts 5 s at a 1200 Hz sampling frequency.
Subsequently, signal TR[m] was either:
analyzed by the CFE and DF methods or
- convoluted with a beat pattern, White noise was then added. Finally, optional low pass filtering was applied, and then analyzed:
where h is a beat pattern (as shown in Fig. 2B), μ is Gaussian white noise, ⊗ denotes convolution and LPF denotes low pass filtering.
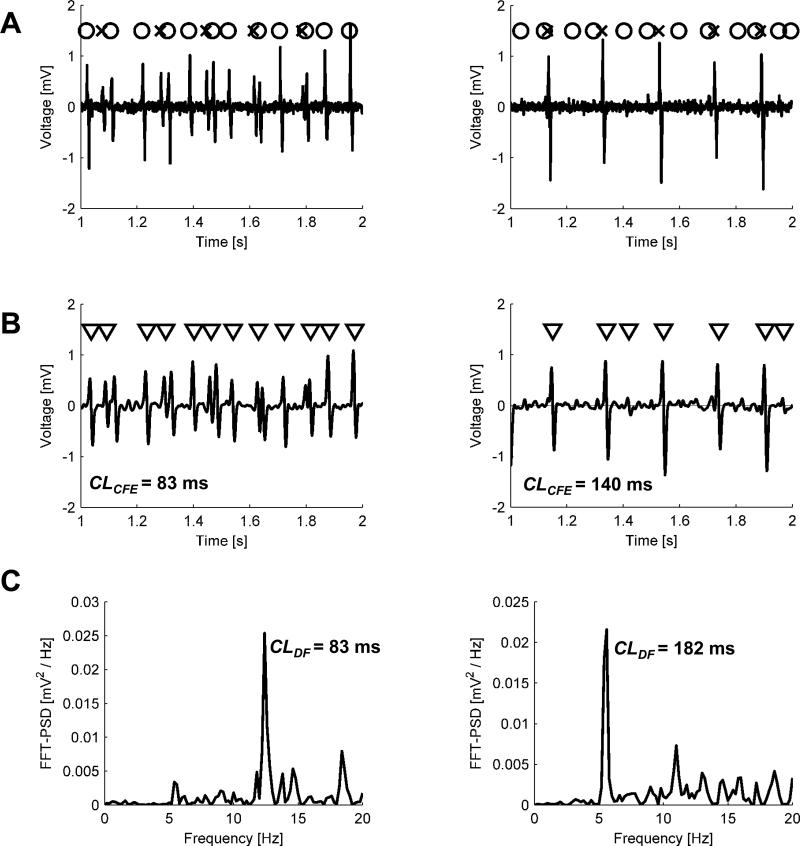
In Fig. 3A we show an example of a signal generated by our model. Fig. 3B is the convoluted beat pattern.
Fig. 3.
Two examples of generated signals: CFAE-positive (G80 ms = 1–G180 ms = 0.6) on the left and CFAE-negative (G80 ms = 1 – G180 ms = 0.05) on the right. A. Unfiltered electrogram (solid line), generated from two series of activation times, each similar to that shown in the last row in Fig. 1 (activations resulting from BCL = 80 ms are marked with circles and activations from BCL = 180 ms with crosses), by convoluting train TR with a beat pattern h. B. Low pass (20 Hz cut-off frequency) filtered (solid line) and activation times detected in it using CFE method The length of observation divided over the number of detected activations yields mean CFE, an estimated cycle length. In the right plot, the third and the last triangle indicates unwanted detections, which in turn artificially shorten CL estimate. Although overall filter gain was adjusted to preserve the beat amplitude, some beats could lose or gain more than the others (for instance, the first beat is larger than the third one in A but not in B). C. Power spectral density of electrogram shown in B, calculated in DF method. The frequency of the highest peak (about 12 or 5.5 Hz, respectively) was denoted as DF.
Time domain – sensing model
We used CFE as a representative of the time-domain method (1,8,9). For analysis of filtered (Vfiltered) or unfiltered electrograms (Vunfiltered), we used detection criteria illustrated already in Fig. 2B. However, as we aimed to abstract from the problem of sensitivity/specificity of any particular detection algorithm, for the purpose of analyzing TR signal directly, we assumed idealized conditions for recognition; i.e. we assumed that all activations of amplitude exceeding the sensing threshold (TR[m] > TH) are detected. CFE refractoriness (1,7,9,15) was set to 50 ms, unless stated otherwise.
Frequency domain
For the frequency domain method, we used DF (10). Briefly, this involved calculating the power spectrum of the entire rectified signal using detrending, a Hanning window and FFT, then filtering the resulting spectrum by discarding frequencies greater than 20 Hz, unless specified otherwise, with the latter value being equivalent to the refractory period used in CFE. Finally, the highest peak of the power spectrum was identified and its frequency designated as dominant (DF). The reciprocal thereof was labeled as the CL estimate using the DF method.
Comparison environment
We generated several test signals (see Fig. 3) and analyzed each method in terms of its ability to calculate the cycle lengths from the signals. We then compared the estimated cycle length by the DF or CFE methods to the cut-off value of 120 ms, which is currently used by clinicians (9). This indicates in what percentage of randomly generated signals the method in question provides a CL estimate shorter than the cut-off value.
Specifically, for each set of signal parameters (i.e., BCL etc), we generated 100 realizations of the signal. Subsequently, each of the two compared methods was given those realizations (procedure equivalent to performing 100 recordings at a single site in a patient), resulting in 100 estimates of cycle length.
Results
Overall performance
We tested the CFE and DF methods on electrograms generated as described in Figs. 1-3, with short CL = 80 ms and long CL = 180 ms. Phase-resetting noise and phase-preserving noise were generated as Gaussian white noise with mean values of 0 and standard deviations of ± 10 ms.
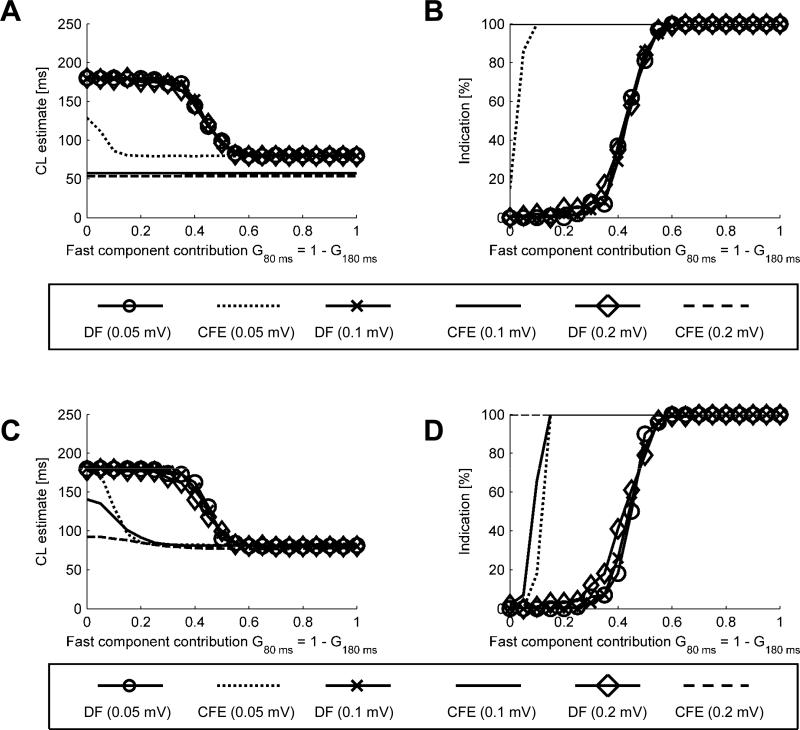
Fig. 4 shows CL estimates (A and C) and percentages of indications (B and D) as functions of signal composition in the presence of varying additive noise levels. In this and subsequent figures the average of 100 CL estimates (CLCFE and CLDF) is on the left panels (“CL estimate [ms]”) and the percentage of estimates falling below the assumed cut-off value is on the right panels (“Indication [%]”). In Fig. 4A, CLDF shifted between 180 ms and 80 ms when the fast component contribution was G80 ms ≥ 0.3 and G80 ms ≥ 0.5, respectively. A smooth transition was observed for the intermediate range of signal composition, On the other hand, with a sensing threshold of 0.1 mV, noise as low as 0.1 or 0.2 mV caused the detection of CLCFE at about 50 ms over the full range of signal composition. Only when the noise level was 0.05 mV CFE showed somewhat more accurate estimates. In panel B, with noise as low as 0.05 mV, even a small percentage of the fast component in the signal caused CFE to give a positive indication (clinically synonymous with prompting ablation) in at least 90% of cases. As illustrated in panels C and D, when the signals were low-pass-filtered before entering the CFE or DF method, DF behavior remained the same but CFE was able to produce slightly longer cycle length estimates and lower rate of indications for signals with low contribution of the fast component (panels C and D).
Fig. 4.
CL estimates (A and C) and percentages of indications (B and D) as a function of signal composition obtained for varying additive noise levels. A and B – signals with white noise added. C and D – signal with white noise added and low pass filtering applied afterwards.
Effect of sensitivity threshold TH
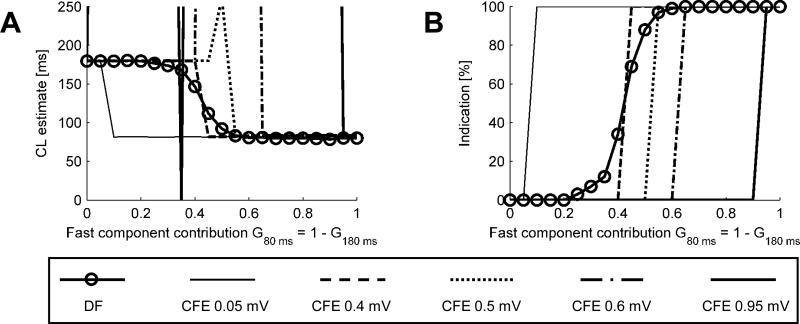
To better understand the behavior of the CFE and DF approaches, we tested their idealized implementations based on activations series TR. Fig. 5A plots the average CL estimates as a function of the fast component contribution, G80 ms. For G80 ms ≤ 0.25 and G80 ms ≥ 0.6, DF estimates the basic (slow or fast, respectively) CL accurately, with an error < 10 ms. For the intermediate values of G80 ms, there is a gradual transition in the average CL estimate.
Fig. 5.
A. Comparison of CL estimates obtained using the DF and CFE methods at varying sensitivity levels. B. Percentage of positive detections of CL<120 ms as function of the fast component contribution. For instance, out of 100 signals of G80 ms = 0.3 (and G180 ms = 0.7), the DF method detected positively about 10 signals (10%) as being <120 ms.
When TH is set at 0.05 or 0.4 mV, CFE estimates either CLCFE ≈ 80 ms or CLCFE ≈ 180 ms, with a sharp transition at G80 ms = 0.05 or 0.4, respectively – note that the CFE method counts either fast or slow beats but never both, due to the constant deterministic amplitude in this experiment. When TH = 0.5 mV and G80 ms = G180 ms = 0.5 both “fast” and “slow” beats are exactly at the threshold, hence not counted and yielding infinite CL estimates (out of the axis range). As the threshold increases even more, the range of unsuccessful detection gets wider; and for TH = 0.95, only very clear signals can be reliably analyzed.
In Fig. 5B we show the percentage of positive detections; i.e., in how many of the 100 realizations of the test signal each method detected CLs shorter than the cut-off value of 120 ms. DF yields less than 5% of positive detections for G80 ms ≤ 0.25 and more than 95% positive detections for G80 ms ≥ 0.6. For intermediate values of G80 ms, there is a region of gradual transition. In contrast, the CFE method results in sharp transitions from 0 to 100% of positive detections, with the transition level corresponding to the sensitivity level being tested.
Effect of noisy gain
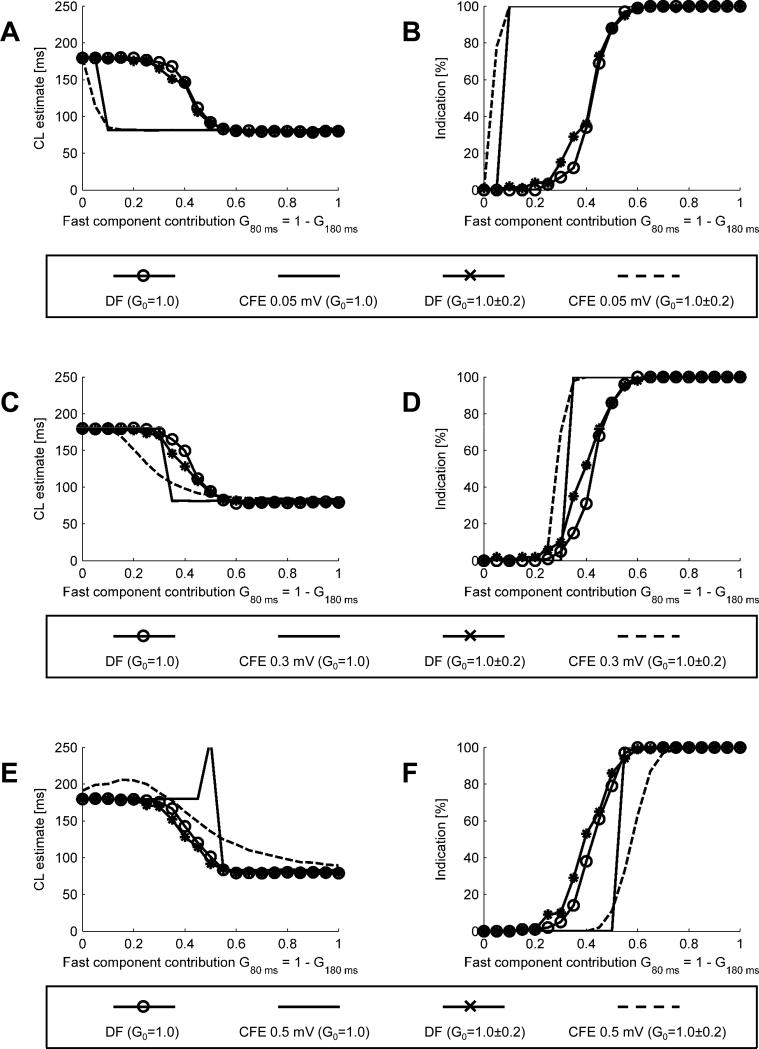
In Fig. 6, we present the results of simulations designed to evaluate how the variability of the overall signal amplitude (master gain G0) affects the results obtained using the methods under consideration. In A we show CL estimates obtained at a 0.05 mV sensing threshold. When randomly varying gain is applied (G0 = 100.0±0.2 ; i.e., 0.0±0.2 dB; for simplicity we write G0 = 1.0 ± 0.2 keeping in mind that it follows a log-normal distribution), CLDF is practically identical to that obtained at constant gain (G0 = 1.0). Application of randomly varying gain results in a smoother transition region of CLCFE. In B, the plot of percentage of indications shows that, in the presence of varying gain, the CFE method soon tends to become “all or none” in its ability to detect CL < 120 ms.
Fig. 6.
CL estimates and percentages of positive detections (CL<120 ms) obtained for varying levels of sensitivity and signal amplitude. A. CL estimates at a sensitivity threshold of 0.05 mV. B. Percentages of positive detections at sensitivity threshold 0.05 mV. C. CL estimates at a sensitivity threshold of 0.3 mV. D. Percentages of positive detections at a sensitivity threshold 0.3 mV. E. CL estimates at a sensitivity threshold of 0.5 mV. F. Percentages of positive detections at a sensitivity threshold 0.5 mV.
In Fig. 6C and D, we present similar data for TH = 0.3 mV. In C, CLCFE shows a smoother transition region. The percentages of positive detections shown in D reveal that in the CFE method a varying gain (G0 = 100±0.2) shifts the 0 to 100% transition to the left. In E and F increasing TH to 0.5 mV results in an qualitative difference. For a certain range of G80 ms (from 0 to 0.35), CLCFE is slower than the slow component. Moreover, the transition from the pure slow signal (G80 ms = 0) to pure fast signal (G80 ms = 1) is no longer monotonic. Also, for G80 ms = G180 ms = 0.5, a random number of beats (50%, on average) is able to cross the threshold TH because of the noisy gain, thus giving no sign that the threshold is too high. The percentages of indications shown in F reveal that CFE often fails to identify sites with G80 ms as high as 60%.
Effect of component frequencies
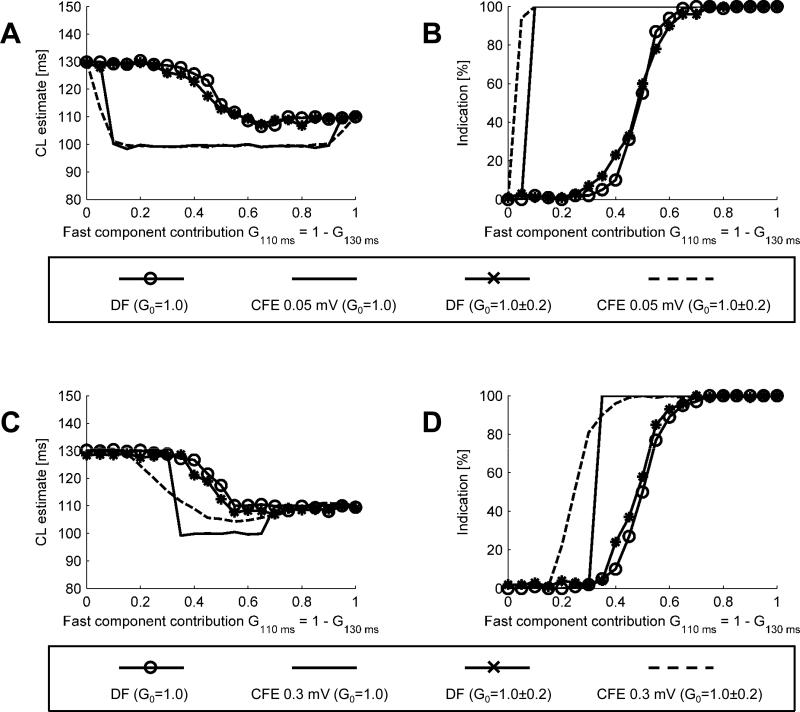
In Fig. 7 we show the CL estimates and percentages of detections of CL < 120 ms obtained for a test signal containing slow component of CL = 130 ms and fast component of CL = 110 ms, i.e. cycle lengths much closer to each other than in the previous case. In A, for CL estimates at 0.05 mV sensitivity threshold, CFE detects CLCFE = 130 ms for G110 ms ≤ 0.05 and CLCFE = 110 ms for G110 ms ≥ 0.95. For intermediate levels of fast component contributions, CFE estimates CLCFE ≈ 100 ms, which is faster than any of the test signal components. The data in B demonstrates that a decision making process based on CFE would be relatively aggressive: it would lead to ablation even when the fast signal contribution is only 5%.
Fig. 7.
CL estimates (A) and percentage of positive detections (B) for the slow component at CL = 130 ms and the fast component at CL = 110 ms ; CFE sensitivity threshold 0.05 mV. CL estimates (C) and percentages of indications (D) obtained for the slow component at CL = 130 ms and fast component at CL = 110 ms ; CFE sensitivity threshold 0.3 mV.
In C, the CL estimates obtained for a higher sensitivity threshold, 0.3 mV indicate that CFE provides accurate CL estimate for relatively pure signals (fast contribution either ≤ 0.3 or ≥ 0.7). For intermediate values, the estimates are as low as 100 ms. The detections percentage, shown in D, confirms that noisy gain also makes CFE more aggressive.
Effects of cut-off frequency
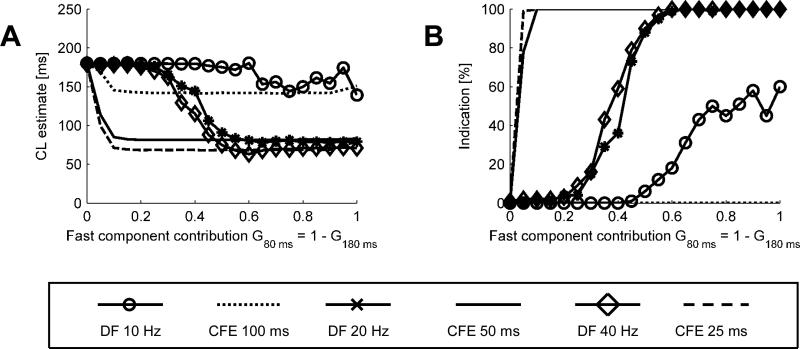
We also tested both methods for their sensitivity to refractory period (for CFE) and cut-off frequency (DF), as illustrated in Fig. 8. The tests were performed with noisy gain as described above and a sensitivity threshold TH = 0.05 mV.
Fig. 8.
CL estimates (A) and percentages of indications (B) as function of signal composition obtained for varying refractory periods (CFE) and corresponding cut-off frequency (DF).
In Fig 8A, selecting the cut-off frequency/refractory period in the range 20 to 40 Hz does not change the behavior of either method, but decreasing the frequency to 10 Hz causes both methods to produce longer CL estimates. In B we interrogate both methods for percentage of positive CL < 120 ms detections, obtained using similar conditions. Both CFE and DF retain the same characteristics while refractory period decreases from 50 ms to 25 ms. However, when refractory period increases to 100 ms, CFE fails to provide any indication, whereas DF retains some sensitivity for mostly fast signals.
Discussion
We evaluated time and frequency domain methods to test their ability to produce reliable estimates of synthetic atrial electrogram cycle lenghs in the presence of parasitic factors distorting the signal. The ultimate evaluation of the effectiveness of CFAE, CFE and DF would involve using a clinical end-point such as comparing the number of patients free of AF for each of the methods, which is beyond the scope of this report. Moreover, to our knowledge there is no mechanistic gold standard that may help to establish whether the determination of an “AF source” made by a specific method is more accurate or valid then the other. In fact, DF, CFE and CFAE look, either directly or indirectly, at the local cycle length. An electrogram with local cycle length shorter than 120 ms, is called “complex”, regardless of its morphology. Even if ablating CFAE sites seem to be effective in terminating AF, there is no solid evidence that either CFAE, DF or CFE could be the best parameter for RF ablation guidance. However, given that about 40% of left atrium may display CFE < 120 ms (7), it may be difficult to show that CFAE success relates to precise targeting of the AF sources rather than the destruction of a large atrial tissue mass. Other approaches to AF targeting have been proposed (16) that might be more suitable.
Our results show how the behavior of the CFE method depends on the sensitivity threshold. With a low (0.05 mV) sensitivity threshold, the CFE method is “aggressive”, in the sense that the contribution of a fast signal of as low as 5% of the total signal would be enough to calculate a cycle length <120ms. In the electrophysiology lab, where this method is used, this would be an indication for the clinician to ablate. This matches the empirical observations in AF patients that as much as 37% of the left atrium may have CL < 120 ms (7). Higher values of this threshold increase the level of contribution of the fast component to the overall signal, which would lead an operator in the EP lab to ablate. However, it is important to note that as the threshold increases, the method increasingly fails.
Variations in the overall signal amplitude as low as 20% (standard deviation) are enough to degrade the performance of the CFE method, especially for higher threshold levels (Fig. 6). For low sensitivity levels, the CFE method is simply unable to produce reliable results (CL was out of range) in the wide range of mixed signals (Fig. 7). Moreover, the behavior of the CFE method is non-monotonic. Therefore within a certain range of parameters, the model predicts that in the EP lab scenario, moving the catheter towards shorter CLs may paradoxically lead the physician away from the high frequency AF source.
Since we abstracted from any specific event recognition method, this reveals a common property of time-domain methods. One has to detect local activation events in the signal and subsequently count an average interval between them. In an objective version of CFE (9, 8), the detection is made automatically, using certain criteria. In the classical, subjective version of CFAE (2, 3), the physician must detect deflections from the baseline and decide whether they are “constant” or not. Our results reveal the fundamental property of the methods based on the time domain, regardless of how the events are detected (subjectively by a physician or objectively by an automatic algorithm) and how accurate the algorithm is in detecting the event.
On the other hand, in DF, a small variation in single event morphology causes only a small change in the power spectrum. Non-linear discrimination takes place in the frequency domain, which reveals some of the drawbacks of the DF method. For example, when mixed signals are analyzed, both components may carry similar spectral power; thus denoting one or another as “DF” is more prone to noise. This is reflected by the smooth transition in the positive detection characteristics. Despite such a flaw, the behavior of the DF method is more consistent than the CFE method in the context of varying signal properties. This is also reflected in the preferred strategy of using DF: one should first acquire the signals to construct a DF map of the atrium, and then ablate the fastest region rather than ablate sites with fast DF (11).
Both CFE and DF displayed similar sensitivities to the refractory period and cut-off frequency setting, respectively. However, it should be noted that the DF cut-off frequency has a slightly different meaning than the CFE refractory period. In the case of CFE, refractoriness prevents from double counting complex activation events, whereas in DF the cut-off frequency removes the high frequency bandwidth of an individual beat pattern (17).
Overall, the results presented here show that despite potentially good performance of the time-domain methods to indicate ablation sites in AF, these methods are easily prone to failure. The frequency-domain method seems to be much more robust.
Supplementary Material
Acknowledgements
Supported in part by NHLBI Grants P01-HL039707 (JJ, OB), P01-HL087226 (JJ, OB) and R01-HL080159 (JJ), R01-HL087055 (OB), by a grant from the Centro Nacional de Investigaciones Cardiovasculares (CNIC), Madrid, Spain (JJ), by University of Michigan Cardiovascular Center Gelman Innovation/Innovator Grant Award (OB), St. Jude Medical Grant (JJ, OB), and by an AHA postdoctoral fellowship (SFN).
Footnotes
Publisher's Disclaimer: This is a PDF file of an unedited manuscript that has been accepted for publication. As a service to our customers we are providing this early version of the manuscript. The manuscript will undergo copyediting, typesetting, and review of the resulting proof before it is published in its final citable form. Please note that during the production process errors may be discovered which could affect the content, and all legal disclaimers that apply to the journal pertain.
Disclosures: St. Jude Medical Grant (JJ, OB)
References
- 1.Verma A, Novak P, Macle L, et al. A prospective, multicenter evaluation of ablating complex fractionated electrograms (CFEs) during atrial fibrillation (AF) identified by an automated mapping algorithm: acute effects on AF and efficacy as an adjuvant strategy. Heart Rhythm. 2008 Feb;5(2):198–205. doi: 10.1016/j.hrthm.2007.09.027. [DOI] [PubMed] [Google Scholar]
- 2.Konings KT, Smeets JL, Penn OC, Wellens HJ, Allessie MA. Configuration of unipolar atrial electrograms during electrically induced atrial fibrillation in humans. Circulation. 1997 Mar 4;95(5):1231–41. doi: 10.1161/01.cir.95.5.1231. [DOI] [PubMed] [Google Scholar]
- 3.Nademanee K, McKenzie J, Kosar E, et al. A new approach for catheter ablation of atrial fibrillation: mapping of the electrophysiologic substrate. J Am Coll Cardiol. 2004 Jun 2;43(11):2044–53. doi: 10.1016/j.jacc.2003.12.054. [DOI] [PubMed] [Google Scholar]
- 4.Oral H, Chugh A, Good E, et al. Radiofrequency catheter ablation of chronic atrial fibrillation guided by complex electrograms. Circulation. 2007 May 22;115(20):2606–12. doi: 10.1161/CIRCULATIONAHA.107.691386. [DOI] [PubMed] [Google Scholar]
- 5.Oral H, Chugh A, Good E, et al. A tailored approach to catheter ablation of paroxysmal atrial fibrillation. Circulation. 2006 Apr 18;113(15):1824–31. doi: 10.1161/CIRCULATIONAHA.105.601898. [DOI] [PubMed] [Google Scholar]
- 6.Oral H, Chugh A, Lemola K, et al. Noninducibility of atrial fibrillation as an end point of left atrial circumferential ablation for paroxysmal atrial fibrillation: a randomized study. Circulation. 2004 Nov 2;110(18):2797–801. doi: 10.1161/01.CIR.0000146786.87037.26. [DOI] [PubMed] [Google Scholar]
- 7.Roux JF, Gojraty S, Bala R, et al. Complex fractionated electrogram distribution and temporal stability in patients undergoing atrial fibrillation ablation. J Cardiovasc Electrophysiol. 2008 Aug;19(8):815–20. doi: 10.1111/j.1540-8167.2008.01133.x. [DOI] [PubMed] [Google Scholar]
- 8.Wu J, Estner H, Luik A, et al. Automatic 3D mapping of complex fractionated atrial electrograms (CFAE) in patients with paroxysmal and persistent atrial fibrillation. J Cardiovasc Electrophysiol. 2008 Sep;19(9):897–903. doi: 10.1111/j.1540-8167.2008.01145.x. [DOI] [PubMed] [Google Scholar]
- 9.EnSite 3D Mapping System Chapter 1: EnSite NavX Basics http://www.sjmprofessional.com.edgesuite.net/sjmprofessional/af/Ensite-Part1-NavX.wmv. Chapter 2: EnSite Fusion http://www.sjmprofessional.com.edgesuite.net/sjmprofessional/af/Ensite-Part2-DigitalImageFusion.wmv. Chapter 3: CFE Maps http://www.sjmprofessional.com.edgesuite.net/sjmprofessional/af/Ensite-Part3-FractionalMapping.wmv.
- 10.Berenfeld O, Mandapati R, Dixit S, et al. Spatially distributed dominant excitation frequencies reveal hidden organization in atrial fibrillation in the Langendorffperfused sheep heart. J Cardiovasc Electrophysiol. 2000 Aug;11(8):869–79. doi: 10.1111/j.1540-8167.2000.tb00066.x. [DOI] [PubMed] [Google Scholar]
- 11.Atienza F, Almendral J, Jalife J, et al. Real-time dominant frequency mapping and ablation of dominant frequency sites in atrial fibrillation with left-to-right frequency gradients predicts long-term maintenance of sinus rhythm. Heart Rhythm. 2009 Jan;6(1):33–40. doi: 10.1016/j.hrthm.2008.10.024. [DOI] [PMC free article] [PubMed] [Google Scholar]
- 12.Atienza F, Almendral J, Moreno J, et al. Activation of inward rectifier potassium channels accelerates atrial fibrillation in humans: evidence for a reentrant mechanism. Circulation. 2006 Dec 5;114(23):2434–42. doi: 10.1161/CIRCULATIONAHA.106.633735. [DOI] [PubMed] [Google Scholar]
- 13.Sanders P, Berenfeld O, Hocini M, et al. Spectral analysis identifies sites of high-frequency activity maintaining atrial fibrillation in humans. Circulation. 2005 Aug 9;112(6):789–97. doi: 10.1161/CIRCULATIONAHA.104.517011. [DOI] [PubMed] [Google Scholar]
- 14.Ng J, Kadish AH, Goldberger JJ. Technical considerations for dominant frequency analysis. J Cardiovasc Electrophysiol. 2007 Jul;18(7):757–64. doi: 10.1111/j.1540-8167.2007.00810.x. [DOI] [PubMed] [Google Scholar]
- 15.Stiles MK, Brooks AG, Sanders P. Putting CFAE on the Map. J Cardiovasc Electrophysiol. 2008 Sep;19(9):904–6. doi: 10.1111/j.1540-8167.2008.01212.x. [DOI] [PubMed] [Google Scholar]
- 16.Vigmond E, Tsoi V, Yin Y, Page P, Vinet A. Estimating Atrial Action Potential Duration From Electrograms. IEEE Trans Biomed Eng. 2009 Feb 20; doi: 10.1109/TBME.2009.2014740. [Epub ahead of print] [DOI] [PubMed] [Google Scholar]
- 17.Fischer G, Stühlinger MCh, Nowak CN, Wieser L, Tilg B, Hintringer F. On computing dominant frequency from bipolar intracardiac electrograms. IEEE Trans Biomed Eng. 2007 Jan;54(1):165–9. doi: 10.1109/TBME.2006.883739. [DOI] [PubMed] [Google Scholar]
Associated Data
This section collects any data citations, data availability statements, or supplementary materials included in this article.


