

Abstract
A decision is a commitment to a proposition or plan of action based on evidence and expected costs and benefits associated with the outcome. Progress in a variety of fields has led to a quantitative understanding of the mechanisms that evaluate evidence and reach a decision1-3. Several formalisms propose that a representation of noisy evidence is evaluated against a criterion to produce a decision4-8. Without additional evidence, however, these formalisms fail to explain why a decision-maker would change her mind. Here, we extend a model, developed to account for both the timing and accuracy of the initial decision9, to explain subsequent changes of mind. Subjects made decisions about a noisy visual stimulus, which they indicated by moving a handle. Although they received no additional information after initiating their movement, their hand trajectories betrayed a change of mind on some trials. We propose that noisy evidence is accumulated over time until it reaches a criterion, or bound which determines the initial decision and that the brain exploits information that is in the processing pipeline when the initial decision is made to subsequently either reverse or reaffirm the initial decision. The model explains both the frequency of changes of mind as well as their dependence on both task difficulty and whether the initial decision was accurate or erroneous. The theoretical and experimental findings advance the understanding of decision making to the highly flexible and cognitive act of vacillation and self-correction.
Decision-making spans a vast range of types and complexity, from choosing your partner, deciding whether to dive left or right to save a goal or simply when to lift your finger. Studies of simple perceptual decisions have shed insight into the neurobiological mechanisms responsible for decision-making in both monkeys and humans (for reviews, see1-3,10). These studies often require a binary choice between two possible stimulus categories, such as leftward or rightward motion. Psychophysical and neural data1 support a model termed drift diffusion6, random walk5,7 or race8 in which a decision is made when the accumulated noisy evidence (decision variable) reaches a criterion level, termed a decision bound. Such an accumulation process explains both the choice and accuracy of decisions over a range of difficulty levels as well as the time required to make the decision9. They are naturally viewed as an extension of signal detection theory and Bayesian inference to streams of data over time4,11. One important limitation of these models is that they fail to explain why a decision-maker might change their mind after an initial decision has been taken. In some instances, such changes can lead to the correction of an initial error12,13. Here we develop a task in which we can monitor changes of mind. We then extend the bounded diffusion framework to explain both the frequency and pattern of changes of mind.
Three naïve participants observed a moving random dot stimulus and made decisions about the direction of motion (leftward or rightward), which they indicated by moving a handle to a left or right target (Fig. 1a). Critically, the moving dots were extinguished as soon as the subjects initiated their movement (Fig. 1b) and hence subjects could not acquire new evidence during their movement. The choice at initiation (initial hand trajectory) and reaction times as a function of task difficulty (coherence of dot motion) were explained by a bounded drift-diffusion model (Fig. 2, black curves) consistent with previous studies in humans and monkeys1,9,14. According to this model, evidence is accumulated until it reaches one of two bounds (corresponding to leftward and rightward decisions), which determines the choice and decision time.
Figure 1.
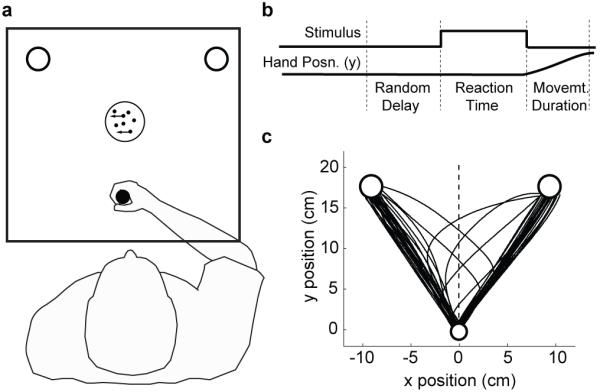
Experimental paradigm. a, Schematic of the visual display (rectangle). Subjects held the handle of a robotic interface (shown here in the home position, circle) and moved to either a left or right circular target depending on the perceived motion direction of a central random-dot display. A mirror system prevented subjects from seeing their arm. b, The time course of events that make up a trial. Each trial started when the subject’s hand was in the home position. After a random delay, the dots became visible and the subject could view the moving dot stimulus as long as they needed (up to 2 sec). Subjects indicated the direction of dot motion by moving to the left or right target. As soon as the subjects moved out of the home position, the motion stimulus vanished. The trial ended when the subject reached one of the two targets. c, Sample hand trajectories from one subject. Most trajectories are directly from the home position (bottom circle) to one of the choice targets. On a fraction of trials, the trajectories change course during the movement demonstrating a change of mind.
Figure 2.

Accuracy improves through “changes of mind”. Data are from three subjects. The top row shows the probability of a correct decision at initiation (black) is lower that at termination (red) for almost all motion strengths. The bottom row shows initiation times are longer for weaker motion strengths. Solid curves are fits to the data of the bounded evidence accumulation model (R2 of fits for subjects S, A & E for initial decision 0.96, 0.95 & 0.98, for final decision 0.98, 0.96 & 0.99 and for reaction times 0.92, 0.74 & 0.87). In this model, processing after initial commitment leads to an improvement in performance during the post-initiation phase. Error bars are s.e.m.
Although no further visual information was available after movement initiation, the hand trajectories (Fig. 1c) gave a clear indication that on some trials observers changed their mind. That is subjects generated a curved hand path that initially was on course to reach one target, but changed during the movement to finish on the other target. Although some changes of mind resulted in errors, the majority corrected an initial error. Changes of mind reliably improved accuracy (Fig. 2 top row, black and red circles for the initial and final choice, respectively) for all three subjects by improving sensitivity to motion (p<0.006 for each subject).
The observation is seemingly paradoxical. If there is information available to make a better decision, why does it fail to influence the initial decision? Every normative, ‘ideal observer’ based theory of decision-making would posit the decision as an inference on the available evidence. The paradox is resolved if the decision-maker does not use all of the available evidence to make the initial choice but can tap into further information in the period between commitment to the initial response and termination of the movement.
Although the stimulus vanishes upon movement initiation, there is information in the processing pipeline that is potentially available to the decision-maker after movement initiation. Sensory and motor processing latencies ensure that not all of the information available from stimulus onset to movement initiation contributes to the decision. The sum of these latencies, termed the non-decision time (tnd), is estimated to be 300-400 ms in our experiments (Supplementary Table 1; Methods). Single unit recordings from the lateral intraparietal area (LIP) of the macaque in eye movement versions of this task, suggest the non-decision time includes sensory and motor delays of around 220 ms and 80 ms, respectively15,16. We hypothesized that the unused information could be processed after the brain has committed to an initial choice, thereby requiring an extension of the bounded diffusion mechanism that includes post-initiation processing.
An analysis of the motion evidence leading to the subjects’ choices supports this hypothesis. Each stimulus is a noisy sequence of random dots, which lead to rapid fluctuations in the motion evidence, as quantified by motion energy16,17 favoring left or right. For each trial, we removed the average motion energy associated with that motion strength and direction, leaving only the moment-to-moment fluctuations about the mean. We then averaged these residuals to look for evidence in the stimulus in support of the subjects’ initial choice. The stimulus fluctuations immediately after stimulus onset supported the initial choice (Fig. 3a, left blue curve; average over first 150 ms is positive, p<0.0001), whereas the fluctuations in the final few hundred ms had little bearing on the choice. For each subject, we identified the time point when the average came within 1 s.e. of zero (arrows), thus providing an empirical estimate of non-decision time. Notice that the motion energy filtering induces a delay of 50-150 ms (Fig 3a, insert). Taking this into account, the initial choices depend on the earliest information in the stimulus, but ignore an epoch on the order of tnd.
Figure 3.

A bounded accumulation model of decision making with post-initiation processing explains change of mind. a, Influence of motion energy fluctuations on initial and final decisions. Data are shown for all the trials (blue) and the subset of trials with a change of mind (red) aligned at stimulus onset (left) and movement onset (right). Motion energy fluctuations were obtained by applying a filter to the sequence of random dots shown on each trial and subtracting off the mean for all trials sharing the same motion strength and direction (see Methods). The residual fluctuations are designated positive if they support the direction of the initial decision. Shading indicates s.e.m. Arrows indicate the time preceding movement initiation that the average motion energy fluctuations for each subject falls to within 1 s.e. of zero. The inset shows the impulse response for the filter used to calculate motion energy. b, The model explains the probability of changes of mind from incorrect to correct choices (model, red curves; data red symbols) and changes of mind from correct to incorrect choices (black curves; black symbols) as a function of stimulus coherence. Error bars are s.e.m. c, Information flow diagram showing visual stimulus and neural events leading to a decision and a possible change of mind. The example illustrates a rightward motion stimulus which gives rise to an initial incorrect leftward choice with reaction time around 500 ms. The visual stimulus gives rise to a decision variable (blue trace) that is the accumulation of noisy evidence. This governs the initial choice and decision time. Data from neural recordings15,16 suggest that the delay from motion onset to the beginning of this accumulation (ts) is around 200 ms. The initial decision is complete when a ‘Right’ or ‘Left’ bound is crossed (i.e., ±B of evidence has accumulated). The example shows an initial decision for left. The time of the termination is around the mean decision time for the three subjects. Further accumulation takes place on the evidence still in the processing pipeline and if the accumulated evidence reaches the opposite “change of mind” bound then the decision is reversed (red), otherwise it is confirmed if the deadline is reached (green).
The pattern is different for the subset of trials in which there is a change of mind. The early information from the stimulus provided weaker support for the initial choice (left red trace) and exhibited a negative trend near the time of initiation (right red trace), in support of the final, changed decision. The motion energy in this later epoch was significantly more negative compared to the motion energy on the remaining trials (p<0.0001). The observation provides evidence against two main alternatives to post-initiation processing: (1) change of decision based on recall and/or reconsideration of evidence acquired before initiation18, and (2) a correction of an initial motor error perhaps owing to confusion about the stimulus-response mapping12. The analysis instead supports a non-decision time in which information from the stimulus arrives too late to affect an initial decision but is present to refine it after the brain has committed to a particular response and action.
We next consider how this extended processing could explain the pattern of changes of mind in the data. In particular, we wished to explain the proportion of changes to correct and to erroneous choices as a function of motion strength (Fig. 3b, red and black symbols, respectively). Consider a seemingly optimal solution to the problem. Suppose the subject wishes to use changes of mind to maximize the percentage of correct final choices. Then the subject ought to continue to accumulate evidence about direction until there is no more to be had (i.e., tnd) and to decide in favor of the more likely direction. This formulation holds regardless of the tradeoff between speed and accuracy underlying initial choice. This idea fails to explain our findings: it predicts too many changes and it would defer them to the end of the evidence stream, which is clearly not the case (Fig 1c). Because the subject must complete a hand movement, the optimal solution is likely to incorporate motor costs (energy) associated with larger corrections nearer the end of the movement. This idea can be captured by incorporating new bounds in the post-decision period to change or reaffirm an initial decision based on some criterion, thereby allowing changes to occur earlier in the movement. We considered a variety of models (see Methods). The most parsimonious of these is illustrated in Figure 3b. In this model, once the initial bound has been reached and a decision made, evidence continues to accumulate until it either reaches a new “change of mind” bound or a time-deadline terminates post-initiation processing. The decision rule is to change only if the accumulated evidence reaches the change bound and to reaffirm otherwise. The offset of the new bound and deadline (2 parameters) were fit to account for the changes of mind as a function of coherence (curves in Fig. 3b).
For all three subjects, the model fits imply that upon termination of the initial decision, the subjects set a new bound at a level that would necessitate a reversal of the sign of the accumulated evidence. The amount of evidence required for a subject to change their mind (Table 1, BΔ) differed by ~30% across subjects, which explains the variation in the pattern of their changes. In all cases, the existence of this change-bound led to a significant improvement in the fits, compared to using all the available information (i.e., no bound and choice based on sign of decision variable after tnd, p<0.003 for all subjects, likelihood ratio test). The deadline produced by the fit suggests that subjects avail themselves of most of the information in the processing pipeline. The model captures the complex dependence of post-initiation changes on both the motion strength and the initial decision (R2 = 0.63-0.85 and 0.76-0.99 for changes to correct and incorrect, respectively). Notice that changes of mind are most frequent at intermediate motion strengths when the initial choice was erroneous. The model offers an intuitive explanation. Viewed as a decision process beginning at the initial decision bound, there is a higher probability of reaffirming the initial choice, because the accumulated evidence is far from the change of mind bound. A change of mind therefore requires strong evidence in the short time available for post-initiation processing to move the accumulated evidence to the change-of-mind bound. Such strong evidence ought to arrive when the initial choice is an error and when the motion is strong. However, if the motion is very strong, initial errors are rare.
Our central finding is that the same data stream may be sampled at different moments to support different decisions, hence a change of mind. As a further test of this idea, we placed the timing of the initial decision under experimental control. This allowed us to isolate changes of mind from the strategies governing the tradeoff of speed versus accuracy of initial decisions in the RT experiment. Instead of responding when ready, subjects were trained to time the initiation of their movement so that it coincided with an expected auditory beep. The stimulus motion began at a random time 200-2000 ms (mean 440 ms) before the beep and ended at the beep or at movement initiation, whichever occurred first (see Methods). This experiment therefore tested whether our suggested framework generalizes to a situation in which the time of the initial choice is determined by an exogenous cue. The results of this experiment, which are summarized in Supplementary Figures 1-3, confirm the finding that subjects base their initial choice on early evidence but can avail themselves of additional evidence in the processing pipeline to revise this choice. These data also conform to a variant of the bounded accumulation mechanism with post initiation processing (see Methods and Supplementary Figures 2 & 3).
We expect the change-of-mind mechanism to apply under a wide variety of conditions if there is time pressure to respond. When two of our subjects were instructed to perform the reaction time experiment more slowly, their initial decisions were more accurate and there were fewer changes of mind (data not shown). The pattern was explained by the same model with higher initiation bounds9. Also, because in our study the subject must complete an arm movement, the optimal solution is likely to trade-off accuracy against motor costs (energy) associated with larger corrections nearer the end of the movement. Determining the optimal bounds for such a trade-off will require coupling concepts derived from theories of optimal feedback control19 and decision-making models. We suspect that more complex situations, for example in which movements must be timed more precisely or when a correction is more costly, might necessitate both a reaffirmation bound and bounds whose height varies over time.
Our proposed mechanism cannot explain all changes of mind. For example, it would not explain corrections of initial errors that arise from confusion about stimulus-response associations12. Further, a change that depends on retrieval of information from memory or incorporation of a new decision policy (e.g., values) would require elaboration of the model. Presumably these types of vacillations could be based on more complex processes that involve memory retrieval or application of a new criterion on a stored decision variable.
Advances in understanding the neurobiology of decision-making has benefited from simple perceptual tasks18,20,21, but the same principles appear to underlie decisions related to foraging2, gambling22, social selection23, and probabilistic reasoning24. The common principle is that the representation of information bearing on choice is imperfect, thus inviting the application of some criterion against which to judge the evidence. Such criteria balance the expected loss associated with two types of errors, owing to either a lax or conservative criterion. The class of bounded diffusion models5-7,25,26 extends this theory of signal classification4 to data streams and thus incorporates time costs as well27,28. An unexpected virtue of such models demonstrated by our experiment is that a part of the data stream that is not used to make the decision can nonetheless support revision after a response is initiated.
This formalism provides a new view of decision making in which subjects can exploit the expectation that late arriving information may or may not be useful to refine a decision or action. We suspect that when a change of decision is costly, energetically or otherwise, subjects would naturally tend to shun this strategy and opt for longer initial decision times. It is precluded when an action is ballistic, for instance when a subject makes an eye movement to a choice target9,15. In these instances, change-of-mind can only lead to a post-decision regret29 or possibly a learning signal even in the absence of overt feedback. On the other hand, a variety of complex motor sequences might benefit from early initiation premised on the expectation of additional information that is in the pipeline. It is well known that the initiation and final specification of a movement can be dissociated in time30. What we have shown here is that when these processes act on the same data stream, they can lead to a change in a decision. We speculate that a common neural mechanism explains refinement of a movement after initiation and what we experience cognitively as a change of mind about a proposition.
Methods Summary
Three naïve subjects performed the main experiment. The local ethics committee approved the protocol. Subjects moved a handle in the horizontal plane. A mirror/CRT system overlaid virtual images into the plane of the movement. The hand position was displayed as a small blue circle. After a random delay, a dynamic random dot stimulus appeared (Fig. 1). On each trial the direction of motion was randomly chosen left or right. Task difficulty was varied randomly by controlling the fraction of coherently moving dots. The subjects were instructed to judge the net direction of motion as fast and as accurately as they could, and to reach a left or right choice target. The motion stimulus was extinguished when the movement was initiated. The trial ended when the subject reached one of the targets. Subjects performed an initial training session of at least 500 trials followed by 1500 test trials.
We recorded the hand trajectories at 1000 Hz. For each trial, we measured the reaction time and the final target selection. Normally hand movements for easy trials (high coherence) were straight to the target. A change of mind was reflected in a trajectory that initially headed for one target but ended at the other. We calculated the area between the hand path and the line from the starting position to the midpoint between the two targets. A change of mind was detected if the area carved out by the hand on the side opposite to the final chosen target exceeded 0.1 cm2. In a control experiment with 100% coherent motion, this criterion detected no change-of-mind trials, suggesting that our detection strategy is conservative. We were, therefore, able to determine for each trial the choice at both initiation and termination of the movement.
Supplementary Material
Supplementary Information is linked to the online version of the paper at www.nature.com/nature.
Acknowledgments
This work was supported by the Wellcome Trust, the European grant SENSOPAC IST-2005-028056, Howard Hughes Medical Institute (HHMI), and National Eye Institute Grant EY11378. We thank Aldo Faisal, Hugo Vincent, Ian Howard, James Ingram for their assistance. MNS thanks Trinity College, Cambridge for support.
Appendix
Methods
Behavioral task
Four naïve subjects (three male and one female) provided informed consent and participated in the experiment. The local ethics committee approved the protocol. Three subjects performed each of the reaction time and cued experiments (two subjects, S and E, performed both, with the reaction time experiment first). Subjects were seated and used their preferred hand to hold the handle of a vBOT manipulandum31 that was free to move in the horizontal plane (Fig. 1a). Subjects were prevented from seeing their arm by a mirror/CRT system that was used to overlay virtual images into the plane of the movement (updated at 75 Hz). A chin and headrest ensured a viewing distance of 40 cm. The hand position was displayed as a small blue circle (radius 0.5 cm = 0.7° at the centre of the screen).
The time course of a trial in the reaction time experiment is shown in Figure 1b. A trial began when the subject’s hand was in the home position (white circle with radius 1 cm, Fig. 1a). After a random delay, sampled from a truncated exponential distribution (range 0.7-1.0 s, mean 0.82 s), a dynamic random dot stimulus appeared at the centre of the screen within a 5° diameter circular aperture. The motion stimulus is described in detail in previous studies15. On each trial the direction of motion was randomly chosen left or right. The stimulus density was 15.6 dots deg-2 s-1. Dots were displayed for one video frame and then either replaced at a random position or displaced to the left or right 3 video frames (40 ms) later. This displacement would produce a speed of 7.1° s-1. Thus the positions of dots in frame 4, say, were correlated only with the displaced dots in frames 1 and/or 7 but with none of the dots in frames 2, 3, 5, and 6. The probability that each dot would be displaced as opposed to randomly replaced, termed the percent coherence, determined the task difficulty and was selected randomly from [0, 3.2, 6.4, 12.8, 25.6, 51.2]%.
The subjects were instructed to judge the direction of the moving random dots as fast and as accurately as they could, and to reach to a corresponding target (left and right, radius 1.5 cm, 20 cm away from the starting position and 28° from the midline, Fig. 1a). Critically, when the movement was initiated, that is the hand crossed the boundary of the home position circle, the random dots stimulus was extinguished. Subjects were required to reach the target with a movement duration of 500±200 ms. The trial ended when the subject reached one of the targets. Subjects were provided with visual feedback of whether they had made the correct choice (for the 0% coherence trials, half the trials were randomly designated “correct”). Subjects were instructed to maintain fixation throughout at a small cross in the centre of the dot aperture—the targets were large enough that they could be easily reached using peripheral vision. Subjects performed an initial training session of at least 500 trials followed by 1500 test trials.
In the cued movement task, subjects heard 5 beeps equally spaced in time (500 ms spacing) and were required to initiate movement on the 4th beep and reach the target on the 5th beep (Supplementary Figure 1a). Random dot motion began at a random interval before the 4th beep (truncated exponential distribution, range 0.2 to 2 s, mean 0.44 s). The motion display was extinguished on the 4th beep or at the time of movement initiation if the subject slightly anticipated the beep. Feedback was provided to maintain movement initiation and termination within ±100 ms of the 4th and 5th beeps, respectively. Again, subjects were given feedback of whether they had made the correct choice. Subjects performed an initial training session of 500 trials of training followed by 2000 test trials.
Data Analysis
We recorded the hand trajectories at 1000 Hz. For each trial, we quantified the reaction time (time to initiate movement from start of motion stimulus) and the final target selection. In addition, we developed a measure, based on the hand trajectories, of whether subjects had changed their decision during the movement. Normally hand movements for easy trials (high coherence) were straight to the target (Fig. 1c). A change of mind was reflected in a trajectory that initially headed for one target but ended at the other. We calculated the area between the hand path and the line from the starting position to the bisector of the two targets. A change of mind was deemed to have occurred if the area carved out by the hand on the side opposite to the final chosen target exceeded 0.1 cm2 and the point of maximum horizontal deviation was outside the home position. These values were chosen based on a control experiment with two of our subjects using the reaction time condition but with 100% coherent motion stimuli. We expect to see few, if any, changes of mind in this condition and using these values there were no change of mind trials suggesting that our criteria for determining changes of mind is conservative. We were, therefore, able to determine for each trial the choice at both initiation and termination of the movement.
Modelling
For the reaction time experiment (Figs. 2 and 3), we adapted a bounded accumulation model (Fig. 3c) to explain the initial and final choice frequencies (Fig. 3b). We first explain the model for the initial choices and then expand it to explain changes of mind.
For the initial choices, the model posits that evidence accumulates from a starting point, y0, until it reaches an upper or lower bound (±B), which determines the initial choice and decision time. The increments of evidence are idealized as Normally distributed random variables with unit variance per second and mean μ = kC + μ0, where C is signed motion strength (positive=rightward and negative=leftward motion); k, B, y0 and μ0 are free parameters. The parameters B and k explain the tradeoff between speed and accuracy of the initial choices; μ0 and y0 are drift and starting point offsets, which explain bias for one of the choices. The bias terms were not necessary for all subjects (see Supplementary Table 1).
This formulation leads to the following simplification32, which may help to provide an intuition for the effect of motion strength on initial choice and reaction time. If y0 = 0, the probability of a rightward initial choice is
and the mean decision time is
The reaction time incorporates additional latencies from stimulus onset to the beginning of the bounded accumulation process and from the termination of the process to the beginning of the motor response. The sum of these latencies, the non-decision time tnd, is an additional parameter of the model such that the measured reaction time is td +tnd, which we set for each direction choice.
Since the stimulus duration on each trial equals the reaction time, there is additional evidence from the stimulus that is potentially available for processing after the brain has committed to an initial choice. The model incorporates this additional information as follows. When the initial decision ends, the accumulation continues (from ±B) until either a second, post-initiation “change of mind” bound is crossed to reverse the decision or a temporal deadline is exceeded, in which case the initial decision is reaffirmed (Fig. 3c). The height of this new bound was offset by BΔ from the initiation bound. A value of BΔ=B would imply that a change of mind occurs when the evidence changes sign; a value of BΔ=2B would imply that a change requires an amount of net evidence represented by the initial bounds. The values for our subjects were between B and 2B.
The fits to the initial choices and reaction times provide the sensitivity parameter (k), initial bounds (B), and non-decision times (tnd) employed in the post-initiation analyses. We then entertained a series of plausible models for the post-initiation phase. These models were intended to explain the observed initial and final choices (bivariate observations: left-left, left-right, etc.) given fixed values for k, B, and the left and right tnd. The strategy ensures that all comparison models are on equal footing, and the number of parameters for post-initiation is small. We compared an “optimal” model using all available evidence (no additional degrees of freedom [df]), a single flat change of mind bound (df=1), a flat change of mind bound with a deadline (as described above, df=2), flat bounds for change of mind and for reaffirmation (df=2) (and all of the previous models but with quadratic collapsing bounds (extra 1-2 df to parameterize the collapse). We used a likelihood ratio test for nested models and supported these comparisons using the Bayes Information Criterion33. Based on these comparisons, we adopted the simplest model that accounted for all the subjects’ data (Fig. 3c): a single change bound and a cutoff that would censor late information acquired during tnd. The parameters for this model are in the bottom two rows of Supplementary Table 1. All fits were performed using maximum likelihood. Model choice probabilities and reaction time distributions were derived from numerical solutions of Fokker-Planck equations for the bounded diffusion process34.
While there appear to be a large number of parameters used to model the initial and final choices, the strategy is conservative and intuitive. We used six parameters for the fits to the initial choices and reaction times in order to ensure that the estimates of parameters that affect the post-initiation phase (k, B and tnd) are as accurate as possible. A model with just 3 parameters furnishes acceptable fits for the initial choices and RT for all three subjects, but the additional parameters explain the small biases in two of the subjects and the 4-10 ms difference in tnd for left and right choices. Although several of these terms have negligible effects for one or more subjects (see Supplementary Table 1), they produce more accurate estimates of k, B and tnd. As noted above, the simple 2-parameter model used to fit the post-initiation data was supported by an extensive model comparison. To perform this model comparison with as much power and sensitivity as possible, it was necessary to place all models on equal footing by supplying the best possible values for the inherited parameters (k, B and tnd). In particular, we did not want to justify a more complicated model (e.g., collapsing bounds) simply because the additional degrees of freedom could explain residual error in k and B. Our strategy was conservative in that it tends to reduce the explanatory power of more complex models for changes of mind.
We also performed a cross-validation analysis to ensure that the large number of parameters in our fit to the reaction time data did not lead to over fitting. We split each subject’s dataset into two equal halves (random permutation of trials at each motion strength) and fit each separately. We used the fits from one half to predict the other half of the data. The cross-validation fits, goodness of fit and parameter estimates are shown in Supplementary Figure 4 and Supplementary Tables 3 & 4. The similarity of the predictions and fits provides reassurance that the model is not over parameterized.
A simpler version of the model was used to fit data from the cued movement experiment (Supplementary Figs. 2 and 3). Here the non-decision time, tnd, delimits the portion of the data stream available for the initial choice. On a trial in which the stimulus is displayed for tstim, subjects can use td = tstim − tnd of the data stream (or no information if the stimulus duration is shorter than the non-decision time) to determine their initial choice and a further tnd (or the stimulus duration if shorter than tnd) to potentially revise their decision. Put simply, the initial choice is governed by the sign of the decision variable after td of diffusion, whether or not it has terminated. Post-initiation processing occurs on the remaining data stream until reaching either the right or left choice bound. The same symmetric bounds were used before and after initiation. A key difference from the reaction time experiment is that once the accumulated evidence has reached a bound, the diffusion process terminates and there is no opportunity for a change of mind. Thus only non-terminated decisions after td are eligible for a change of mind. This seems sensible because, unlike the reaction time experiment, the subject does not choose the time of initiation. Termination of the process is tantamount to accepting that the level of evidence is sufficient for a choice. Model fits (for three parameters: k, B, tnd) were obtained using maximum likelihood methods. Since initiation is timed to coincide with an external ‘beep’ in this experiment, the main effect of the bounds is to curtail the improvement in accuracy that would be expected for perfect integration for long td16. The initial and final choice probabilities were derived by numerical solution of Fokker-Planck equations on each trial using the same stimulus durations as in the data set.
Statistical Analysis
Unless otherwise stated, p-values are based on t-statistics constructed from parameter estimates and their associated standard errors. We calculated the standard errors by using the inverse Hessian from maximum likelihood fits wherever possible, or a bootstrap procedure35 when the numerical solution of the Fokker-Planck equation did not support accurate calculation of the Hessian. For the fraction of tnd, we report the 95% CI (method of fiducial limits36, likelihood ratio test) because this parameter is bounded by 0 and 1. The R2 values accompanying the model fits were calculated as one minus the fraction of unexplained variance for the data points displayed in the graphs. To evaluate the differences between initial and final choice probabilities, we did not rely on the model in Fig. 3 but instead performed logistic regression.
where C is signed coherence and I is an indicator variable (0 for initial choice and 1 for the final choice). To test for improved sensitivity (accuracy) with changes of mind, we evaluated the null hypothesis {H0 :b3 ≤ 0}. An alterative formulation—probability correct as a function of unsigned motion strength—confirmed the statistical significance of this analysis as well as the analysis of the cued motion experiment.
For the motion energy analyses, we extracted a time series from the sequence of random dots shown on each trial by applying a filter for right and left motion with passband centered at 1.0 cyc deg-1 and 7.1 Hz, thus matching the speed and dot displacement in our stimulus (for details, see16,17). The difference in these time series represents momentary evidence in favor of one or the other choice. To combine data across trials, we removed the average motion energy associated with each trial’s motion strength and direction. We then applied a sign convention so that positive fluctuations are in the direction of the subject’s initial choice. The graphs in Figure 3a and Supplementary Figure 2b show these averaged residuals, time locked to either stimulus onset or movement initiation.
For the statistical analysis of the motion energy time locked to movement initiation, we used the data from all trials (blue curves) to identify the point in time (for each subject) when stimulus motion fluctuations no longer influence the initial choice, using an arbitrary value of 1 s.e. from zero. This procedure furnishes a model-free estimate of tnd. We analyzed the motion energy from the change-of-mind trials from this time until movement initiation. To test whether the total motion energy in an epoch differs significantly from zero, we applied a permutation test (randomization of the sign of motion energy on each trial)35. To compare the motion energy on change-of-mind and reaffirmation trials, we applied a bootstrap procedure. We calculated the total motion energy in the change of mind trials using the epoch defined above and compared this to the distribution of values obtained in randomly resampled trials without change of mind over the identical epochs. This bootstrap comparison compensated for a lack of power owing to relatively few change of mind trials (e.g., neither of the trends in the left red curves of Fig. 3a and Supplementary Fig. 2b are significantly different from zero).
Methods references
- 31.Howard IS, Ingram JN, Wolpert DM. A modular planar robotic manipulandum with end-point torque control. J Neurosci Methods. 2009;181(2):199–211. doi: 10.1016/j.jneumeth.2009.05.005. [DOI] [PubMed] [Google Scholar]
- 32.Shadlen M, Hanks T, Churchland A, Kiani R, Yang T. The speed and accuracy of a simple perceptual decision: a mathematical primer. In: Doya K, et al., editors. Bayesian Brain: Probabilistic Approaches to Neural Coding. 2006. pp. 209–237. [Google Scholar]
- 33.Kass RE, Wasserman L. A reference Bayesian test for nested hypotheses and its relationship to the Schwarz criterion. J. Am. Stat. Assoc. 1995;90(431):928–934. [Google Scholar]
- 34.Karlin S, Taylor HM. A second course in stochastic processes. Academic Press; 1981. [Google Scholar]
- 35.Efron B. The Jacknife, the Bootstrap and Other Resampling Plans. Society for Industrial and Applied Mathematics; Phildelphia, PA: 1982. [Google Scholar]
- 36.Wang YH. Fiducial Intervals: What Are They? American Statistician. 2000;54(2):105–111. [Google Scholar]
References
- 1.Gold JI, Shadlen MN. The neural basis of decision making. Annu. Rev. Neurosci. 2007;30:535–574. doi: 10.1146/annurev.neuro.29.051605.113038. [DOI] [PubMed] [Google Scholar]
- 2.Sugrue LP, Corrado GS, Newsome WT. Choosing the greater of two goods: neural currencies for valuation and decision making. Nat. Rev. Neurosci. 2005;6(5):363–375. doi: 10.1038/nrn1666. [DOI] [PubMed] [Google Scholar]
- 3.Glimcher PW. Decisions, uncertainty, and the brain: the science of neuroeconomics. MIT Press; 2004. [Google Scholar]
- 4.Green DM, Swets JA. Signal detection theory and psychophysics. Wiley; New York: 1966. [Google Scholar]
- 5.Laming DRJ. Information theory of choice reaction time. Wiley; New York: 1968. [Google Scholar]
- 6.Ratcliff R, Rouder JN. Modelling response times for two-choice decisions. Physiol. Sci. 1998;9(5):347–356. [Google Scholar]
- 7.Link SW. The relative judgment theory of two choice response time. J Math. Psychol. 1975;(12):114–135. [Google Scholar]
- 8.Smith PL, Vickers D. The accumulator model of two-choice discrimination. J Math. Psychol. 1988;(32):135–168. [Google Scholar]
- 9.Palmer J, Huk AC, Shadlen MN. The effect of stimulus strength on the speed and accuracy of a perceptual decision. J. Vis. 2005;5(5):376–404. doi: 10.1167/5.5.1. [DOI] [PubMed] [Google Scholar]
- 10.Heekeren HR, Marrett S, Ungerleider LG. The neural systems that mediate human perceptual decision making. Nat Rev Neurosci. 2008;9(6):467–479. doi: 10.1038/nrn2374. [DOI] [PubMed] [Google Scholar]
- 11.Beck JM, et al. Probabilistic population codes for Bayesian decision making. Neuron. 2008;60(6):1142–1152. doi: 10.1016/j.neuron.2008.09.021. [DOI] [PMC free article] [PubMed] [Google Scholar]
- 12.Rabbitt P, Vyas S. Processing A Display Even After You Make A Response To It. How Perceptual Errors Can Be Corrected. Q. J. Exp. Psychol. 1981;33A:223–239. [Google Scholar]
- 13.Rabbitt PM. Error correction time without external error signals. Nature. 1966;212(5060):438. doi: 10.1038/212438a0. [DOI] [PubMed] [Google Scholar]
- 14.Smith PL, Ratcliff R. Psychology and neurobiology of simple decisions. Trends Neurosci. 2004;27(3):161–168. doi: 10.1016/j.tins.2004.01.006. [DOI] [PubMed] [Google Scholar]
- 15.Roitman JD, Shadlen MN. Response of neurons in the lateral intraparietal area during a combined visual discrimination reaction time task. J. Neurosci. 2002;22(21):9475–9489. doi: 10.1523/JNEUROSCI.22-21-09475.2002. [DOI] [PMC free article] [PubMed] [Google Scholar]
- 16.Kiani R, Hanks TD, Shadlen MN. Bounded integration in parietal cortex underlies decisions even when viewing duration is dictated by the environment. J. Neurosci. 2008;28(12):3017–3029. doi: 10.1523/JNEUROSCI.4761-07.2008. [DOI] [PMC free article] [PubMed] [Google Scholar]
- 17.Adelson EH, Bergen JR. Spatiotemporal Energy Models for the Perception of Motion. Journal of the Optical Society of America A. 1985;2(2):284–299. doi: 10.1364/josaa.2.000284. [DOI] [PubMed] [Google Scholar]
- 18.Romo R, Hernandez A, Zainos A, Lemus L, Brody CD. Neuronal correlates of decision-making in secondary somatosensory cortex. Nat. Neurosci. 2002;5(11):1217–1225. doi: 10.1038/nn950. [DOI] [PubMed] [Google Scholar]
- 19.Todorov E. Optimality principles in sensorimotor control. Nat. Neurosci. 2004;7(9):907–915. doi: 10.1038/nn1309. [DOI] [PMC free article] [PubMed] [Google Scholar]
- 20.Parker AJ, Newsome WT. Sense and the single neuron: probing the physiology of perception. Ann. Rev. Neurosci. 1998;21:227–277. doi: 10.1146/annurev.neuro.21.1.227. [DOI] [PubMed] [Google Scholar]
- 21.Uchida N, Kepecs A, Mainen ZF. Seeing at a glance, smelling in a whiff: rapid forms of perceptual decision making. Nat. Rev. Neurosci. 2006;7(6):485–491. doi: 10.1038/nrn1933. [DOI] [PubMed] [Google Scholar]
- 22.Daw ND, O’Doherty JP, Dayan P, Seymour B, Dolan RJ. Cortical substrates for exploratory decisions in humans. Nature. 2006;441(7095):876–879. doi: 10.1038/nature04766. [DOI] [PMC free article] [PubMed] [Google Scholar]
- 23.Deaner RO, Khera AV, Platt ML. Monkeys pay per view: adaptive valuation of social images by rhesus macaques. Curr. Biol. 2005;15(6):543–548. doi: 10.1016/j.cub.2005.01.044. [DOI] [PubMed] [Google Scholar]
- 24.Yang T, Shadlen MN. Probabilistic reasoning by neurons. Nature. 2007;447(7148):1075–1080. doi: 10.1038/nature05852. [DOI] [PubMed] [Google Scholar]
- 25.Usher M, McClelland JL. The time course of perceptual choice: the leaky, competing accumulator model. Psychol. Rev. 2001;108(3):550–592. doi: 10.1037/0033-295x.108.3.550. [DOI] [PubMed] [Google Scholar]
- 26.Wong KF, Wang XJ. A recurrent network mechanism of time integration in perceptual decisions. J. Neurosci. 2006;26(4):1314–1328. doi: 10.1523/JNEUROSCI.3733-05.2006. [DOI] [PMC free article] [PubMed] [Google Scholar]
- 27.Gold JI, Shadlen MN. Banburismus and the brain: decoding the relationship between sensory stimuli, decisions, and reward. Neuron. 2002;36(2):299–308. doi: 10.1016/s0896-6273(02)00971-6. [DOI] [PubMed] [Google Scholar]
- 28.Bogacz R, Brown E, Moehlis J, Holmes P, Cohen JD. The physics of optimal decision making: a formal analysis of models of performance in two-alternative forced-choice tasks. Psychol. Rev. 2006;113(4):700–765. doi: 10.1037/0033-295X.113.4.700. [DOI] [PubMed] [Google Scholar]
- 29.Stuphorn V, Taylor TL, Schall JD. Performance monitoring by the supplementary eye field. Nature. 2000;408(6814):857–860. doi: 10.1038/35048576. [DOI] [PubMed] [Google Scholar]
- 30.Ghez C, Hening W, Favilla M. Gradual specification of response amplitude in human tracking performance. Brain Behav. Evol . 1989;33(2-3):69–74. doi: 10.1159/000115902. [DOI] [PubMed] [Google Scholar]
Associated Data
This section collects any data citations, data availability statements, or supplementary materials included in this article.
Supplementary Materials
Supplementary Information is linked to the online version of the paper at www.nature.com/nature.