Abstract
Despite their importance in gene innovation and phenotypic variation, duplicated regions have remained largely intractable due to difficulties in accurately resolving their structure, copy number and sequence content. We present an algorithm (mrFAST) to comprehensively map next-generation sequence reads allowing for the prediction of absolute copy-number variation of duplicated segments and genes. We examine three human genomes and experimentally validate genome-wide copy-number differences. We estimate that 73–87 genes will be on average copy-number variable between two human genomes and find that these genic differences overwhelmingly correspond to segmental duplications (OR=135; p<2.2e-16). Our method can distinguish between different copies of highly identical genes, providing a more accurate census of gene content and insight into functional constraint without the limitations of array-based technology.
INTRODUCTION
The human genome is enriched for gene-rich segmental duplications that vary extensively in copy number 1-4. Variation in the content and copy of these duplicated genes has been associated with recurrent genomic rearrangements as well as a variety of diseases, including color blindness, psoriasis, HIV susceptibility, Crohn's disease, and lupus glomerulonephritis 5-10. Despite recent technological advances in copy-number detection, a global assessment of genetic variation of these regions has remained elusive. Commercial SNP microarrays frequently bias against probe selection within these regions 11-13. Array comparative genomic hybridization (arrayCGH) approaches have limited power to discern copy-number differences especially as the underlying number of duplicated genes increases and the differential in copy with respect to a reference genome becomes vanishingly small 3,14,15. Even sequence-based strategies such as paired-end mapping 16,17 frequently fail to unambiguously assign end-sequences in duplicated regions, making it impossible to distinguish allelic and paralogous variation. Consequently duplicated regions have been largely refractory to standard human genetic analyses.
One promising approach for assessing copy-number variation has involved measuring the depth-of-coverage of whole-genome shotgun (WGS) sequencing reads aligned to the human reference genome 1. Recent applications of this approach to next-generation sequencing technology 18-22 have provided high-resolution mapping of copy-number alterations. Most of these approaches, however, assay only the “unique” regions of the genome 21,23,24. For example, MAQ reports only unique alignments and arbitrarily selects one position in the case of tied map positions, reporting no sequence variation 23. Although it is possible to run MAQ with an option to return all possible map locations of the sequence reads, it reports only the anchoring position and no sequence variation information is returned. Here, we develop a read-mapping algorithm to rapidly assay copy-number variation and experimentally verify its ability to accurately predict copy number in some of the most complex and duplicated regions of three human genomes.
RESULTS
Algorithm development
We developed mrFAST (micro-read fast alignment search tool) to effectively map large amounts of short sequence reads to the human genome reference assembly, to calculate accurate read-depth and to return all possible single nucleotide differences within both unique and duplicated portions of the genome (Supplementary Figures 1 and 2a). We have shown previously that the ability to place reads to all possible locations in the reference genome is a key requirement to accurately predicting the absolute copy number of duplicated sequences 1.
mrFAST is designed for short (>25 bp) sequence reads, employs a seed-and-extend method similar to BLAST 25, and implements a hash table to create indices (n=300 indices of 10 Mbp each) of the reference genome that can efficiently utilize the main memory of the system. The overall scheme of the mrFAST algorithm is illustrated in Supplementary Figure 1. For each read, the first, middle, and last k-mers are interrogated in the hash table to place initial seeds where k is the ungapped seed length (we set k=12 by default). A rapid version of edit distance 26 computation as described by Ukkonen 27 is then performed to extend the seed to discover all possible map locations, allowing 1-2 bp indels. We optionally exclude most of the “non-extendable” seeds, bypassing the high cost of edit distance computation. For this analysis, we selected an edit-distance threshold of two mismatches or indels to account for allelic variants and sequencing error. Moreover, querying three distinct k-mers guarantees discovery of all possible locations of reads within an edit distance of two if the length is >=35 and k=12. As a benchmark, mapping of one human genome (21-fold) against the repeat masked reference genome was achieved in 13.5 hours using a 100-CPU cluster.
Personal duplication maps
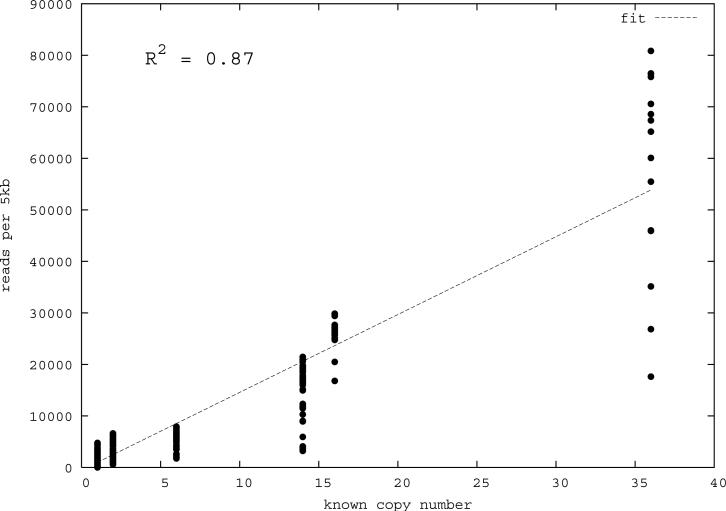
We tested the utility of mrFAST to accurately construct duplication maps by obtaining whole-genome shotgun sequence data from three human males from the NCBI short-read archive (http://www.ncbi.nlm.nih.gov/Traces/sra/sra.cgi) and European Read Archive (ftp://ftp.era.ebi.ac.uk/). These included the genome sequence data of an individual of European descent (JDW) generated using 454 FLX sequence data 20 as well as two genomes generated with Illumina WGS data (a Yoruba African (NA18507) and a Han Chinese individual (YH) 18,22 (Table 1)). All loci were first masked for high copy common repeat elements (retroposons and short high copy repeats) using RepeatMasker 28, Tandem Repeats Finder29, and WindowMasker 30. We initially assessed the dynamic range response of shotgun sequence data mapped by mrFAST by determining the read-depth for a set of 32 duplicated and unique loci where copy-number status had been previously confirmed using experimental methods 1. Using these benchmark loci, we determined the average read-depth and variance for 5-kbp (unmasked) regions for autosomal and X chromosomal loci (Table 1). For each of the three libraries we found that read-depth strongly correlated with the known copy number (R2=0.83-0.90, Figure 1a). Due to the known sequencing biases of high throughput sequencing technologies in GC-rich and GC-poor regions 31, we also applied a statistical correction to normalize the read-depth based on the GC content of each window (see Methods and Supplementary Note).
Table 1. Summary statistics of the WGS libraries studied.
We inspected three different WGS libraries from three individuals. Approximately 74 million 454-based reads from the JDW genome were rendered into 36-bp reads (see Supplementary Note). In total, we processed 4.9 billion reads (206 gigabases), and approximately 1.4 billion reads (~28.5%) were mapped to repeat masked human genome build35, with different levels of repeat masking (see text and Supplementary Note).
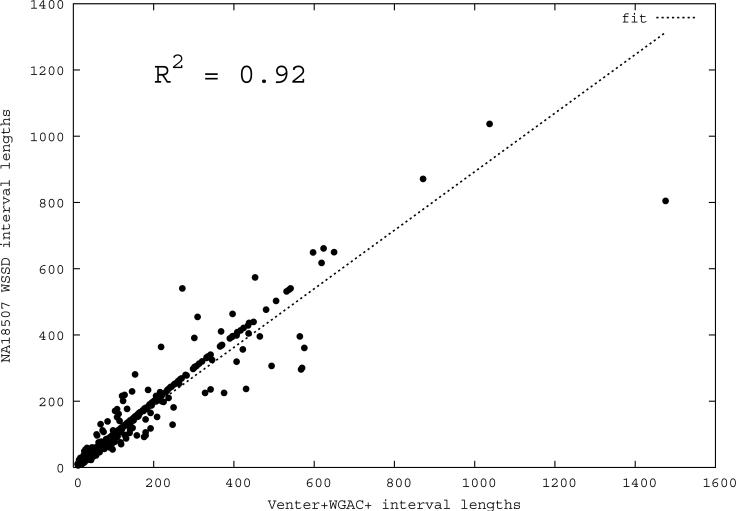
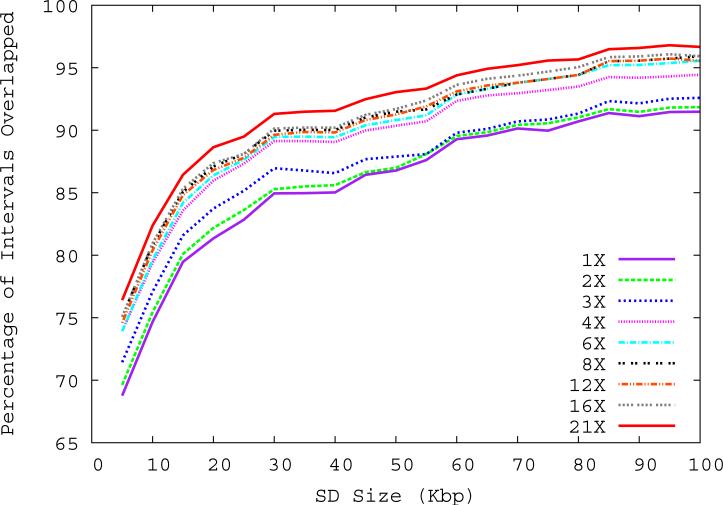
Figure 1. Correlation of predicted and known segmental duplications (NA18507).
a) mrFAST sequence read-depth per 5-kbp window along the human genome correlates well (R2=0.87) with the known copy number of duplicated sequences. b) Predicted duplication interval length versus the assembly-based length intervals of known duplications (Whole Genome Assembly Comparison; WGAC, ≥94% sequence identity) 34 shows that boundaries of duplications can be accurately predicted. A few intervals show discrepancy in boundary prediction, however, this is largely due to deletion polymorphism in the NA18507 genome within duplications (supported by arrayCGH). c) A cumulative plot of the fraction of duplication intervals detected as a function of various read-depth sequence coverage. The segmental duplication (SD) size is given in cumulative intervals (≥5 kbp, ≥10 kbp, etc.) and represents the set of intervals identified both within the public reference assembly (build35) and the Celera whole-genome shotgun sequence reads. As expected, the sensitivity of our method increases with more genome coverage; the most dramatic difference in detection is observed between 3- to 4-fold coverage.
We next assessed the ability of mrFAST read-depth to accurately predict the boundaries of known duplicated sequences. We selected a set of 961 autosomal duplication intervals (745 intervals ≥20 kbp) that were predicted both by the analysis of the human genome assembly 32 and by an independent assessment of Celera capillary WGS sequences 1,33 where the 20-kbp threshold was applied. We reasoned that duplications detected by both methods likely represented a set of true positive duplications whose boundaries would remain largely invariant in additional human genomes. We mapped each of the three WGS sequence libraries (JDW, NA18507 and YH) to the human reference genome (build35) using mrFAST and identified all intervals where at least 6 out of 7 consecutive windows showed an excess depth-of-coverage (number of reads ≥ average + 3 standard deviations). A threshold of 3 standard deviations corresponds to a diploid copy number of approximately 3.5, which means that a fraction of sequences with a hemizygous duplication may be missed by this approach. We compared the predicted sizes of intervals in each genome with the duplications predicted from the assembly34 and determined that the boundaries of known duplications could be accurately predicted (R2=0.92, Figure 1b). Since sequence coverage directly affects the power to detect duplications by read-depth, we computed the fraction of high-confidence duplication intervals that could be detected at various WGS sequence coverages (Figure 1c). Our results show that at 20-fold sequence coverage, >90% of segmental duplications larger than 20 kbp can be accurately predicted. Interestingly, the most significant increase in yield occurs between 3- to 4-fold sequence coverage suggesting that the majority of copy-number variable sequences in excess of 20 kbp in length will be accurately predicted from the 1000 Genomes Project (http://www.1000genomes.org) where at least 4-fold of WGS sequence data are available. We also performed benchmark analyses to compare the segmental duplication detection power of mrFAST with different edit distance parameters, as well as against some of the other available read mapping tools (Supplementary Note).
As an independent and more sensitive test within unique regions of the genome, we compared copy-number variant (CNV) genotype calls for NA18507, with calls recently assessed by McCarroll and colleagues using the Affymetrix 6.0 platform35. We found that 250/282 (88.7%) of CNVs >10 kbp and 120/128 (93.8%) of CNVs >20 kbp were consistent between the two platforms (see Supplementary Note). In two of the most extreme cases of discrepancy, we found that the Affymetrix 6.0 genotypes likely misassigned absolute copy numbers, possibly due to an incorrect assignment of the population average genotype based on fluorescent intensities. These results highlight the potential of mrFAST read-depth to provide precise estimates of copy number across all genomic regions.
We constructed duplication maps for each of the three genomes and estimated the absolute copy number of each duplication interval larger than 20 kbp in length. We considered a given segment to be duplicated within an individual if the median of estimated copy number for that individual was greater than 2.5 (diploid copy number; see Supplementary Note). We compared the extent of overlap among duplicated sequences (Figure 2, Methods) and reclassified duplicated sequences as shared or individual-specific based on the predicted copy numbers in the analysis of these three genomes (Supplementary Note). We defined a total of 725 non-overlapping duplication intervals across the three individuals that total 84.76 Mbp. Only 25 duplication intervals were not predicted in all three individuals suggesting that the vast majority (97% of the intervals and 98% by base pair) of large segmental duplications are shared (Figure 3 and Supplementary Figure 3).
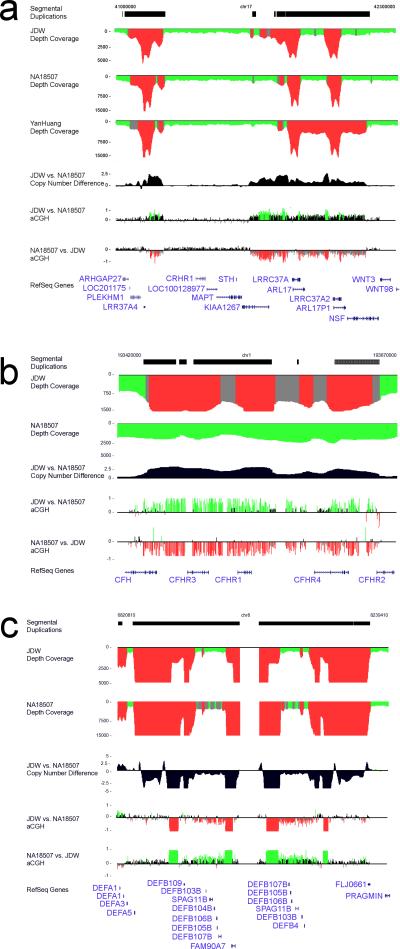
Figure 2. Computational prediction and arrayCGH validation of segmental duplication copy-number differences for three human genomes.
Regions of excess read-depth (average+3std) are shown in red in contrast to regions of intermediate read-depth (gray; average + 2std-3std) or normal read-depth (green, average +/− 2std).The absolute copy number and arrayCGH results for specific individual genome comparisons are shown in the context of RefSeq annotated genes. Oligonucleotide relative log2 ratios are depicted as red/green histograms and correspond to an increase and decrease in signal intensity when test/reference is reverse labeled. a) A known copy-number polymorphism on 17q21.31 that is associated with the H2 haplotype among Europeans (build35 coordinates chr17: 41,000,000–42,300,000). The JDW genome shows an increase of 1-2 copies of a 459-kbp segmental duplication mapping to 17q21.31 when compared to NA18507. b) An expansion of the complement factor H related gene family (chr1:193,350,000–193,700,000) within JDW. c) An increase in NA18507 copy number for the defensin gene cluster in 8p23.1 is confirmed by arrayCGH.
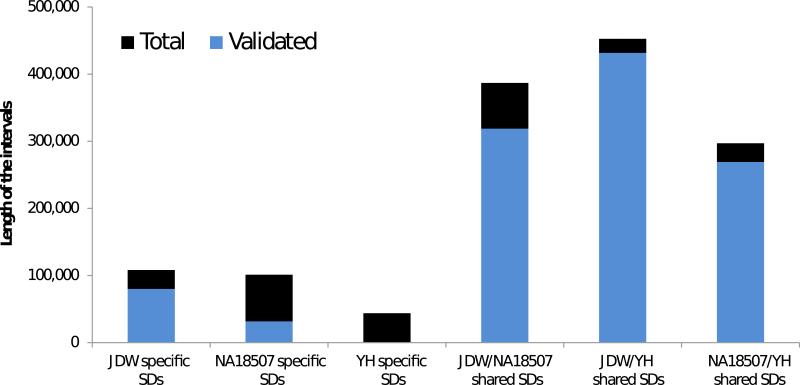
Figure 3. Validation of individual-specific segmental duplications.
The number of duplicated base pairs predicted and validated in NA18507, JDW, and YH (autosomes only) are shown. The height of the bars represents the sum of computationally predicted interval lengths, and the blue color bars correspond to the experimentally validated portion. Only duplicated intervals >20 kbp were considered for validation.
Experimental validation
We designed two targeted oligonucleotide microarrays to validate predicted differences in copy number by arrayCGH. Using DNA from each of the sequenced genomes, we performed three pairwise arrayCGH experiments. We validated 68% (17/25) of duplication intervals not shared in all three individuals, which implied that only 1.1 Mbp of duplicated regions would be unique to at least to one of them (Figure 3, Supplementary Note). Interestingly, ~80% of these validated “individual-specific” duplications mapped within 2 kbp of shared human duplications suggesting that sequences adjacent to ancestral duplication blocks have the highest probability of segmental duplication. We also performed a reciprocal analysis of intervals (>20 kbp) predicted to be deleted in one or more of the individuals and confirmed 28 deletions (or 1.4 Mbp of deletion) (Supplementary Note).
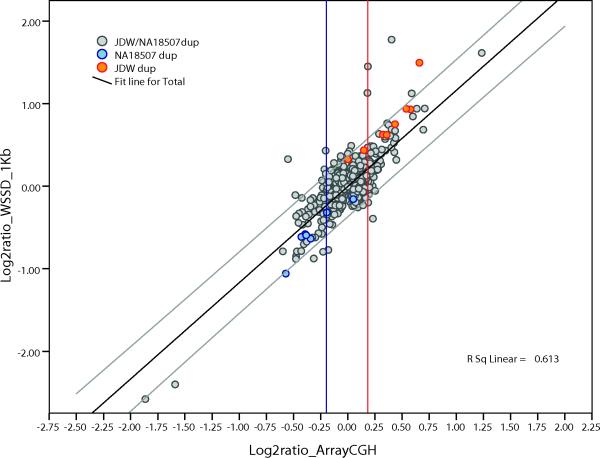
Irrespective of the next-generation sequence (NGS) platform, the pattern of read-depth was remarkably reproducible for 48% of the shared duplications (44711/94070 Supplementary Figure 4). However among the remaining 52% of duplications, read-depth did not correlate between individuals. This suggests that shared duplications show the greatest extremes of copy-number variation between individuals (Supplementary Figure 5). Using absolute estimates of copy number, we calculated an in silico log2 ratio for each of the three genome-wide comparisons and compared it to the experimental values as determined by arrayCGH (Figure 4, Supplementary Figure 6). Overall, we found a positive correlation with copy-number predictions (R2=~0.52–0.63 depending on the pairwise comparison). We note that the ability of arrayCGH to discriminate absolute differences diminishes as the duplication copy number increases 14.
Figure 4. Correlation between computational and experimental copy number for NA18507 vs. JDW.
We computed the copy number for each shared (gray) and individual specific duplication interval (blue or orange) based on the depth-of-coverage of aligned WGS against the human reference assembly (build35). Based on this computational estimates of copy number, we calculated a predicted log2 copy-number ratio for each autosomal duplication interval >20 kbp in length (and with less than 80% of total common repeat content). These values were plotted against the experimental log2 ratios determined by oligonucleotide arrayCGH. The vertical red lines indicate the threshold used for the validated calls (see Supplementary Note).
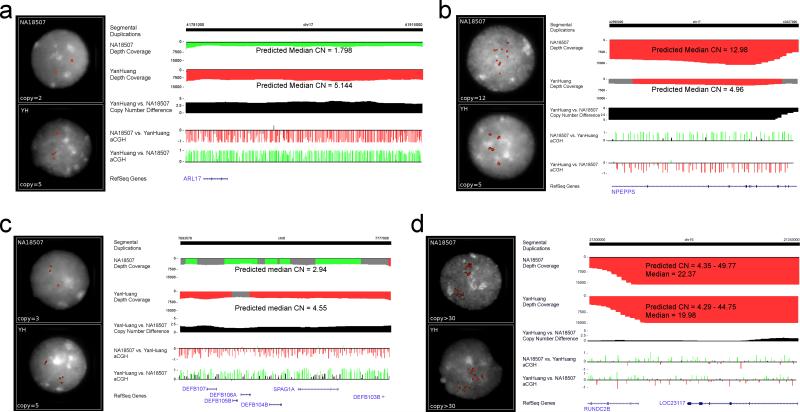
We selected eleven duplicated loci that showed copy-number differences between the YH and NA18507 genomes and performed fluorescence in situ hybridization (FISH) analysis on interphase nuclei (Figure 5, Supplementary Note) from immortalized cell lines from YH and NA18507. These results show remarkable consistency between the absolute copy number predicted by mrFAST and FISH. For cases where the copy number is higher than 15, FISH was unable to provide a precise estimate of copy-number difference due to the technical limitations of this procedure (Figure 5d, Supplementary Note). With one exception, interphase FISH analysis showed that differences in copy number involved local changes in copy number suggesting that duplicative transpositions to new locations were exceedingly rare.
Figure 5. FISH validation.
a) Sequence read-depth predicts 5 copies of this particular 17q21.31 segment in the YH genome and 2 copies (unique) in NA18507. ArrayCGH shows an increase in the YH genome and interphase nuclei FISH confirms the absolute copy-number difference between the two genomes. b) Similarly, interphase FISH confirms copy-number difference of 5 vs. 12 copies for the NPEPPS gene. c) YH is predicted and validated to have two more copies of the defensin gene family cluster of 8p23.1. d) Due to the known mosaic architecture 38 for this high copy locus (>30 copies), both arrayCGH and FISH methods fail to accurately estimate copy-number difference between NA18507 and YH genomes: despite the fact that sequence depth predicts ~2 more copies in NA18507.
Copy-number polymorphic genes
This analysis validated 68 gene families as being completely or partially copy-number variable among these three individual genomes (Supplementary Table 1). This includes a complete duplication of the complement factor H-related complex (consisting of four genes, CFHR1 through CFHR4) within the JDW genome (Figure 2b). We also confirm one additional copy of the 8p23.1 defensin gene family (DEFB103B) within the YH genome when compared to NA18057 and in NA18507 when compared to JDW. We predict about twice as many copies of the amylase (AMY1) gene family in NA18507 (n=9) and YH (n=10) when compared to JDW (n=5). As expected 7, the African genome (NA18507) showed the greatest number of CCL3L1 copies (n=7) when compared to either JDW (n=3) or YH (n=5). We also validate increases in gene segments of functional relevance. For example, we find ten fewer copies of the kringle IV domain of the lipoprotein A gene (LPA) in NA18507 (22 copies vs. 35 in JDW and 26 in YH)—a polymorphism known to be protective against coronary heart disease 36.
While many of these differences are consistent with previous studies, the analysis also confirmed differences in rapidly evolving human and great ape gene families that have been previously difficult to ascertain. For example, our results suggest an increase in copy of the TBC1D3 gene family within NA18507 (29 copies) when compared to the other two genomes (JDW=26, YH=17). Similarly, we predicted absolute differences in the morpheus/NPIP copy number between different humans. Unlike FISH or arrayCGH, sequencing data provides exquisite specificity for assessing the presence or absence of individual paralogous genes. We examined three gene families (morpheus, opsin and CFHR) in more detail by identifying single nucleotide variants that distinguish the different paralogs. Despite the high degree of sequence identity among the duplicated genes, we found approximately 300 distinct paralogous sequence variants per duplicated gene (1 variant/91 bp) (Supplementary Table 2). We determined which specific duplicate genes were present in each individual, providing for the first time an accurate census of specific genes (as opposed to copy-number differences in the aggregate) (Supplementary Figure 7). Since we track all single nucleotide differences using mrFAST, we can also assess the relative proportion of disruptive stop codons providing a first-pass approximation of the functional constraint on each polymorphic gene family (Supplementary Table 3). These data suggest that the systematic identification of unique paralogous sequence variants for all duplicated gene families combined with next-generation sequence data will be a powerful approach to genotype these complex regions of the genome. Longer sequence reads, however, will be necessary to accurately assess phase.
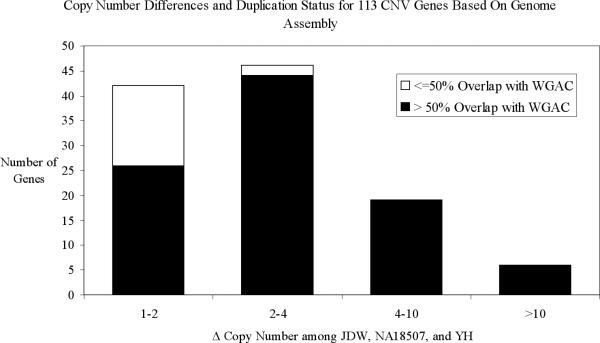
Our experimental analysis found that 97% (66/68) of the validated genic copy-number differences among the three genomes corresponded to regions annotated as segmental duplications (providing strong evidence that functional copy-number polymorphisms will be similarly biased in their genomic distribution). Since we considered only the largest (>20 kbp) regions in our initial analysis, we repeated the copy-number estimate on a gene-by-gene basis removing the length threshold. We analyzed 17,610 non-redundant RefSeq transcripts 37 (Supplementary Note) and calculated the absolute copy number for each sample based on the median depth-of-coverage for each of the corresponding gene segments in the genome (Supplementary Note). Based on this computational analysis, we predict that 3.8% of genes (662/17601) show a difference of at least one copy (Supplementary Tables 4, 5), with an average of 394 predicted gene copy-number differences between two individuals (see Table 2 for the 30 validated genes with the largest copy-number differences). In order to validate these predicted gene differences, many of which are smaller than 20 kbp, we interrogated the three samples using a customized oligonucleotide microarray targeted toward these gene regions. We conservatively validate 113 genes (Supplementary Table 6) as being variable in copy number among these three individuals (73-87 genes between two human genomes). Although there are almost certainly real copy number differences that were not validated by array-CGH (see Supplementary Note), we note that 84% (95/113) of the validated changes map to segmental duplications. Thus, genes that are duplicated (having a 50% overlap with annotated duplications of at least 90% identity) are significantly more likely to show copy-number difference (OR=135; p< 2.2e-16 Fisher's Exact Test). Moreover, these variably duplicated genes show a greater copy-number range than the non-duplicated CNV genes (median copy-number difference of 2.8 vs. median copy-number difference of 1.2). Notably, 97% (69/71) of the genes with a copy-number difference of two or greater map to previously reported segmental duplications 1,32,34 (Figure 6).
Table 2. Most variable copy number genes among 3 human genomes.
Based on the estimated and validated copy numbers of genes in the RefSeq database, we calculated the maximum copy-number difference between each pair of the three genomes analyzed. The top 30 validated genes with the maximum copy-number range are shown.
| Gene Name | Transcript ID | Gene Size | Duplicated Bp | JDW Copy Number | NA18507 Copy Number | YH Copy Number | Copy Number Range |
|---|---|---|---|---|---|---|---|
| DUX4 | NM_033178 | 8205 | 8205 | 248 | 97 | 196 | 151 |
| DUB3 | NM_201402 | 1593 | 1593 | 139 | 186 | 122 | 64 |
| FAM90A7 | NM_001136572 | 18865 | 18865 | 7 | 44 | 36 | 38 |
| PRR20 | NM_198441 | 3022 | 3022 | 28 | 22 | 11 | 17 |
| HRNR | NM_001009931 | 12112 | 7721 | 19 | 8 | 15 | 12 |
| TBC1D3 | NM_032258 | 10897 | 10897 | 26 | 29 | 17 | 11 |
| TP53TG3 | NM_016212 | 3200 | 3200 | 16 | 7 | 6 | 10 |
| WASH1 | NM_182905 | 15229 | 15229 | 26 | 16 | 20 | 10 |
| ZNF717 | NM_001128223 | 48227 | 24791 | 36 | 27 | 32 | 9 |
| OR4F17 | NM_001005240 | 918 | 918 | 18 | 13 | 9 | 9 |
| C2orf78 | NM_001080474 | 32959 | 26245 | 9 | 7 | 14 | 7 |
| PCDHB8 | NM_019120 | 2590 | 2508 | 12 | 6 | 8 | 6 |
| TCEB3C | NM_145653 | 1877 | 1877 | 23 | 18 | 17 | 6 |
| PCDHB7 | NM_018940 | 3714 | 2333 | 10 | 4 | 7 | 6 |
| OR4F16 | NM_001005277 | 937 | 937 | 18 | 17 | 12 | 6 |
| FOXD4L5 | NM_001126334 | 3109 | 3108 | 40 | 43 | 38 | 6 |
| FOXD4L4 | NM_199244 | 3107 | 3106 | 40 | 43 | 38 | 6 |
| MST1 | NM_020998 | 4816 | 4776 | 11 | 6 | 11 | 5 |
| MGC50273 | NM_214461 | 6701 | 6701 | 33 | 28 | 32 | 5 |
| AMY1A | NM_004038 | 8871 | 8871 | 6 | 11 | 10 | 5 |
| AMY2A | NM_000699 | 8395 | 8395 | 6 | 10 | 11 | 5 |
| POTEB | NM_207355 | 31415 | 31415 | 17 | 21 | 22 | 5 |
| NPEPPS | NM_006310 | 92199 | 62993 | 4 | 8 | 3 | 5 |
| NBPF1 | NM_017940 | 49571 | 49533 | 43 | 48 | 46 | 5 |
| OR2A1 | NM_001005287 | 931 | 931 | 6 | 5 | 9 | 4 |
| FAM86B2 | NM_001137610 | 10727 | 10727 | 20 | 17 | 21 | 4 |
| GOLGA6 | NM_001038640 | 12694 | 12694 | 17 | 13 | 17 | 4 |
| LOC283767 | NM_001001413 | 9757 | 9757 | 26 | 22 | 26 | 4 |
| FLG | NM_002016 | 23029 | 10606 | 13 | 9 | 13 | 4 |
| BAGE | NM_001187 | 41142 | 40371 | 18 | 17 | 14 | 4 |
Duplicated bp corresponds to the number of base pairs of the gene that intersects with segmental duplications. This value is equal to the gene size for genes that are completely in segmental duplications, and smaller if the gene partially overlaps with known duplications.
Figure 6. Copy-number differences between unique and duplicated regions.
The 113 genes that vary in copy number are partitioned based on the range of copy-number difference and their intersection with annotated segmental duplications. Duplicated genes show a greater extent of copy-number variation when compared to genes mapping to unique regions of the genome.
DISCUSSION
Next-generation sequencing platforms are fundamentally altering the way genetics and genomics research is performed. Compared to other methods, these platforms offer the ability to obtain an unprecedented amount of sequence information in a low-cost, high-throughput fashion. The main draw back of existing technologies is the comparably short sequence read-lengths they produce. As a result, some regions of the human genome—particularly duplication or repeat-rich regions—have already begun to be excluded as part of standard NGS analyses. We specifically designed our new mapping algorithm, mrFAST, to address this limitation. By considering all possible map locations for a read in an efficient manner, we have been able to apply the high potential of NGS to some of the most structurally complex and dynamic regions of the human genome. By including these regions, we provide one of the first comprehensive estimates of absolute copy-number differences among three human genomes.
There are three major conclusions from our computational and experimental analyses. First, we show that NGS read-depth can be used to accurately predict absolute copy number, such that even multi-copy differences (5 vs. 12; see Figure 5) can be reliably predicted between different individuals. Second, our results suggest that the duplication status of the largest segmental duplications (>20 kbp in length) is largely invariant with only 3% of the duplications being specific to an individual. Third, our analysis reveals that the most extreme copy-number variation corresponds to genes embedded within segmental duplications and that most of these differences involve tandem changes in copy as opposed to duplications to new locations. We validated 113 complete genes as copy-number variable among these three individuals. Several of the validated loci are of known biomedical relevance related to color blindness (e.g. opsin variation, Supplementary Figure 2d; psoriasis, Supplementary Note; and age-related macular degeneration, Figure 2b). It is also interesting that several of the most variable human copy-number genes (Table 2, Supplementary Figures 2b, 2f) correspond to rapidly evolving gene families that emerged within the common ancestor of human and African great apes (e.g. TBC1D, LRRC37, GOLGA, NBPF). These genes correspond to the core duplicons that have been implicated in the expansion of intrachromosomal segmental duplications during hominid evolution 38. While the function of these genes is largely unknown, the ability to use NGS to accurately predict their copy number provides the ability to make genotype and phenotype correlations in these complex areas of the genome.
Copy-number differences, including variable duplications of entire genes, are now recognized as making substantial contributions to variation in human phenotypes. The ability to accurately and systematically determine the absolute copy number for any genomic segment is an important first step toward a true and complete picture of individual genomes and phenotypes. In light of the sensitivity and specificity of read-depth approaches, we anticipate that this strategy will eventually replace arrayCGH based methods. The next challenge will be defining variation in the sequence content and structural organization of these dynamic and important regions of the human genome.
METHODS
Computational Analyses
Details regarding the mrFAST algorithm are described at length in the Supplementary Note. mrFAST can be downloaded from (http://mrfast.sourceforge.net) and is freely available to not-for-profit institutions. Segmental duplication maps were constructed from approximately 6X 454 sequence coverage of the JDW genome, 42X Illumina sequence coverage of NA18507 and 40X Illumina from YH. 454-based JDW WGS sequence reads (average length 266 bp) were broken into 36-bp sequences to make the read-length properties comparable among the three sequence libraries (see Supplementary Note). Sequence reads were mapped using mrFAST against the human genome reference build35 (Supplementary Note), to define duplication intervals and calculate absolute copy numbers. Read-depth was normalized with respect to their GC content via a LOESS-based smoothing technique (Supplementary Note). For cross-sample comparisons, the duplication status of each individual over each interval was reassessed based on the estimated absolute copy number (Supplementary Note).
arrayCGH Validation
We performed array comparative genomic hybridization (arrayCGH) to confirm individual-specific duplications and to confirm copy-number differences for shared duplications. A total of six experiments were performed in replicate with dye-reversals performed between test and reference: NA18507 vs. JDW, NA18507 vs. YH and JDW vs. YH. Log2 relative hybridization intensity was calculated for each probe. In this analysis, we restricted our analysis to those regions that were greater than 20 kbp in length and contained at least 20 probes. We used a heuristic approach to calculate log2 thresholds of significance for each comparison dynamically adjusting the thresholds for each hybridization to result in a false discovery rate of <1% in the control regions 39.
FISH Analysis
Metaphase spreads were obtained from lymphoblast cell lines from NA18507 (Coriell Cell Repository, Camden, NJ) and YH (Han Chinese) 18. FISH experiments were performed using fosmid clones 4 (Table 3) directly labeled by nick-translation with Cy3-dUTP (Perkin-Elmer) as described previously 40 with minor modifications (see Supplementary Note). Digital images were obtained using a Leica DMRXA2 epifluorescence microscope equipped with a cooled CCD camera (Princeton Instruments). DAPI and Cy3 fluorescence signals, detected with specific filters, were recorded separately as grayscale images. Pseudo coloring and merging of images were performed using Adobe Photoshop software. A minimum of 50 interphase cells were scored for each probe.
Supplementary Material
ACKNOWLEDGMENTS
We thank David Bentley for early access to the Illumina WGS set from NA18507, Jun Wang for the WGS set, DNA and the cell line generated from the YH genome, and Michael Egholm and Birgitte Simen for the JDW DNA. We also thank Martin Shumway, Paul Flicek, and Rasko Leinonen for technical help in downloading the large sequence sets; Eray Tüzün for help in parallelizing mrFAST for computation clusters through MPI; Santhosh Girirajan for assistance with experiments and Tonia Brown for her help in manuscript preparation. J.M.K. is supported by an NSF Graduate Research Fellowship. T.M.-B. is supported by a Marie Curie fellowship (FP7). This work was supported, in part, by NIH grant HG004120 to E.E.E. E.E.E. is an investigator of the Howard Hughes Medical Institute.
Footnotes
AUTHOR CONTRIBUTIONS
C.A., J.M.K., T.M.-B., and E.E.E. designed the study, performed analytical work and wrote the manuscript. C.A., F.H., and O.M. designed and implemented the mrFAST algorithm. C.A., J.M.K., G.A., and J.O.K. performed computational analysis. T.M.-B., F.A., C.B., and M.M. performed validation experiments. R.A.G. contributed to DNA sample. S.C.S. and E.E.E. obtained funding for the study.
REFERENCES
- 1.Bailey JA, et al. Recent segmental duplications in the human genome. Science. 2002;297:1003–7. doi: 10.1126/science.1072047. [DOI] [PubMed] [Google Scholar]
- 2.Iafrate AJ, et al. Detection of large-scale variation in the human genome. Nat Genet. 2004;36:949–951. doi: 10.1038/ng1416. [DOI] [PubMed] [Google Scholar]
- 3.Redon R, et al. Global variation in copy number in the human genome. Nature. 2006;444:444–54. doi: 10.1038/nature05329. [DOI] [PMC free article] [PubMed] [Google Scholar]
- 4.Kidd JM, et al. Mapping and sequencing of structural variation from eight human genomes. Nature. 2008;453:56–64. doi: 10.1038/nature06862. [DOI] [PMC free article] [PubMed] [Google Scholar]
- 5.Fanciulli M, et al. FCGR3B copy number variation is associated with susceptibility to systemic, but not organ-specific, autoimmunity. Nat Genet. 2007;39:721–3. doi: 10.1038/ng2046. [DOI] [PMC free article] [PubMed] [Google Scholar]
- 6.Aitman TJ, et al. Copy number polymorphism in Fcgr3 predisposes to glomerulonephritis in rats and humans. Nature. 2006;439:851–5. doi: 10.1038/nature04489. [DOI] [PubMed] [Google Scholar]
- 7.Gonzalez E, et al. The Influence of CCL3L1 Gene-Containing Segmental Duplications on HIV-1/AIDS Susceptibility. Science. 2005 doi: 10.1126/science.1101160. [DOI] [PubMed] [Google Scholar]
- 8.Fellermann K, et al. A chromosome 8 gene-cluster polymorphism with low human beta-defensin 2 gene copy number predisposes to Crohn disease of the colon. Am J Hum Genet. 2006;79:439–48. doi: 10.1086/505915. [DOI] [PMC free article] [PubMed] [Google Scholar]
- 9.Yang Y, et al. Gene copy-number variation and associated polymorphisms of complement component C4 in human systemic lupus erythematosus (SLE): low copy number is a risk factor for and high copy number is a protective factor against SLE susceptibility in European Americans. Am J Hum Genet. 2007;80:1037–54. doi: 10.1086/518257. [DOI] [PMC free article] [PubMed] [Google Scholar]
- 10.Hollox EJ, et al. Psoriasis is associated with increased beta-defensin genomic copy number. Nat Genet. 2008;40:23–5. doi: 10.1038/ng.2007.48. [DOI] [PMC free article] [PubMed] [Google Scholar]
- 11.Estivill X, et al. Chromosomal regions containing high-density and ambiguously mapped putative single nucleotide polymorphisms (SNPs) correlate with segmental duplications in the human genome. Hum Mol Genet. 2002;11:1987–95. doi: 10.1093/hmg/11.17.1987. [DOI] [PubMed] [Google Scholar]
- 12.Locke DP, et al. Linkage disequilibrium and heritability of copy-number polymorphisms within duplicated regions of the human genome. Am J Hum Genet. 2006;79:275–90. doi: 10.1086/505653. [DOI] [PMC free article] [PubMed] [Google Scholar]
- 13.Cooper GM, Zerr T, Kidd JM, Eichler EE, Nickerson DA. Systematic assessment of copy number variant detection via genome-wide SNP genotyping. Nat Genet. 2008;40:1199–203. doi: 10.1038/ng.236. [DOI] [PMC free article] [PubMed] [Google Scholar]
- 14.Locke DP, et al. Large-scale variation among human and great ape genomes determined by array comparative genomic hybridization. Genome Res. 2003;13:347–57. doi: 10.1101/gr.1003303. [DOI] [PMC free article] [PubMed] [Google Scholar]
- 15.Sharp AJ, et al. Segmental duplications and copy-number variation in the human genome. Am J Hum Genet. 2005;77:78–88. doi: 10.1086/431652. [DOI] [PMC free article] [PubMed] [Google Scholar]
- 16.Tuzun E, et al. Fine-scale structural variation of the human genome. Nat Genet. 2005;37:727–32. doi: 10.1038/ng1562. [DOI] [PubMed] [Google Scholar]
- 17.Korbel JO, et al. Paired-end mapping reveals extensive structural variation in the human genome. Science. 2007;318:420–6. doi: 10.1126/science.1149504. [DOI] [PMC free article] [PubMed] [Google Scholar]
- 18.Wang J, et al. The diploid genome sequence of an Asian individual. Nature. 2008;456:60–5. doi: 10.1038/nature07484. [DOI] [PMC free article] [PubMed] [Google Scholar]
- 19.Campbell PJ, et al. Identification of somatically acquired rearrangements in cancer using genome-wide massively parallel paired-end sequencing. Nat Genet. 2008 doi: 10.1038/ng.128. [DOI] [PMC free article] [PubMed] [Google Scholar]
- 20.Wheeler DA, et al. The complete genome of an individual by massively parallel DNA sequencing. Nature. 2008;452:872–6. doi: 10.1038/nature06884. [DOI] [PubMed] [Google Scholar]
- 21.Chiang DY, et al. High-resolution mapping of copy-number alterations with massively parallel sequencing. Nat Methods. 2009;6:99–103. doi: 10.1038/nmeth.1276. [DOI] [PMC free article] [PubMed] [Google Scholar]
- 22.Bentley DR, et al. Accurate whole human genome sequencing using reversible terminator chemistry. Nature. 2008;456:53–9. doi: 10.1038/nature07517. [DOI] [PMC free article] [PubMed] [Google Scholar]
- 23.Li H, Ruan J, Durbin R. Mapping short DNA sequencing reads and calling variants using mapping quality scores. Genome Res. 2008;18:1851–8. doi: 10.1101/gr.078212.108. [DOI] [PMC free article] [PubMed] [Google Scholar]
- 24.Hillier LW, et al. Whole-genome sequencing and variant discovery in C. elegans. Nat Methods. 2008;5:183–8. doi: 10.1038/nmeth.1179. [DOI] [PubMed] [Google Scholar]
- 25.Altschul SF, Gish W, Miller W, Myers EW, Lipman DJ. Basic local alignment search tool. J. Molec. Biol. 1990;215:403–410. doi: 10.1016/S0022-2836(05)80360-2. [DOI] [PubMed] [Google Scholar]
- 26.Levenshtein VI. Binary codes capable of correcting deletions, insertions and reversals. Soviet Physics Doklady. 1966;10:707–710. [Google Scholar]
- 27.Ukkonen E. International FCT-Conference on Fundamentals of Computation Theory. Springer-Verlag; London, UK: 1983. On approximate string matching. pp. 487–495. [Google Scholar]
- 28.Smit AFA, Hubley R, Green P. RepeatMasker Open-3.0. 1996-2004.
- 29.Benson G. Tandem repeats finder: a program to analyze DNA sequences. Nucleic Acids Res. 1999;27:573–80. doi: 10.1093/nar/27.2.573. [DOI] [PMC free article] [PubMed] [Google Scholar]
- 30.Morgulis A, Gertz EM, Schaffer AA, Agarwala R. WindowMasker: window-based masker for sequenced genomes. Bioinformatics. 2006;22:134–41. doi: 10.1093/bioinformatics/bti774. [DOI] [PubMed] [Google Scholar]
- 31.Smith DR, et al. Rapid whole-genome mutational profiling using next-generation sequencing technologies. Genome Res. 2008;18:1638–42. doi: 10.1101/gr.077776.108. [DOI] [PMC free article] [PubMed] [Google Scholar]
- 32.She X, et al. Shotgun sequence assembly and recent segmental duplications within the human genome. Nature. 2004;431:927–30. doi: 10.1038/nature03062. [DOI] [PubMed] [Google Scholar]
- 33.Istrail S, et al. Whole-genome shotgun assembly and comparison of human genome assemblies. Proc Natl Acad Sci U S A. 2004;101:1916–21. doi: 10.1073/pnas.0307971100. [DOI] [PMC free article] [PubMed] [Google Scholar]
- 34.Bailey JA, Yavor AM, Massa HF, Trask BJ, Eichler EE. Segmental duplications: organization and impact within the current human genome project assembly. Genome Res. 2001;11:1005–17. doi: 10.1101/gr.187101. [DOI] [PMC free article] [PubMed] [Google Scholar]
- 35.McCarroll SA, et al. Integrated detection and population-genetic analysis of SNPs and copy number variation. Nat Genet. 2008;40:1166–74. doi: 10.1038/ng.238. [DOI] [PubMed] [Google Scholar]
- 36.Lackner C, Cohen JC, Hobbs HH. Molecular definition of the extreme size polymorphism in apolipoprotein(a). Hum Mol Genet. 1993;2:933–40. doi: 10.1093/hmg/2.7.933. [DOI] [PubMed] [Google Scholar]
- 37.Pruitt KD, Tatusova T, Maglott DR. NCBI reference sequences (RefSeq): a curated non-redundant sequence database of genomes, transcripts and proteins. Nucleic Acids Res. 2007;35:D61–5. doi: 10.1093/nar/gkl842. [DOI] [PMC free article] [PubMed] [Google Scholar]
- 38.Jiang Z, et al. Ancestral reconstruction of segmental duplications reveals punctuated cores of human genome evolution. Nat Genet. 2007;39:1361–8. doi: 10.1038/ng.2007.9. [DOI] [PubMed] [Google Scholar]
- 39.Marques-Bonet T, et al. A burst of segmental duplications in the genome of the African great ape ancestor. Nature. 2009;457:877–81. doi: 10.1038/nature07744. [DOI] [PMC free article] [PubMed] [Google Scholar]
- 40.Lichter P, et al. High-resolution mapping of human chromosome 11 by in situ hybridization with cosmid clones. Science. 1990;247:64–9. doi: 10.1126/science.2294592. [DOI] [PubMed] [Google Scholar]
Associated Data
This section collects any data citations, data availability statements, or supplementary materials included in this article.


