

Abstract
Purpose
To assess the feasibility of characterizing gene copy number alteration by fluorescence in situ hybridization of circulating tumor cells (CTC) isolated using the CellSearch system in patients with progressive castration resistant metastatic prostate cancer (CRPC).
Experimental Design
We used probe combinations that included the androgen receptor (AR) and MYC genes for FISH analysis of CTC samples collected from 77 men with metastatic CRPC.
Results
High-level chromosomal amplification of AR was detected in 37.5% of samples analyzed, and relative gain of MYC in 55.8%. No such abnormalities were detected in samples with CTC counts of less than 10, reflecting ascertainment difficulty in these lower count samples.
Conclusion
The CTC isolated from our patient cohort present a very similar molecular cytogenetic profile to that reported for late-stage tumors, and thus demonstrate that analysis of CTC can be a valuable, noninvasive surrogate for routine tumor profiling. Furthermore, we demonstrate that as many as 50% of these patients have substantial amplification of the AR locus, indicating that androgen signaling continues to play an important role in late-stage prostate cancer.
Keywords: circulating tumor cells, prostate cancer, tumor markers, FISH, androgen receptor
INTRODUCTION
The therapeutic options for men with progressive castration-resistant prostate cancer are limited. Management is complicated by the uncertainty of predicting the prognosis of individual patients based on clinical parameters alone. Because most advanced tumors are inherently unstable and heterogeneous, robust methods to correlate specific tumor characteristics to clinical outcomes are urgently needed. Functional analyses of tumor genomics and cell biology have led to a new generation of anti-tumor agents. However, because many are directed toward specific targets or pathways, tumors lacking these targets will not respond. To expedite the introduction of new therapies into clinical practice, biomarkers are needed to define prognosis more precisely, and to guide treatment selection based on the biologic profile of an individual patient’s tumor. This is particularly important with the clinical activity recently demonstrated with two agents targeting the androgen receptor signaling axis: abiraterone acetate, an irreversible inhibitor of CYP17A that blocks androgen synthesis,(1) and MDV3100, a potent AR antagonist selected for clinical development based on antitumor effects in preclinical prostate cancer models with overexpressed AR.(2)
The shedding of tumor cells into the circulation is a necessary condition for metastatic spread. Recently, the enumeration of circulating tumor cells (CTC) using the analytically valid CellSearch system has been cleared by the US Food and Drug Administration as a prognostic clinical biomarker that can be used to monitor the effectiveness of therapy in patients with metastatic breast, colorectal, and prostate cancer.(3-5) While changes in CTC counts over time are predictive of survival, it is the molecular profiling of these cells that offers insight into the biological status of the tumor in the context of individual patient management.
Effective molecular profiling of CTC is complicated by the relatively low cell numbers involved and by dilution from non-tumor material because the current enrichment procedures cannot eliminate all contaminating leukocytes. Further, as patients with advanced disease may shed tumor cells from multiple sites, the CTC detected may have diverse characteristics, further diluting potential molecular biomarkers and complicating their predictive utility. Fluorescence in situ hybridization (FISH) is a well-established and effective means of monitoring locus copy number in individual cells in a heterogeneous population,(6) that has been successfully applied to tumor cells isolated from blood.(7, 8) Molecular cytogenetic analysis of primary prostate tumors has consistently shown that the most common alterations are early loss of loci in 8p and later gain of 8q, and this observation has led to the development of a commercial FISH probe set for prostate tumors (Vysis ProVysion, Abbott Molecular Inc., Des Plaines, IL).(9-14) In addition, it is well recognized that amplification of the androgen receptor locus in Xq (AR) is seen in up to 30% of castration-resistant metastatic tumors. (10, 15-17)
A previous study showed that CTC numbers can be monitored in a routine clinical laboratory setting, and that cells confirmed by immunohistochemistry to have features of prostate cancer can be sampled for genetic profiling by FISH.(18) This report represents our experience with FISH analysis on a series of samples collected from 77 patients with progressive castration-resistant disease.
MATERIALS AND METHODS
Patients
Blood was collected from 77 patients with metastatic prostate cancer at Memorial Sloan-Kettering Cancer Center (MSKCC), under an Institutional Review Board–approved protocol with informed consent. Patients were considered to have progression of disease based on rising levels of prostate-specific antigen (PSA) or radiographic criteria. Rising PSA was defined according to the Prostate Cancer Working Group Criteria: a minimum of three successive increases in PSA levels, each at least one week apart. Radiographic criteria included new metastatic lesions seen by bone scintigraphy, and/or new or enlarging soft tissue masses by computed tomography (CT) and magnetic resonance imaging (MRI).(19) All patients had documented castrate levels of testosterone (<50 ng/dL).
Sample processing for CTC enumeration and FISH analysis
CTC were isolated and characterized as described previously (18, 20, 21). Briefly, blood samples were collected in CellSave tubes (Veridex, LLC, Huntingdon Valley, PA), and CTC were enriched by immunomagnetic isolation based on expression of epithelial cellular adhesion molecules (EpCAM) using an automated cell processor (CellTracks AutoPrep, Veridex, LLC). CTC were identified after dual immunofluorescence staining for cytokeratins and CD45, using a semi-automated fluorescence cell reader (CellTracks Analyzer II, Veridex, LLC). Five samples did not have exact CTC counts completed, so these sample CTC numbers were classified as high (substantially greater than 10) or low (less than 10) based on counts from other samples collected before and after the samples used for FISH analysis. After enumeration processing, the cells were removed from the collection chambers and centrifuged at 500 g for 10 minutes to clear unbound ferrofluid from the cells. The supernatant was removed and the pellet was resuspended with 800 μl of dilution buffer (PBS, 0.5% BSA, 0.5% EDTA, 0.1% sodium azide). The tube with cells was then placed on a MagCellect Magnet (R&D Systems, Minneapolis, MN) for 10 minutes to concentrate cells while the supernatant was again removed. The cells were resuspended in 200 μl of dilution buffer and spun onto charged slides at 1400 rpm for 4 minutes using a Shandon CytoSpin II cytocentrifuge. The slides were then sprayed with cytology fixative and allowed to air-dry. Upon transfer to MSKCC’s Molecular Cytogenetics Core laboratory the slides were placed in air-tight slide boxes with desiccant and stored at −20 °C.
FISH probes
FISH analysis was performed for AR, MYC, and 8p. Probes were produced as previously described (18). Bacterial artificial chromosome (BAC or PAC) clones spanning AR (RP11-479J1 and RP4-808O4), MYC (RP1- 80K22, RP11-1136L8, and CTD-2267H22), and NAT2 (RP11-809L8 and RP11-161I2) were obtained from Invitrogen (Carlsbad, CA) or as part of a 1 Mb cancer clone set from the Wellcome Trust Sanger Institute.(22) Human centromere–specific repetitive clones for chromosomes X and 8 were also used. DNA was labeled by nick translation to assemble 4-color probe sets using SpectrumOrange-dUTP, SpectrumGreen-dUTP, SpectrumRed-dUTP (Vysis, Abbott Molecular Inc.), and diethyl-aminocoumarin (DEAC)-dUTP (PerkinElmer Life and Analytical Sciences Inc., Waltham, MA). Twenty-six samples were also analyzed using a commercial prostate-specific probe set containing MYC, LPL, and chromosome 8 centromere probes (Vysis ProVysion, Abbott Molecular Inc.).
CTC FISH procedure
Slides were fixed in 95% ethanol or methanol for 10 minutes, air-dried, then incubated in 2xSSC at room temperature for 5 minutes. The slides were pretreated with 40 μg/mL pepsin (Sigma P-6887, Sigma-Aldrich, St. Louis, MO) in 0.01 N HCl at 37 °C for 5–10 minutes, washed with 2 changes of PBS and one change of PBS/MgCl2, and fixed in 1% paraformaldehyde solution for 10 minutes, then rinsed in PBS and dehydrated through ethanols. Approximately 50 ng–80 ng of each labeled clone was ethanol precipitated with 5μg COT-1 DNA (Invitrogen) and resuspended in hybridization buffer. The hybridization mix was applied to the pepsin-treated slides, codenatured at 80 °C for 3 minutes, and then incubated at 37 °C overnight in a HYBrite automated hybridizer (Vysis, Abbott Molecular Inc.). Unbound probe was removed by standard procedures. After DAPI staining, the slides were mounted in antifade solution (Vectashield, Vector Laboratories, Burlingame, CA) and examined using a Zeiss Axioplan 2 epifluorescence microscope controlled by Isis FISH imaging software (MetaSystems GmbH, Altlussheim, Germany).
FISH analysis
Because the enrichment process did not eliminate all leukocytes, contaminating granulocytes were used as internal controls for hybridization efficiency and specificity. When cell numbers were high, the slides were scanned using a DAPI filter and FISH signals were evaluated in all ovoid nuclei with prominent nucleoli. Signal counts were recorded for all probes, and the ratio of AR and MYC to their respective reference probes was assessed (X centromere for AR; 8 centromere or 8p probes for MYC). Abnormal signal patterns affecting only one probe were accepted as true genomic changes if present in at least 3 cells, but a single cell having changes affecting at least 2 probes from the same chromosome (such as loss of 8p plus gain of MYC) was considered positive. Multiple signals of normal size were scored as copy gain, with counts higher than 5 recorded as high copy gain. Because accurate ratios were difficult to assess, locus amplification was defined either as one or more tight clusters of signals or as more than 10 dispersed signals. Larger CTC were scored as polyploid (or aneuploid) when all probe signals were present in at least twice the numbers typically seen in cells with only minor changes.
RESULTS
FISH analysis
The clinical characteristics and FISH probe combinations utilized on the 77 patients studied are summarized in Table 1. The FISH results for 5 of these patients were reported previously in relation to ERBB2.(18) FISH for AR was successfully performed on samples from 49 of 54 patients (90.7%), while MYC analysis was successful for 54 of 64 patients (84.4%). Thirty-six samples from 41 patients yielded results for AR and MYC (87.8%). Results for 8p (LPL or NAT2) were obtained in combination with MYC from 43 of 49 patients (87.8%). Samples from 10 patients failed to yield adequate FISH results, giving an overall success rate of 87%. Reasons for failure in the ten samples included high cell density—contaminating leukocytes (2) or erythrocytes (2)—poor cell morphology (1), cell loss during slide processing (1) unsatisfactory FISH signals (1), or a combination of these issues (3).
Table 1. Baseline characteristics of 77 patients (pts) with metastatic prostate cancer.
| Characteristic | Number (% or interquartile range) |
|---|---|
| Age, years | 70 (63–77) |
| PSA at diagnosis, ng/mL | 21.1 (7.7–95.1) |
| Initial treatment: | |
| Radical prostatectomy | 24 (31%) |
| Radiation therapy to the prostate | 16 (21%) |
| No treatment | 37 (48%) |
| Sites of metastasis: | |
| Bone only | 25 (33%) |
| Lymph node and bone | 31 (40%) |
| Lymph node only | 6 (8%) |
| Visceral disease | 14 (18%) |
| Bone and soft tissue (other than lymph node) | 1 (1%) |
| CTC counts/7.5 mL blood – median (IQR) | 29 (7–89) |
| PSA, ng/mL – median (IQR) | 188.2 (65.9–573.4) |
| FISH probe | Number of pts samples hybridized |
Number (%) of pts with FISH results |
|---|---|---|
| AR only | 13 | 13 (100%) |
| AR + MYC | 15 | 11 (73%) |
| MYC + 8p | 23 | 18 (78%) |
| AR + MYC + 8p | 26 | 25 (96%) |
| Total | 77 | 67 (87%) |
Based on our previous experience of approximately 40% cell recovery,(18) we used a CTC cutoff of 10 to ensure the presence of at least 3 CTC for FISH scoring of a change affecting only one probe. Therefore the results are presented in two categories based on this number.
FISH for AR copy number
Increased AR copy number was detected in 30 of 49 (60%) patients (Table 2) of which 17 (34%) had high-level AR amplification; of these, FISH patterns were consistent with double minute formation in one case and one or more homogeneously staining regions (hsr) in the other cases (Fig. 1A-C). All patients with AR amplification had CTC counts greater than 10. The patient with the sample showing apparent double minutes had the highest CTC counts in this study. AR copy gain was seen in 13 patients (27%), while both AR and X centromere copy gain was noted in 4 patients with centromeric doublets flanked by AR signals, suggesting possible isochromosome formation for Xq (Fig. 1B). No abnormality was detected in 17 cases. FISH signals consistent with polyploidy were seen in at least some CTC from 15 of the 17 patients with AR amplification.
Table 2. FISH results for androgen receptor (AR)*, MYC**, and MYC/8p*** results.
| AR FISH results | ||||
|---|---|---|---|---|
| Amplification | Copy Gain | NAD | Total | |
| No. of patients (%) | 17 (34.7%) | 13 (26.5%) | 19 (38.8%) | 49 |
|
Median CTC counts
(1st–3rd quartiles) |
90 (39–114) |
26 (12–86) |
4 (3–10) |
26.5 (5–99.5) |
|
| ||||
| CTC <10 (%) | 0 | 3 (20%) | 12 (80%) | 15 |
| CTC ≥10 (%) | 17 (50%) | 10 (29.4%) | 7 (20.6%) | 34 |
| MYC FISH results | ||||
|---|---|---|---|---|
| No. of patients (%) | 1 (1.9%) | 32 (59.3%) | 21 (38.9%) | 54 |
|
Median CTC counts
(1st–3rd quartiles) |
11 | 53 (24–101) |
5.5 (2–39) |
27 (6–86.5) |
|
| ||||
| CTC <10 (%) | 0 | 4 (25%) | 12 (75%) | 16 |
| CTC ≥10 (%) | 1 (2.6%) | 28 (73.7%) | 9 (23.7%) | 38 |
| Gain MYC, 8p ratio >=1.5 |
Gain MYC, 8p ratio 1 |
NAD | Total | |
|---|---|---|---|---|
| No. of patients (%) | 24 (55.8%) |
5 (11.6%) |
14 (32.6%) |
43 |
|
Median CTC counts
(1st–3rd quartiles) |
72 (32.3–107.3) |
55 (12–86) |
10 (2–27) |
24 (11–90) |
|
| ||||
| CTC <10 (%) | 0 | 1 (12.5%) | 7 (87.5%) | 8 |
| CTC ≥10 (%) | 24 (68.6%) | 4 (11.4%) | 7 (20%) | 35 |
No result was obtained from 5 samples, median CTC number 56 (IQR 28–271).
Abnormalities were seen in 33 of 54 patients successfully analyzed. No result was obtained from 10 samples, median CTC number 46.5 (IQR 24–294).
No result was obtained from 6 samples, median CTC number 24 (IQR 9–135). NAD = no abnormality detected.
Figure 1.
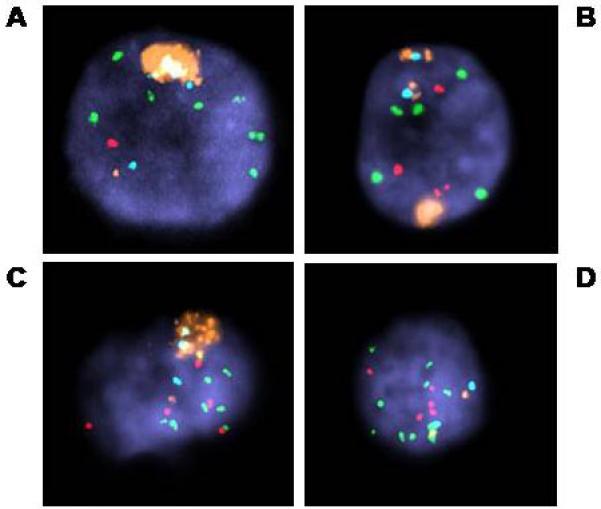
AR amplification in CTC. All were hybridized with probes for AR (orange), X centromere (aqua), MYC (green), and 8p (NAT2, red). Note that A also has loss of 8p and high level (>5) copy gain of MYC. AR amplification clusters are seen in addition to apparently normal signals for AR and corresponding X centromere, but B has 2 copies of a probable isochromosome for Xq: AR-Xcen-AR. Heterogeneity of FISH patterns in analyzing CTC from one patient, with AR amplification in some cells, and not in others, all with high copy gain for MYC and gain 8p (C, D).
FISH for MYC copy number
One patient had CTC demonstrating MYC amplification, and 32 patients showed MYC copy gain (Fig.2). Twenty-one patients had no detectable abnormality in MYC copy number (Table 2). Of the 43 patients with MYC and 8p FISH results, 24 had MYC/8p ratios of 1.5 or more (Table 2). In this group there were 17 patients with at least some apparently polyploid cells. The median CTC count for these 17 patients was 87 (IQR 34.5–131), which was substantially higher than the median CTC count of 47 (IQR 34.5–65) for the 7 patients whose CTC appeared to be near-diploid. An additional 5 patients showed gain of both MYC and 8p, with a ratio suggesting tetraploidy. Fourteen patients had no abnormalities detected for MYC or 8p.
Figure 2.
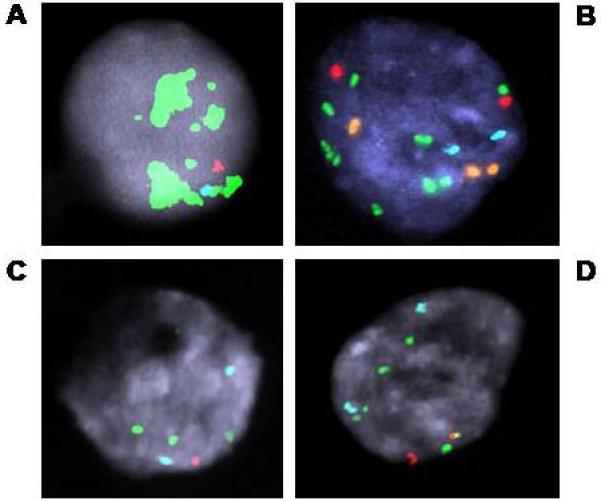
MYC abnormalities seen in CTC. A. MYC amplification. B. Aneuploidy, probably polyploidy, with relative gain of MYC. C&D. Loss of 8p with gain of MYC and corresponding polyploid version from the same sample. Probes used for A, C, & D: MYC (green), 8 centromere (aqua) and 8p (LPL, red)(ProVysion); and for B: AR (orange), X centromere (aqua), MYC (green) and 8p (NAT2, red).
FISH with AR, MYC, and 8p probes
Of the 25 patients with results for AR, MYC, and 8p, all 12 patients with AR amplification also had gain of MYC relative to 8p copy number (Table 3). Three patients had relative gain of MYC associated with AR copy gain relative to the X centromere, and two had relative gain of MYC with normal X chromosome signal patterns. The modal CTC count for the AR amplification group was 90, with an interquartile range of 36.75 to 128.25. This appeared to be higher than the other groups but sample numbers were too low for statistical comparison. In addition, two samples with AR amplification also had some cells with gain of MYC but no apparent AR amplification.
Table 3. Relationship of FISH patterns for AR and MYC/8p ratio.
| FISH Pattern |
AR Amplification |
AR Copy Gain |
AR NAD | Total |
|---|---|---|---|---|
| MYC gain ≥1.5 8p | 12 (48%) | 3 (12%) | 2 (8%) | 17 (68%) |
|
MYC copy gain
Ratio 1:1 8p |
0 | 5 (20%) | 0 | 5 (20%) |
| MYC NAD | 0 | 0 | 3 (12%) | 3 (12%) |
|
| ||||
| Total | 12 (48%) | 8 (32%) | 5 (20%) | 25 |
FISH patterns associated with advanced prostate tumors
We also used FISH to examine the distribution of CTC counts in relation to the recognized prostate tumor abnormalities of AR amplification and/or relative gain of MYC (MYC/8p ratio ≥ 1.5). No such abnormalities were detected in samples with CTC counts less than 10, whereas nonspecific copy gains were detected over the whole range. We then examined the incidence of polyploidy or mixed tumor cell populations in the 29 patients identified with prostate tumor– specific FISH abnormalities. Higher CTC numbers were seen in patients with polyploidy. Overall, cells with FISH patterns consistent with tetraploidy were seen in 29 of the 40 samples with abnormal findings (72.5%); 11 (37.9%) of the 29 showed a mixture of abnormal cell populations (Fig 1C - D).
Additional observations
We also noted large lobulated cells that resembled cell clusters or potential microemboli in at least one third of all samples. These cells were usually intensely DAPI-positive and much more three-dimensional than other cell types present. The pattern of FISH signals was usually consistent with an 8n—or more rarely a 16n—chromosome content. Because these multiple FISH signals were often clustered rather than being distributed evenly across the nuclear mass, these cells were interpreted as single entities derived from megakaryocytes (Fig. 3A). However, some cells had ambiguous morphology and could not be positively identified (Fig. 3B, 3C).
Figure 3.
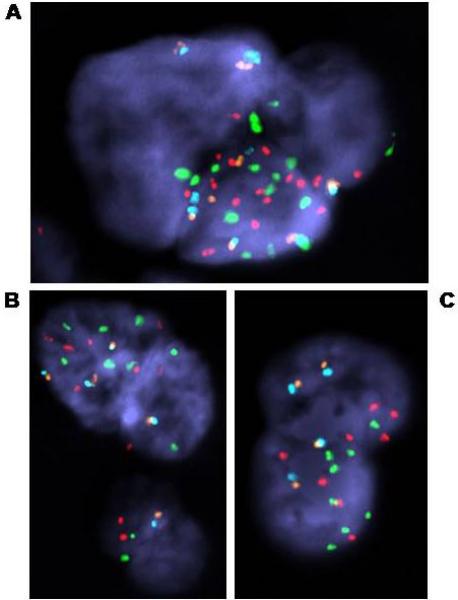
FISH analysis of CTC and atypical cells.
A. Apparent megakaryocyte with 16n probe copy number. Note the clustering of signals in one area, indicating that the whole cluster represents a single convoluted nucleus.
B. Possible CTC cluster (microembolus of 4 cells with normal signal pattern) or megakaryocyte derivative (8n copy number), plus normal leukocyte from same sample as A. CTC from this sample showed a probable Xq isochromosome as the sole abnormality detected. Probes used: AR (orange), X centromere (aqua), MYC (red) and chromosome 8 centromere (green). C. Convoluted nucleus with 8n probe copy number, origin uncertain. Probes used: AR (orange), X centromere (aqua), MYC (green) and 8p (NAT2, red).
DISCUSSION
FISH was performed on CTC isolated from a series of patients to evaluate the feasibility of using it as part of the routine management of progressive castration resistant prostate cancer. The overall success rate of the FISH procedure was 87%, but we found that this improved substantially with experience. If samples with excess leukocytes or contaminating erythrocytes are identified so that additional washing steps can be performed, or the sample diluted appropriately, before slide preparation, a greater than 95% success rate can be expected.
When FISH was successful, we were able to detect abnormalities associated with prostate cancer (relative gain of MYC or amplification of AR) in 43% of the patients analyzed. The high incidence of relative loss of 8p and gain of MYC seen in this study is consistent with the recognized pattern of early 8p loss in the majority of prostate tumors, and also the increasing gain of 8q that has been associated with late stage castration resistant disease, where some 40%-45% of samples show MYC or 8q copy gains relative to LPL/8p.(12, 14, 23) These frequencies suggest that we are detecting cells that are broadly representative of aggressive late-stage tumors.(9-14)
High-level amplification of AR was found in 35% of the patients studied, including 50% of the patients with CTC counts greater than 10 cells per 7.5 ml of blood. The rate of AR amplification in CTC is significantly higher than that observed in untreated localized prostate cancers, and higher than the approximately 30% incidence in locally recurrent castration-resistant tumor samples.(15, 24, 25) A separate study showed true AR amplification in 22%–23% of local recurrences and soft tissue metastases respectively.(16) The frequency in the current study is similar to that reported in a series of castration-resistant prostate cancers metastatic to bone, although a less stringent definition of amplification was applied in that study.(17)
These results suggest that a substantial number of patients acquire the amplification phenotype during progression to the castration resistant state. While it is possible that cells shed from bone marrow metastases differ from those shed at soft tissue sites, since cellular heterogeneity is well recognized, further study is needed to determine this. Alternatively, differences in treatment history between this cohort and those of earlier studies may have contributed to stronger therapy-mediated selection pressure.(27) Irrespective of etiology, the higher frequency of AR amplification events in the setting of castrate androgen levels, suggests that these late-stage tumors continue to be dependent on androgen receptor signaling for growth.
Amplification of AR is one means of enhancing tumor response to very low hormone levels, but cells that have initiated true amplification events also appear to develop the increased chromosomal instability associated with more aggressive tumors.(27) This is demonstrated by our observation that CTC samples with AR amplification also showed gain of MYC relative to 8p copy number, and most also had increased signal copies consistent with polyploidy or substantial aneuploidy.
These abnormalities were not detected in patients with CTC counts of less than 10 (abnormalities were found in 64% of samples having CTC counts of 10 or more), which raises the issue of ascertainment. These results confirm our previous experience that CTC recovery is currently too inefficient for reliable processing of these low-count samples.(18) It is probable that not all cells identified by the CellSearch system retain sufficient cellular integrity to survive the slide-making process or subsequently yield adequate FISH signals. In addition, there is considerable variability in the morphology of identified CTC in individual patients, a parameter that will also need to be monitored to ensure successful profiling. Heterogeneity in the chromosomal abnormalities in CTC in the same patient was also observed in a separate series in which copy numbers for chromosomes 1, 7, 8 and 17 were evaluated.(28) It is also possible that in some patients, the CTC associated with low cell counts may have a different genetic profile than those found in patients with higher numbers of cells. For now, to profile a patient with low CTC numbers we are using computerized tomography to guide the biopsy of lesions shown to be fluorodeoxyglucose avid on positron emission tomography, which, although more costly and invasive, has been successful in approximately 90% of cases.
More than 40% of the total samples analyzed, and 72% of abnormal samples, had cells with FISH signals that could be interpreted as polyploid. The association of polyploidy with a higher CTC count is consistent with the presence of more advanced or disseminated disease. It is possible that assessment of DNA ploidy in CTC may provide additional prognostic information, because an increase in tumor ploidy has long been associated with poor outcome.(29) Some samples had a mixture of abnormal cells—which seemed to be associated with higher CTC counts in the polyploidy group—but greater sample numbers are needed to assess the significance of CTC heterogeneity.
Even in the absence of obvious CTC, cells with atypical morphology and abnormal FISH patterns could be detected in many patients. Based on morphology and the regular pattern of FISH signals consistent with 8n or, rarely, 16n DNA content, the majority of these appeared to be either megakaryocytes or their derivatives and so could be excluded from the analysis. However, some patients had small numbers of cells of uncertain origin that had aneuploid FISH signals for most or all FISH probes used. These patterns were consistent with either trisomy 8 or tetraploidy, neither of which are necessarily associated with solid tumors. Some atypical megakaryocytes may also be tetraploid; trisomy 8 is frequently observed in myelodysplasia; and tetraploidy may also be seen in hematological malignancies, so it is possible that such cells originate from the bone marrow (myeloid/hematopoietic origin). Increased levels of aneuploidy, particularly for the X chromosome, are also seen in peripheral lymphocytes of older individuals.(30) Given that many of these patients have a previous history of chemotherapy and/or radiotherapy, it is not surprising to find chromosome abnormalities in peripheral blood cells.
The increased incidence of nonspecific abnormal FISH patterns in samples with low CTC counts is assumed to be the result of sampling bias. In the absence of clear CTC morphology, all cells must be scrutinized and any abnormalities recorded. The presence of sufficient morphologically distinct or abundant CTC means that samples can be screened more rapidly and any marginal cells ignored. Nevertheless, our data suggest that significant levels of abnormal non-CTC cells exist in many, if not all, samples. Therefore all analyses focusing on CTC must follow stringent criteria, particularly when cell numbers are low. Ideally, prior identification of CTC using a recognized procedure such as anti-cytokeratin immunostaining should be employed.
In this study, we have demonstrated that it is feasible to molecularly characterize individual CTC isolated from blood samples in patients with metastatic castration resistant prostate cancer. We have shown that a significant proportion of patients have genomic amplification of AR and chromosomal instability. Recent studies have shown that patients with castration resistant disease remain sensitive to therapies targeting the androgen receptor signaling axis.(1,2) We are now in a position to perform longitudinal studies of FISH on CTC in men with progressive castration resistant disease enrolled on trials with specific agents to explore the significance of these molecular determinants in relation to prognosis and response to therapy.
IMPACT STATEMENT
Men with castration-resistant prostate cancer have limited therapeutic options. Management is complicated by the uncertainty of predicting the prognosis of individual patients. Biomarkers could define prognosis more precisely, and guide treatment selection based on tumor biologic profile. Circulating tumor cells (CTC) have been isolated from blood using the analytically valid CellSearch system. We applied FISH to CTC to analyze the androgen receptor and MYC genomic copy number in samples from 77 patients with progressive castration-resistant prostate cancer. We found high-level amplification of AR in half of the patients with 10 or more CTC, suggesting that a substantial number of patients acquire this phenotype during disease progression. This study demonstrates the feasibility of characterizing CTC by FISH. Longitudinal studies of CTC in men with advanced prostate cancer are now exploring the association of these molecular markers in relation to prognosis and response to novel agents targeting the AR signaling axis currently in clinical development.
Acknowledgments
Supported by: NCI SPORE in Prostate Cancer (P50 CA92629 Pilot Projects 7 and 14), the Prostate Cancer Foundation, Mr. William H. Goodwin and Mrs. Alice Goodwin and the Commonwealth Foundation for Cancer Research, and The Experimental Therapeutics Center of Memorial Sloan-Kettering Cancer Center
REFERENCES
- 1.Attard G, Reid AH, Yap TA, et al. Phase I clinical trial of a selective inhibitor of CYP17, abiraterone acetate, confirms that castration-resistant prostate cancer commonly remains hormone driven. J Clin Oncol. 2008;26:4563–71. doi: 10.1200/JCO.2007.15.9749. [DOI] [PubMed] [Google Scholar]
- 2.Scher HI, Beer TM, Higano CS, et al. Phase I/II study of MDV3100 in patients (pts) with progressive castration-resistant prostate cancer (CRPC) Proc ASCO. 2008;26 Abstract # 5006. [Google Scholar]
- 3.Cristofanilli M, Budd GT, Ellis MJ, et al. Circulating tumor cells, disease progression, and survival in metastatic breast cancer. N Engl J Med. 2004;351:781–91. doi: 10.1056/NEJMoa040766. [DOI] [PubMed] [Google Scholar]
- 4.Cohen SJ, Punt CJA, Iannotti N, et al. The relationship of circulating tumor cells to tumor response, progression-free survival, and overall survival in patients with metastatic colorectal carcinoma. J Clin Oncol. 2008:26. doi: 10.1200/JCO.2007.15.8923. [DOI] [PubMed] [Google Scholar]
- 5.DeBono JS, Scher HI, Montgomery B, et al. Circulating tumor cells predict overall survival following treatment in metastatic prostate cancer. Clinical Cancer Res. 2008 doi: 10.1158/1078-0432.CCR-08-0872. Submitted. [DOI] [PubMed] [Google Scholar]
- 6.Speicher MR, Carter NP. The new cytogenetics: blurring the boundaries with molecular biology. Nat Rev Genet. 2005;6:782–92. doi: 10.1038/nrg1692. [DOI] [PubMed] [Google Scholar]
- 7.Engel H, Kleespies C, Friedrich J, et al. Detection of circulating tumour cells in patients with breast or ovarian cancer by molecular cytogenetics. Br J Cancer. 1999;81:1165–73. doi: 10.1038/sj.bjc.6690825. [DOI] [PMC free article] [PubMed] [Google Scholar]
- 8.Fehm T, Sagalowsky A, Clifford E, et al. Cytogenetic evidence that circulating epithelial cells in patients with carcinoma are malignant. Clin Cancer Res. 2002;8:2073–84. [PubMed] [Google Scholar]
- 9.Cher ML, Bova GS, Moore DH, et al. Genetic alterations in untreated metastases and androgen-independent prostate cancer detected by comparative genomic hybridization and allelotyping. Cancer Res. 1996;56:3091–102. [PubMed] [Google Scholar]
- 10.Visakorpi T, Hyytinen E, Koivisto P, et al. In vivo amplification of the androgen receptor gene and progression of human prostate cancer. Nat Genet. 1995;9:401–6. doi: 10.1038/ng0495-401. [DOI] [PubMed] [Google Scholar]
- 11.Jenkins RB, Qian J, Lieber MM, Bostwick DG. Detection of c-myc oncogene amplification and chromosomal anomalies in metastatic prostatic carcinoma by fluorescence in situ hybridization. Cancer Res. 1997;57:524–31. [PubMed] [Google Scholar]
- 12.Sato K, Qian J, Slezak JM, et al. Clinical significance of alterations of chromosome 8 in high-grade, advanced, nonmetastatic prostate carcinoma. J Natl Cancer Inst. 1999;91:1574–80. doi: 10.1093/jnci/91.18.1574. [DOI] [PubMed] [Google Scholar]
- 13.Tsuchiya N, Kondo Y, Takahashi A, et al. Mapping and gene expression profile of the minimally overrepresented 8q24 region in prostate cancer. Am J Pathol. 2002;160:1799–806. doi: 10.1016/S0002-9440(10)61126-1. [DOI] [PMC free article] [PubMed] [Google Scholar]
- 14.Ribeiro FR, Henrique R, Hektoen M, et al. Comparison of chromosomal and array-based comparative genomic hybridization for the detection of genomic imbalances in primary prostate carcinomas. Mol Cancer. 2006;5:33. doi: 10.1186/1476-4598-5-33. [DOI] [PMC free article] [PubMed] [Google Scholar]
- 15.Koivisto P, Kononen J, Palmberg C, et al. Androgen receptor gene amplification: a possible molecular mechanism for androgen deprivation failure in prostate cancer. Cancer Res. 1997;57:314–9. [PubMed] [Google Scholar]
- 16.Bubendorf L, Kononen J, Koivisto P, et al. Survey of gene amplifications during prostate cancer progression by high-throughout flurorescence in situ hybridization on tissue microarrays. Cancer Res. 1999;59:803–6. [PubMed] [Google Scholar]
- 17.Brown RS, Edwards J, Dogan A, et al. Amplification of the androgen receptor gene in bone metastases from hormone-refractory prostate cancer. J Pathol. 2002;198:237–44. doi: 10.1002/path.1206. [DOI] [PubMed] [Google Scholar]
- 18.Shaffer DR, Leversha MA, Danila DC, et al. Circulating tumor cell analysis in patients with progressive castration-resistant prostate cancer. Clin Cancer Res. 2007;13:2023–9. doi: 10.1158/1078-0432.CCR-06-2701. [DOI] [PubMed] [Google Scholar]
- 19.Scher HI, Halabi S, Tannock I, et al. Design and end points of clinical trials for patients with progressive prostate cancer and castrate levels of testosterone: Recommendations of the Prostate Cancer Clinical Trials Working Group. J Clin Oncol. 2008;26:1148–59. doi: 10.1200/JCO.2007.12.4487. [DOI] [PMC free article] [PubMed] [Google Scholar]
- 20.Allard WJ, Matera J, Miller MC, et al. Tumor cells circulate in the peripheral blood of all major carcinomas but not in healthy subjects or patients with nonmalignant diseases. Clin Cancer Res. 2004;10:6897–904. doi: 10.1158/1078-0432.CCR-04-0378. [DOI] [PubMed] [Google Scholar]
- 21.Danila DC, Heller G, Gignac GA, et al. Circulating tumor cell number and prognosis in progressive castration-resistant prostate cancer. Clin Cancer Res. 2007;13:7053–8. doi: 10.1158/1078-0432.CCR-07-1506. [DOI] [PubMed] [Google Scholar]
- 22.Fiegler H, Carr P, Douglas EJ, et al. DNA microarrays for comparative genomic hybridization based on DOP-PCR amplification of BAC and PAC clones. Genes Chromosomes Cancer. 2003;36:361–74. doi: 10.1002/gcc.10155. [DOI] [PubMed] [Google Scholar]
- 23.van Dekken H, Alers JC, Damen IA, et al. Genetic evaluation of localized prostate cancer in a cohort of forty patients: gain of distal 8q discriminates between progressors and nonprogressors. Lab Invest. 2003;83:789–96. doi: 10.1097/01.lab.0000074889.76221.49. [DOI] [PubMed] [Google Scholar]
- 24.Kaltz-Wittmer C, Klenk U, Glaessgen A, et al. FISH analysis of gene aberrations (MYC, CCND1, ERBB2, RB, and AR) in prostatic carcinomas before and after androgen depriviation therapy. Lab Invest. 2000;80:1455–64. doi: 10.1038/labinvest.3780152. [DOI] [PubMed] [Google Scholar]
- 25.Haapala K, Kuukasjarvi T, Hyytinen E, Rantala I, Helin HJ, Koivisto PA. Androgen receptor amplification is associated with increased cell proliferation in prostate cancer. Hum Pathol. 2007;38:474–8. doi: 10.1016/j.humpath.2006.09.008. [DOI] [PubMed] [Google Scholar]
- 26.Scher HI, Buchanan G, Gerald W, Butler LM, Tilley WD. Targeting the androgen receptor: improving outcomes for castration-resistant prostate cancer. Endocr Relat Cancer. 2004;11:459–76. doi: 10.1677/erc.1.00525. [DOI] [PubMed] [Google Scholar]
- 27.Koivisto P, Visakorpi T, Rantala I, Isola J. Increased cell proliferation activity and decreased cell death are associated with the emergence of hormone-refractory recurrent prostate cancer. JPathol. 1997;183:51–6. doi: 10.1002/(SICI)1096-9896(199709)183:1<51::AID-PATH1092>3.0.CO;2-N. [DOI] [PubMed] [Google Scholar]
- 28.Tibbe A, Swenehuis J, Levink R, Sipkema R, Terstappen L. Cytogenetic analysis of circulating tumor cells of metastatic prostate cancer. Proc AACR. 2008 abstr 274. [Google Scholar]
- 29.Adolfsson J. Prognostic value of deoxyribonucleic acid content in prostate cancer: a review of current results. Int J Cancer. 1994;58:211–6. doi: 10.1002/ijc.2910580212. [DOI] [PubMed] [Google Scholar]
- 30.Jacobs PA, Court Brown WM, Doll R. Distribution of human chromosome counts in relation to age. Nature. 1961;191:1178–80. doi: 10.1038/1911178a0. [DOI] [PubMed] [Google Scholar]