Abstract
ANS is widely used as a probe for locating binding sites of proteins and studying structural changes under various external conditions. However, the nature of ANS-binding sites in proteins and the accompanying changes in fluorescence properties are controversial. We examined the steady-state and time-resolved fluorescence of the ANS–protein complexes for tear lipocalin (TL) and its mutants in order to discern the origin of lifetime components via analysis that included the multiexponential decay and the model-free maximum entropy methods. Fluorescence lifetimes of ANS–TL complexes can be grouped into two species, 14.01–17.42 ns and 2.72–4.37 ns. The log-normal analyses of fluorescence spectral shapes reveal the heterogeneous nature of both long- and short-lifetime species. The constructed time-resolved emission, amplitude (TRES) and area normalized (TRANES), and decay-associated spectra are consistent with a model that includes heterogeneous modes of ANS binding with two separate lifetime components. The two lifetime components are not derived from solvent relaxation, but rather may represent different binding modes.
Introduction
ANS is routinely used for quantitative analysis of drug binding to proteins (1). In molten globule transitions, ANS fluorescence serves to identify for hydrophobic patches in proteins (2,3). Fluorescence enhancement observed with ANS–protein complexes is usually attributed to hydrophobicity in binding sites of the proteins. However, some ANS-binding studies demonstrate an electrostatic interaction (4–7). The binding energetics as well as the crystal structures of ANS–protein complexes show ion pairing of ANS with positively charged side chains. Such electrostatic interactions for ANS binding have been demonstrated for buried sites as well as external sites of proteins (4–8).
Recently, 10 human lipocalins were tested for ANS binding (9). The dissociation constants for eight lipocalins fell into the range of 3–11 μm. Retinol-binding protein showed no ANS binding at physiologic pH. Alpha 1-acid glycoprotein (AGP) showed the highest affinity (Kd∼1 μm). Another study (10) showed that AGP has two binding sites for ANS binding, high (0.74 μm) and low affinity (10.8 μm). The lipocalin family shares a common motif. Eight strands are arranged in a β-barrel and are joined by loops between the β-strands (11). Despite the high structural similarity, affinities of ANS to the individual members of the lipocalin family differ greatly implicating a variety of binding mechanisms. Even though ANS binding has frequently been used for members of the lipocalin family, β-lactoglobulin (BLG) is the only protein that has been tested for ion pairing in the ANS–protein complex (8). Therefore, the precise determination of the binding mode is necessary for each particular protein before conclusions can be drawn about the nature of the ANS–protein interaction. Furthermore, almost all ANS–protein complexes show multiple lifetimes for ANS fluorescence, which may occur for many reasons including the presence of multiple-binding sites and solvent relaxation.
The dependence of the quantum yield and emission energy of ANS on solvent polarity reveals that the emission arises from two different excited states (12,13). Upon excitation, the molecule first reaches an excited state localized on the naphthalene ring, which has been called the locally excited or nonpolar (NP) state. The emission from this state occurs in NP solvents and its maximum varies modestly with polarity. In nonaqueous polar solvents, the NP state undergoes an intramolecular electron-transfer (ET) reaction to form the charge-transfer (CT) state that becomes the low-energy state and emits at a longer wavelength. In aqueous solvent, another intermolecular ET process serves as an efficient mechanism for radiationless decay from the CT state that results in a decreased fluorescence yield of ANS (12,13). However, the deactivation process, the intermolecular ET to solvent, does not occur in nonaqueous polar solvents (methanol, ethanol, etc.) because of the slowness of the required solvent reorientations for larger polar molecules compared with that of water molecules (14,15). The result is increased fluorescence quantum yield and lifetime (15,16).
ANS fluorescence also depends on the viscosity of the solvent. A viscous solvent decreases the rate of conversion from the NP state to the CT state. This observation is consistent with the model that ANS has a nonplanar configuration in the ground and NP states. Decreased viscosity facilitates conversion of the nonplanar NP state to the planar CT state (12,13,17). The resulting spectroscopic peak from the CT emission is broader, more prominent, and shows larger shifts in polar solvents than that of the NP state (12,17).
In general, increased fluorescence intensity (quantum yield) may be the result of a hydrophobic environment and/or restricted motion of ANS and solvent molecules in a polar-binding site. Therefore, ANS is not purely a “hydrophobic probe” in protein research.
ANS has been widely used to study the ligand binding of lipocalins (8–10,18–25). For some lipocalins, two binding sites (high and low affinity) were detected (10,20). Heterogeneous binding of ANS to β-lactoglobulin has been shown by fluorescence lifetimes of ANS–protein complexes (8). Here, we studied the steady-state and time-resolved fluorescence of the ANS–protein complexes for tear lipocalin (TL) and its mutants in order to discern the origin of the lifetime components via analysis that includes the multiexponential decay, and model-free maximum entropy methods (MEM). The constructed TRES, TRANES and decay-associated spectra (DAS) are consistent with the model that multiple species of ANS–TL complexes are the origin of multiple lifetimes.
Materials and Methods
Site-directed mutagenesis and plasmid construction
The TL cDNA in polymerase chain reaction II (PCR II) (Invitrogen, San Diego, CA), previously synthesized (26), was used as a template to clone the TL gene spanning bases 115–592 of the previously published sequence (27) into pET 20b (Novagen). Flanking restriction sites for NdeI and BamHI were added to produce the native protein sequence as found in tears (28). To construct mutant proteins with a single tryptophan, the previously well-characterized TL mutant, W17Y, was prepared with oligonucleotides (Universal DNA Inc.) by sequential PCR steps (29,30). Using this mutant as a template, mutant cDNAs were constructed in which the corresponding amino acids were additionally substituted sequentially with tryptophan. Amino acid 1 corresponds to His, bases 115–118 according to Redl (27). Single Trp mutants include W17Y/E34W (for simplicity denoted as E34W); W17Y/M39W (M39W); W17Y/G47W (G47W); W17Y/M55W (M55W); W17Y/G59W (GW59); W17Y/A66W (A66W); W17Y/H84W (H84W); W17Y/I88W (I88W); W17Y/F99W (F99W); W17Y/C101W (C101W); W17Y/G103W (G103W); W17Y/E104W (E104W); W17Y/L105W (L105W). The recombinant wild type of TL is denoted as WTL.
Expression and purification of mutant proteins
The mutant plasmids were transformed in Escherichia coli BL 21 (DE3), and cells were cultured and proteins were expressed according to the manufacturer's protocol (Novagen). Following cell lysis (31), the supernatant was treated with methanol (40% final concentration) at 4°C for 2 1/2 h. Alternatively, mutant proteins expressed in inclusion bodies were dissolved in 8 m urea at room temperature for 2 h. In either case, the resulting suspension was centrifuged at 3000 g for 30 min. The supernatant was dialyzed against 50 mm Tris–HCl pH 8.4. The dialysate was treated with ammonium sulfate 45–75% saturation. The resulting precipitate was dissolved in 50 mm Tris–HCl pH 8.4 and applied to a Sephadex G-100 column (2.5 × 100 cm) equilibrated with 50 mm Tris–HCl and 100 mm NaCl, pH 8.4. The fraction containing the mutant protein was dialyzed against 50 mm Tris–HCl, pH 8.4 and applied to a DEAE Sephadex A-25 column. Bound protein was eluted with a 0–0.8 m NaCl gradient. Eluted fractions containing mutant proteins were centrifugally concentrated (Amicon, Centricon-10). Purity of mutant proteins was verified by SDS–tricine gel electrophoresis (32). Apo-TL was produced from TL by chloroform/methanol extraction as described previously (32). The protein concentration was determined by the biuret method (33).
Steady-state fluorescence
Steady-state fluorescence measurements were made on a Jobin Yvon-SPEX (Edison, NJ) Fluorolog tau-3 spectrofluorometer, bandwidth for excitation 2 nm and emission were 3 nm, respectively. The excitation λ of 335 nm was used for ANS fluorescence. All spectra for ANS–protein complexes were obtained in 10 mm sodium phosphate, pH 7.3. Temperature was maintained at 25°C with a thermojacketed cell holder. The fluorescence spectra were corrected for light scattering from buffer.
Log-normal fitting of steady-state ANS fluorescence spectra
ANS fluorescence spectra were obtained in dioxane, acetonitrile, ethanol and buffer to include emission λmax in a broad range (465–530 nm). These spectra were fit to the biparametric log-normal function:
where Imax = I(λmax) is the maximal fluorescence intensity; λmax is the wavelength of the band maximum; p = (1/λmax − 1/λ−)/(1/λ+ − 1/λmax) is the band asymmetry parameter; a = 1/λmax + (1/λ+ − 1/λ−)p/(p2 − 1) is the function-limiting point where, λ+ and λ− are the wavelength positions of half-maximal amplitudes.
Fluorescence lifetime measurements
The fluorescence decays of the ANS–protein complexes were measured using a PTI Time Master fluorescence lifetime instrument, which consists of a nitrogen laser (GL-3300) linked to a dye laser (GL 302), a frequency doubler (GL 303) and a stroboscopic detector. DCM (Exciton, Inc., Dayton, OH) dye solution was used to obtain a wavelength of 670 nm. The 335 nm pulses (Full width at half maximum ∼1.5 ns) from frequency doubled light were used for the excitation of the ANS–protein complexes. The decay curves were analyzed for emission wavelengths between 420 and 545 nm with 5 nm intervals. The emission monochromator slit was 3 nm. The temperature was maintained at 25°C with a thermojacketed cuvette holder. The instrument response function (IRF) was determined by measuring scattered light from a solution of glycogen. A DPU-15 optical depolarizer (Optics for Research, Caldwell, NJ) was placed before the emission monochromator to eliminate polarization dependence of the detection train. Each data point on a lifetime decay curve represents the average of nine laser flashes, and each decay represents 300 of these data points evenly spaced over the collection time interval.
The intensity decay data were analyzed using the software supplied with the PTI instrument. Both a multiexponential decay law and a model-free MEM were used in the analysis. For a multiexponential decay law:
where I is fluorescence intensity, αi and τi are the normalized pre-exponential factors and decay time, respectively. The fractional fluorescence intensity of each component is defined as fi = αi τi/Σ αj τj
The average fluorescence lifetime for protein-ANS complex was calculated as τaver = Σfi τi
In MEM, a series of 200 exponentials, logarithmically spaced lifetimes and variable pre-exponentials terms, were used. The criteria of the fitting procedure were the minimized chi-squared function and maximized Shannon–Jaynes entropy function (34,35).
Construction of decay-associated spectra
Decay-associated spectra were constructed using global multiexponential decay analysis across the emission spectrum of ANS–TL complex, resulting in wavelength-dependent data (36):
Then αi(λ) values were used to construct DAS for each τi:
where I(λ) is the steady-state fluorescence intensity at each wavelength of the emission spectrum.
Decay-associated spectra were also constructed from results of MEM analysis. The species were grouped in three lifetime classes: very short (<1 ns), short (about 2–5 ns) and long (>8 ns). The areas of the lifetime distribution curves were normalized to unity. For each class, the respective integral (corresponding to αiτi) of the lifetime distribution curves were used to construct DAS. Overlapping lifetime distribution curves were deconvolved to their Gaussian components for analysis.
Construction of time-resolved emission spectra (amplitude and area normalized, TRES and TRANES, respectively)
TRES were constructed from multiexponential decay analysis (36). For TRES, global fitting is not necessary; however, global and nonglobal decay analyses gave similar results. Briefly, the set of intensity decays of ANS fluorescence were normalized so that time-integrated intensity Σαi(λ)τi for exponential decay at each wavelength is equal to the steady-state emission spectrum. Then the family of I(λ, t) functions was used to plot the emission spectra for desired times (36). Constructed spectra at different times were amplitude and area normalized to represent TRES and TRANES, respectively.
Results and Discussion
Steady-State Fluorescence and DAS
ANS fluorescence spectra were obtained in solvents with a range of polarity chosen to encompass the extremes of fluorescence λmax. We explored the possibility that the spectra in different solvents can be characterized by a log-normal function with uniform parameters. Previously, the spectra of an elementary component of Trp fluorescence were characterized by a biparametric (maximum amplitude and position) log-normal function (37). Similarly, ANS fluorescence spectra from both NP and CT states can be described by the log-normal function with the following uniform parameters: λ+ = 107/(0.746.107/λmax + 7006) and λ− = 107/(1.177.107/λmax − 5666).
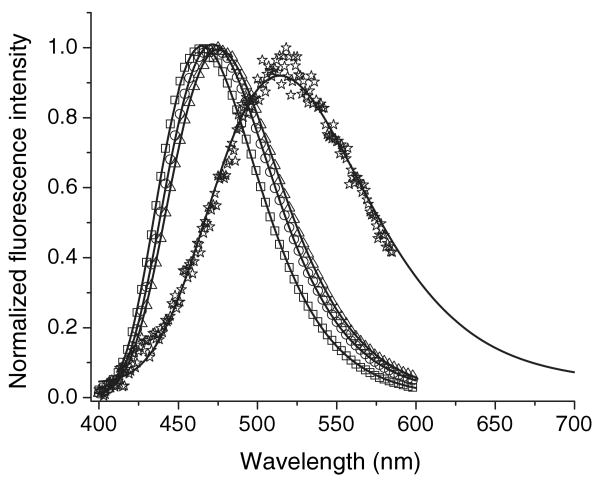
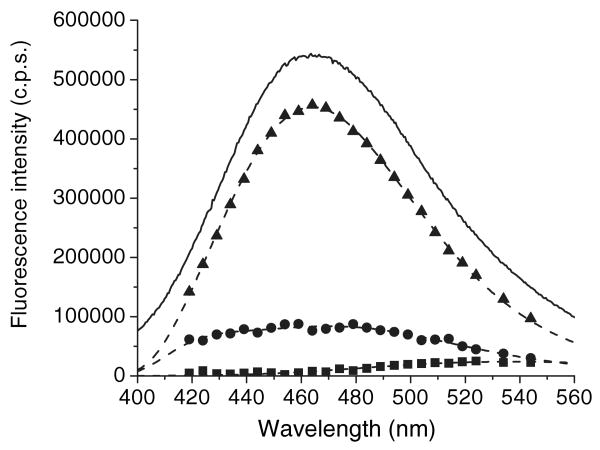
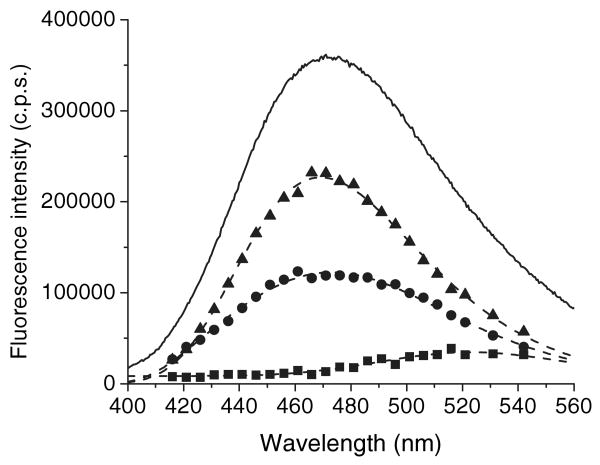
ANS fluorescence spectra in solvents ranging from dioxane to buffer can be satisfactorily fit to a single log-normal component (Fig. 1). However, the spectrum of the ANS–apoWTL complex could not be fit to a single component. Heterogeneity of the fluorescence spectrum might be due to the existence of both internal and external bindings sites in TL, as described for β-lactoglobulin (8,19,20). Both the fluorescence λmax and fractional intensity of components affect the spectral resolution. To resolve fluorescence spectral elements of ANS–TL complexes, we chose the apoG59W mutant because the fluorescence λmax of the ANS–apoG59W complex is significantly red-shifted (9 nm) and has lower fluorescence intensity than that seen with ANS–apoWTL. Characterization by crystal and solution structure have shown that Gly59 is positioned at the open end of the barrel on the C–D loop of TL (38,39). Steady-state fluorescence spectra of ANS–apoWTL (λmax = 463 nm) and ANS–apoG59W (λmax = 472 nm) complexes are shown in Figs. 2 and 3, respectively. The spectra of the ANS–apoG59W and ANS–apoWTL protein complexes could not be fit to a single log-normal component.
Figure 1.
A single log-normal component fitting of the ANS spectra in different solvents. Symbols: square, in dioxane; circle, in ethanol; triangle, in acetonitril; star, in buffer. Solid lines represent log-normal fitting.
Figure 2.
The steady state fluorescence spectra and DAS for the mixture of apo-WTL (5 μm) and ANS (15 μm) constructed from global triple-decay time analysis. Symbols: square, 0.25 ns DAS (λmax∼536 nm); circle, 4.09 ns DAS (broad composite spectrum); triangle, 17.33 ns DAS (λmax∼464 nm). Solid line represents the steady-state fluorescence spectrum (λmax∼463 nm). Dashed lines are log-normal fitting of DAS components.
Figure 3.
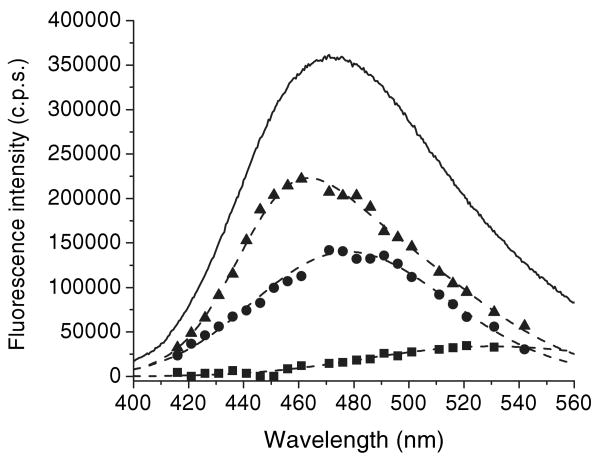
The steady-state fluorescence spectra and DAS for the mixture of apo-G59W (5 μm) and ANS (15 μm) constructed from global triple-decay time analysis. Symbols: square, 0.25 ns DAS (λmax∼523 nm); circle, 4.46 ns DAS (λmax∼472 nm); triangle, 15.82 ns DAS (λmax = 469 ± 0.3 nm). Solid line represents steady-state fluorescence spectrum (λmax∼472 nm). Dashed lines are log-normal fitting of DAS components.
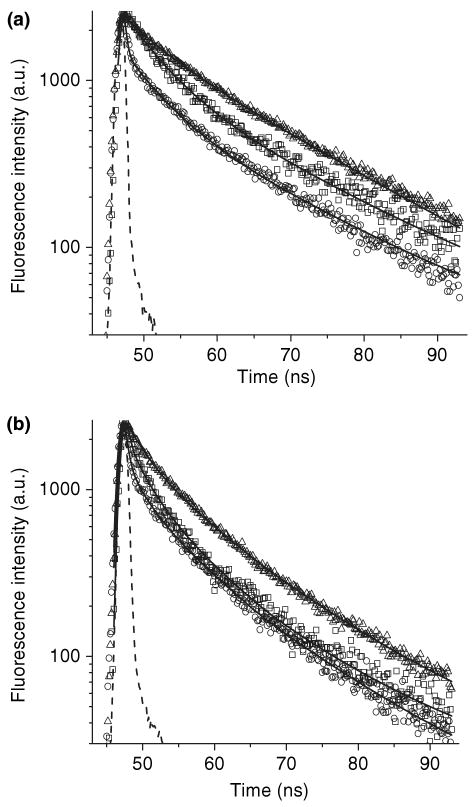
To further discern the multiple components, lifetime measurements were sampled over the range of the entire emission spectra. The fluorescence lifetimes at different wavelengths for both ANS–apoWTL and ANS–apoG59W complexes can be fit by global analysis with three lifetimes (Fig. 4, Tables 1 and 2). DAS for these complexes are derived from lifetime analysis (Figs. 2 and 3). In both complexes, the DAS for the 0.25 ns species is consistent with the steady-state fluorescence spectra of free ANS. The contribution of the relatively short (4.09 and 4.64 ns) and the longer lifetime (17.33 and 15.82 ns) components to steady-state spectra can be compared for ANS–apoWTL versus ANS–apoG59W. At emission λmax the spectral contributions (amplitude) of long-lifetime components to steady-state spectra for ANS–apoWTL and ANS–apoG59W complexes are about 84% and 64%, respectively. The spectrum of long-lifetime species in the ANS–apoG59W complex can be satisfactorily fit to the single log-normal component with λmax = 469.1 ± 0.3 nm showing its homogeneous nature. However, the spectrum of the long-lifetime species in the ANS–apoWTL complex requires at least two log-normal components. If the spectra from the two components are summed, the λmax of the resulting spectrum is about 464 nm (see Fig. S1 for the spectra of the individual components). The spectra of short-lifetime species in both the ANS–apoWTL and ANS–apoG59W complexes are heterogeneous and could not be fit to a single log-normal component. Both spectra were fit with two log-normal components (Fig. S1). Inspection of Figs. 2 and 3 reveals lower steady-state fluorescence intensity for the ANS–apoG59W complex compared with that of ANS–apoWTL. The fluorescent intensity of the short-lifetime component is greater for the ANS–apoG59W complex; the lower steady intensity must be attributed to the contribution of the long-lifetime component. It has been shown (21) that the mutation Gly59 to Trp results in a steeper transition in pH regulated binding of 16-(9-anthroyloxyl) palmitic acid (16AP) to TL. The bulky side chain of Trp at position 59 can restrict flexibility of the CD loop. Both the bulkiness of the side chain and the restricted loop flexibility can alter intracavity ligand binding, in keeping with the assignment of the long-lifetime component to the internal-binding site. The fractional intensity and distribution of the short-lifetime component are not significantly altered by the mutation compared with the long-lifetime component, a finding consistent with unperturbed external binding in both complexes. Similar lifetimes and assignments were made for the ANS–BLG complex. Two lifetimes have been found for fluorescence decay of the ANS–BLG complex; the longer one (∼14 ns) has been ascribed to the internal-binding site and the shorter one (∼3 ns) to the external site (8,19,20).
Figure 4.
Fluorescence intensity decays of apoWTL (5 μm) ANS (15 μm) (a) and apoG59W (5 μm) ANS (15 μm) (b) complexes at various wavelengths. Symbols: (a) square, 419 nm; triangle, 464 nm; circle, 534 nm and (b) square, 416 nm; triangle, 461 nm; circle, 521 nm. Dashed lines are instrument response function. Solid curves represent the global triple-exponential decay fit.
Table 1.
The fluorescence decay parameters for the complex resulting from the mixture of apoWTL (5 μm) and ANS (15 μm).
| Wavelength (nm) | α1 | α2 | α3 | f1 | f2 | f3 | χ2 |
|---|---|---|---|---|---|---|---|
| 419 | 0.48 | 0.34 | 0.19 | 0.02 | 0.30 | 0.68 | 1.0 |
| 424 | 0.63 | 0.21 | 0.16 | 0.03 | 0.23 | 0.74 | 1.2 |
| 429 | 0.37 | 0.35 | 0.28 | 0.01 | 0.23 | 0.76 | 1.0 |
| 434 | 0.30 | 0.36 | 0.34 | 0.01 | 0.20 | 0.80 | 1.1 |
| 439 | 0.35 | 0.32 | 0.32 | 0.01 | 0.19 | 0.80 | 1.0 |
| 444 | 0.45 | 0.24 | 0.30 | 0.01 | 0.16 | 0.83 | 1.0 |
| 449 | 0.36 | 0.29 | 0.35 | 0.01 | 0.16 | 0.83 | 1.1 |
| 454 | 0.14 | 0.39 | 0.47 | 0.01 | 0.16 | 0.83 | 0.9 |
| 459 | 0.33 | 0.30 | 0.36 | 0.01 | 0.16 | 0.83 | 1.1 |
| 464 | 0.45 | 0.23 | 0.32 | 0.01 | 0.14 | 0.85 | 1.0 |
| 469 | 0.43 | 0.25 | 0.33 | 0.01 | 0.15 | 0.84 | 1.1 |
| 474 | 0.56 | 0.19 | 0.24 | 0.02 | 0.15 | 0.82 | 1.1 |
| 479 | 0.49 | 0.24 | 0.27 | 0.02 | 0.17 | 0.81 | 1.3 |
| 484 | 0.59 | 0.19 | 0.22 | 0.03 | 0.17 | 0.81 | 0.9 |
| 489 | 0.66 | 0.16 | 0.18 | 0.03 | 0.17 | 0.80 | 1.1 |
| 494 | 0.70 | 0.14 | 0.15 | 0.04 | 0.17 | 0.79 | 1.3 |
| 499 | 0.73 | 0.13 | 0.14 | 0.05 | 0.18 | 0.78 | 1.2 |
| 504 | 0.77 | 0.11 | 0.12 | 0.06 | 0.17 | 0.77 | 1.0 |
| 509 | 0.79 | 0.11 | 0.10 | 0.07 | 0.19 | 0.74 | 1.3 |
| 514 | 0.79 | 0.12 | 0.09 | 0.07 | 0.21 | 0.72 | 1.1 |
| 519 | 0.83 | 0.09 | 0.08 | 0.09 | 0.19 | 0.72 | 1.1 |
| 524 | 0.86 | 0.08 | 0.07 | 0.10 | 0.19 | 0.71 | 1.2 |
| 534 | 0.87 | 0.07 | 0.06 | 0.12 | 0.20 | 0.68 | 0.9 |
| 544 | 0.90 | 0.06 | 0.04 | 0.15 | 0.20 | 0.65 | 1.0 |
Global triple-decay time was analyzed at different wavelengths. τ1 = 0.25 ns*, τ2 = 4.09 ns, τ3 = 17.33 ns. *was fixed in fluorescence decay analysis.
Table 2.
The fluorescence decay parameters for the complex resulting from the mixture of apoG59W (5 μm) and ANS (15 μm).
| Wavelength (nm) | α1 | α2 | α3 | f1 | f2 | f3 | χ2 |
|---|---|---|---|---|---|---|---|
| 416 | 0.81 | 0.15 | 0.04 | 0.13 | 0.44 | 0.43 | 1.4 |
| 421 | 0.72 | 0.22 | 0.06 | 0.08 | 0.47 | 0.44 | 1.9 |
| 426 | 0.67 | 0.24 | 0.09 | 0.06 | 0.42 | 0.52 | 1.6 |
| 431 | 0.69 | 0.22 | 0.09 | 0.06 | 0.39 | 0.55 | 2.2 |
| 436 | 0.65 | 0.24 | 0.11 | 0.05 | 0.36 | 0.59 | 1.6 |
| 441 | 0.62 | 0.26 | 0.12 | 0.04 | 0.36 | 0.60 | 1.4 |
| 446 | 0.56 | 0.30 | 0.14 | 0.03 | 0.35 | 0.62 | 1.3 |
| 451 | 0.54 | 0.31 | 0.15 | 0.03 | 0.36 | 0.61 | 1.7 |
| 456 | 0.55 | 0.30 | 0.15 | 0.03 | 0.35 | 0.62 | 1.1 |
| 461 | 0.60 | 0.27 | 0.13 | 0.04 | 0.36 | 0.60 | 1.2 |
| 466 | 0.51 | 0.31 | 0.18 | 0.03 | 0.32 | 0.65 | 1.1 |
| 471 | 0.57 | 0.28 | 0.15 | 0.04 | 0.33 | 0.63 | 1.4 |
| 476 | 0.65 | 0.23 | 0.12 | 0.05 | 0.33 | 0.62 | 1.5 |
| 481 | 0.65 | 0.23 | 0.12 | 0.05 | 0.33 | 0.62 | 1.1 |
| 486 | 0.73 | 0.18 | 0.09 | 0.07 | 0.34 | 0.59 | 1 |
| 491 | 0.76 | 0.16 | 0.08 | 0.08 | 0.34 | 0.58 | 1.1 |
| 496 | 0.71 | 0.20 | 0.09 | 0.07 | 0.36 | 0.57 | 1.4 |
| 501 | 0.80 | 0.14 | 0.06 | 0.10 | 0.35 | 0.55 | 1.1 |
| 506 | 0.82 | 0.13 | 0.05 | 0.12 | 0.36 | 0.52 | 1.8 |
| 511 | 0.83 | 0.12 | 0.05 | 0.13 | 0.36 | 0.51 | 1.6 |
| 516 | 0.87 | 0.09 | 0.04 | 0.18 | 0.34 | 0.48 | 1.3 |
| 521 | 0.86 | 0.10 | 0.04 | 0.16 | 0.34 | 0.50 | 1.2 |
Global triple-decay time was analyzed at different wavelengths. τ1 = 0.25 ns*, τ2 = 4.46 ns, τ3 = 15.82 ns. *was fixed in fluorescence decay analysis.
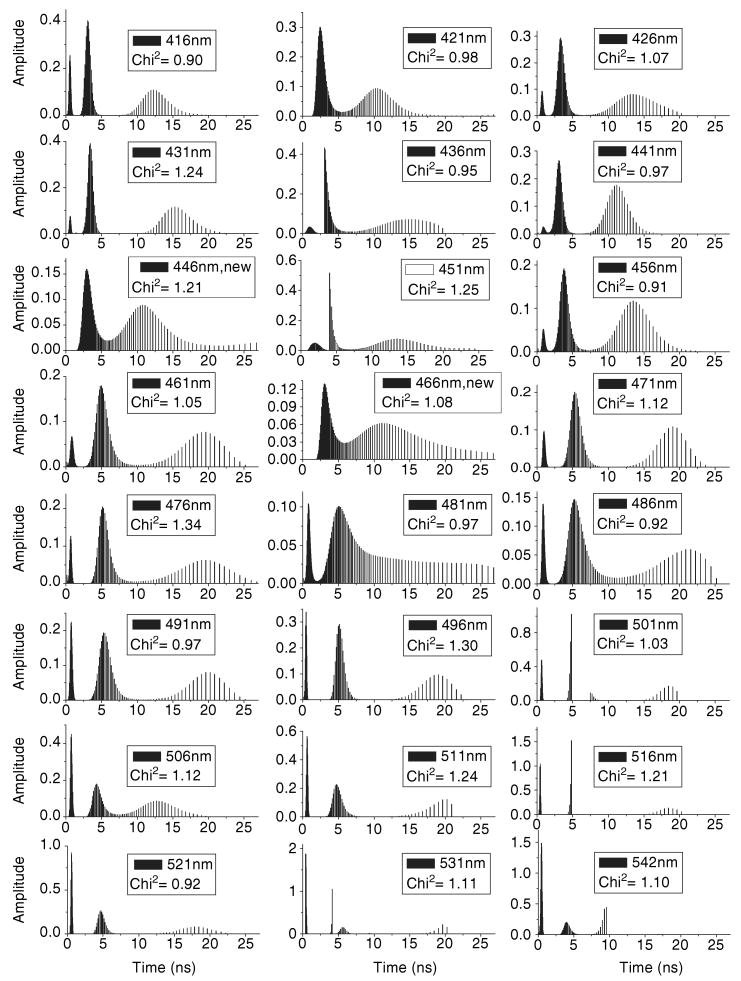
The fluorescence lifetimes of the ANS–apoG59W complex were also analyzed throughout the spectral range by the model-free MEM method (Fig. 5 and Fig. S2). In MEM analyses fluorescence lifetime components can be grouped to three classes (<1 ns, ∼2–5 ns and >8 ns), which justify the assignment of three lifetimes for the exponential decay analyses. The intensity of contribution of these components to total lifetimes and therefore the constructed DAS spectra qualitatively concurs with three exponential analyses (Figs. 4–6). For the short 2–5 ns component, the constructed DAS spectra are almost identical between the exponential decay and the model-free MEM methods. However, there are slight differences for the long-lifetime component; the constructed MEM spectrum appears slightly blue-shifted. The presence of multiple lifetime components may be explained by differences in the binding mode of ANS to G59W but may also be due to solvent relaxation. To consider this possibility, we examined the average lifetimes across the emission spectra in both models (Figs. 7 and 8).
Figure 5.
The lifetime distributions for the mixture of apo-G59W (5 μm) and ANS (15 μm) at different emission wavelengths by MEM decay analysis.
Figure 6.
The steady-state fluorescence spectra and DAS for the mixture of apo-G59W (5 μm) and ANS (15 μm) constructed from MEM analysis. Symbols: square, <1 ns DAS (λmax∼535 nm); circle, 2–5 ns DAS (λmax∼478 nm); triangle, >8 ns DAS (λmax∼465 nm). Solid line represents steady-state fluorescence spectrum (λmax∼472 nm). Dashed lines are log-normal fitting of DAS components.
Figure 7.
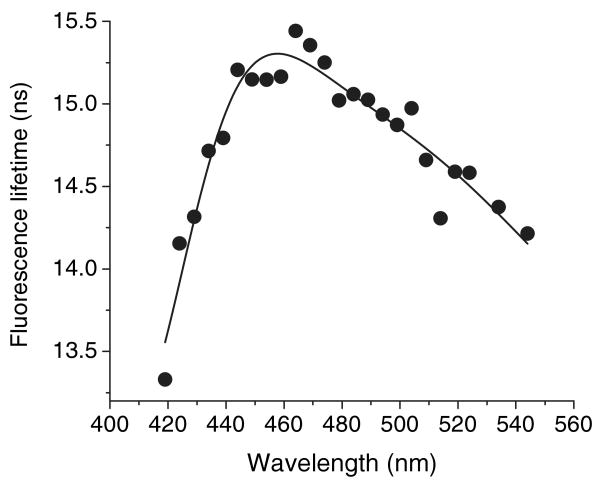
The average lifetimes of the fluorescence for the mixture of apo-G59W (5 μm) and ANS (15 μm) at different wavelengths from triple exponential decay analysis. Free ANS (0.25 ns) is excluded from the calculation of τaver.
Figure 8.
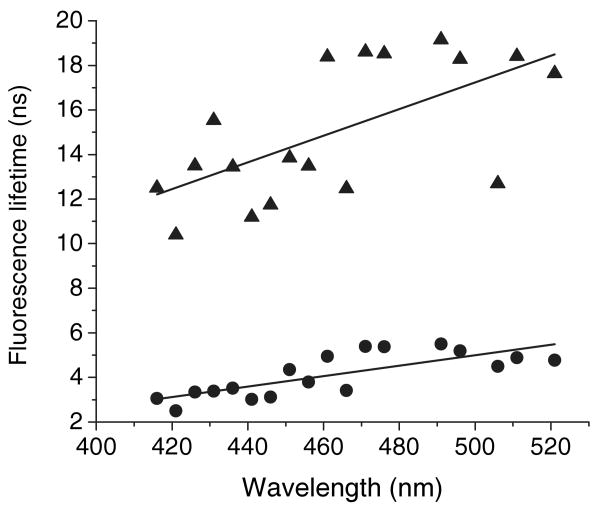
The average lifetimes (the long- and short-lifetime components) of fluorescence for the mixture of apo-G59W (5 μm) and ANS (15 μm) at different wavelengths from MEM decay analysis. Symbols: triangle, long-lifetime component; circle, short-lifetime component.
The MEM analysis provides a model in which the lifetime components are not fixed, permitting us to separately analyze average lifetime components within the species over the entire emission spectrum of G59W. Both average lifetimes (the long- and short-lifetime components) of fluorescence increase slightly in the red region, suggesting solvent relaxation may have a role (Fig. 8). Since the lifetimes from the MEM analysis can be grouped into three species, similar results could be deduced from the nonglobal triple-exponential model. One can fix the free ANS lifetime and vary the other two lifetimes. As the decay curves across the emission spectrum could satisfactorily fit the triple-exponential global analysis, goodness of the fit for the nonglobal analysis is expected to be better. However, the MEM method is a better choice because in MEM analysis for each decay, a series of 200 exponentials were tested and every point represents the average lifetime of respective lifetime region. In the global exponential analysis, average lifetime decrease in the red spectra region, precluding any conclusion about solvent relaxation (Fig. 7). This apparent discrepancy might be ascribed to the fact that in the global exponential analysis lifetime components are fixed and the average lifetime is obtained by averaging the fractional intensities of both the long- and short-lifetime components. All tested models give similar chi-squared values for analysis of the decay curves. This precludes an unambiguous choice for just one of these models. However, the overall analysis of the data clearly indicates that ANS binding is heterogeneous with two separate lifetime components.
Time-Resolved Emission Spectra
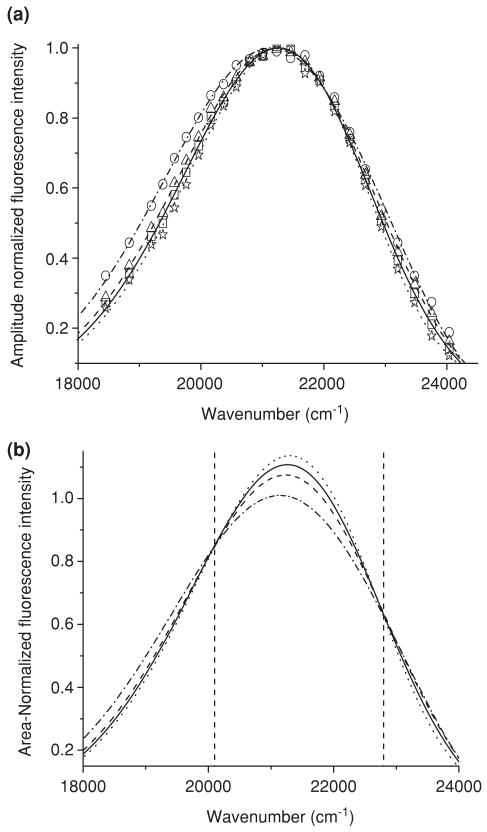
Time-resolved emission spectra were performed to determine if solvent relaxation was present in the ANS–apoWTL and ANS–apoG59W complexes. In solvent relaxation, a red-shift of the spectrum is expected during the lifetime of the chromophore (ANS). However, no red-shift is observed in either of the complexes (Figs. 9a and 10a). Time-resolved emission spectra (TRES) of ANS with apoTL and apoW59 show a time-dependent decrease of spectral width (FWHM). These findings are quite consistent with results from DAS analysis. In both complexes, the short-lifetime component has a greater width than the long-lifetime component (Figs. 2 and 3). Therefore, in both complexes, much faster decay of the short-lifetime species results in the time-dependent decrease of the spectral width (Figs. 9 and 10). While the spectra of the long-lifetime component can be explicitly assigned to ANS bound to the internal-binding site of TL, the origin of the short-lifetime component is more complicated. The value of 2–5 ns for the short-lifetime component could justify the assignment of this component to the CT state, i.e. ANS fluorescence from a polar environment that is exposed to solvent. However, the broad spectrum of the short-lifetime component has an emission λmax that is similar to that of the long-lifetime component. This spectrum is heterogeneous and could not be fit to a single log-normal component (see Fig. S1). The similar broad (λmax∼460 nm) and blue-shifted (λmax∼442 nm) spectra for the short-lifetime component of ANS fluorescence were observed for ANS–apomyoglobin complex (40). The short-lifetime component with a red-shifted emission can be accounted for by the emission from the CT state. This notion is consistent with ANS bound to the polar external-binding site that is accessible to water molecules. However, the short-lifetime component with blue-shifted emission cannot be explained by the CT state. The origin of this emission can be the prerelaxed NP state of ANS. Usually, a short-lifetime component with blue-shifted emission indicates that an excited-state reaction occurs during the lifetime of a fluorophore (36). The definite indicators of an excited-state reaction are negative pre-exponential values that were not observed for ANS–TL complexes. However, the absence of negative pre-exponential factors in decay analysis can be related to spectral overlap (36). In proteins, solvent relaxation processes are observed in time frames of 8–150 ps (relaxation of the bulk and the protein-associated water) and about 10 ns (reorientation of the entire protein molecule) (41). Since the short-lifetime component with red-shifted emission is attributed to the external-binding site, one would expect the solvent relaxation to occur with picoseconds for these species. The picoseconds range is beyond resolution of our instrument. The existence of 10 ns range relaxation time cannot be excluded from our results.
Figure 9.
The constructed TRES (a) and TRANES (b) for the mixture of apoG59W (5 μm) and ANS (15 μm) at various time delays. Symbols: dash dot line and circle, 1 ns; dash line and triangle, 5 ns; solid line and square, 10 ns; dot line and star, 20 ns. Symbols are not shown in (b). TRANES show two isoemissive points, 497 nm and 438.6 nm (left and right dashed vertical lines, respectively). The spectra are shown in the wave number scale to be consistent with the literature.
Figure 10.
The constructed TRES (a) and TRANES (b) for the mixture of apo-WTL (5 μm) and ANS (15 μm). Symbols: dash dot line and circle, 1 ns; dash line and triangle, 5 ns; solid line and square, 10 ns; dot line and star, 20 ns. Symbols are not shown in (b). TRANES show two isoemissive points, 500.5 and 436.7 nm (left and right dashed vertical lines, respectively). The spectra are shown in wave number scale to be consistent with the literature.
The fluorescence lifetime of ANS, bound to an external-binding site, is 2–5 ns. This value is significantly higher than fluorescence lifetime of ANS in water (0.25 ns). The red-shifted short-lifetime (2–5 ns) component may be related to the electrostatic interaction of the sulfonate group of ANS with the positively charged side chain of TL. It is well established that the short lifetime for CT state in aqueous solvent is the result of intermolecular CT from this state to solvent (42), which is improbable in nonaqueous solvent. The sulfonate group of ANS plays a critical role in the intermolecular CT process. N-phenyl-1-naphthylamine (1NPN) is similar to the ANS molecule but lacks the charged sulfonate group. As a result, the intermolecular CT rate constant for the CT state of 1NPN in water is smaller by a factor of ∼10 than that of ANS. The lifetime increases from 0.25 ns (ANS) to 2.5 ns (1NPN) (43). The significance of the sulfonate group in determining the fluorescence parameter was previously recognized by comparison of ANS fluorescence to that of N-phenyl-2-naphthylamine (16).
In the external-binding site, that is a solvent exposed site, one could expect a high rate for intermolecular CT. However, the interaction of ANS and its derivatives with positively charged amino acids and polyamino acids reveals that ion pairing between Arg (or Lys) and the sulfonate group of ANS reduce the intermolecular CT rate constant that leads to increase of fluorescence intensity and lifetime (43). In addition, a positive charge near the -NH group of ANS changes the intramolecular CT process producing a blue-shift of fluorescence (43).
On the other hand, the effectiveness of the intermolecular CT in aqueous solution is attributed to the fast reorientation rate of water molecules in the vicinity of ANS (16). Near the protein surface, the reorientation dynamics of water molecules, that are equivalent to cluster formation dynamics, are decreased compared with that in the bulk. A (H2O)4±1 cluster, rather than a single molecule of water, was found to be the effective charge acceptor (15,16). Therefore, the decrease of the intermolecular CT rate and, as a result, increase of fluorescence intensity and lifetime will be observed for ANS bound to the protein surface. This mechanism contributes to the fluorescence enhancement of ANS bound to the protein surface in addition to that observed from the ion pairing interaction. The short-fluorescence lifetimes for ANS–TL complexes (2–5 ns) are comparable with the fluorescence lifetime of ANS bound to poly-Arg (1.8–2.4 ns) (43). Therefore, it is plausible to conclude that an electrostatic interaction is a dominant feature for the ANS external-binding sites with short lifetimes. TL has seven Arg and 11 Lys residues (27). The end result of these interactions is that the environment of the external-binding site of ANS can create a broad distribution of lifetimes and energy levels of CT state.
It is interesting to note that the ANS–apoWTL complex, unlike the ANS–apoG59W, exhibits the hypsochromic log-normal component for the long-lifetime species (Fig. S1). This species can be attributed to the NP state of ANS for which the excited-state relaxation time is much longer than fluorescence lifetime. This result is consistent with at least two ground state populations for intracavitary ANS–apoWTL complexes. This finding is in accord with the bifurcated shape of the TL cavity. Two positively charged residues were located inside of the cavity (38,39). The mutation at Gly59 alters the population of intracavitary complexes of ANS with TL.
TRANES is a useful method to identify emissive species through the observation of the isoemissive points (44). For both complexes, there are two concise isoemissive points (Figs. 9b and 10b) corroborating that the two-mode binding is appropriate for ANS–TL interaction.
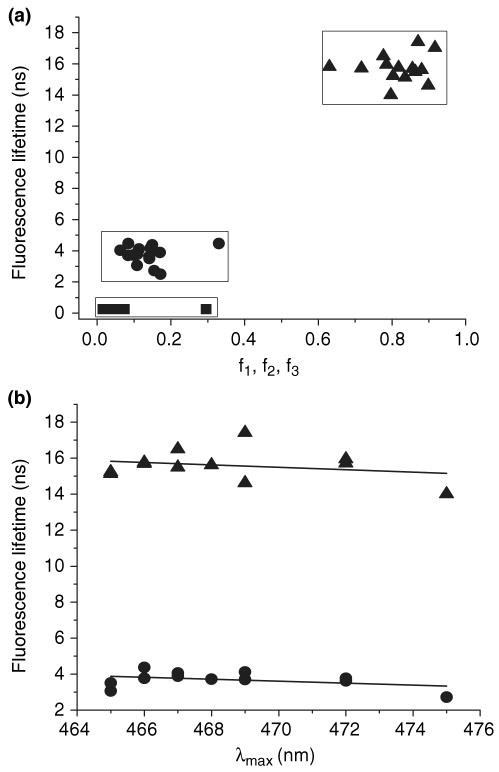
Since the two lifetime components are not due to solvent relaxation, it is reasonable to presume that the two species represent different binding modes. The longer lifetime reflects binding within the cavity and the shorter lifetime represents binding external to the cavity. Electrostatic-binding mechanisms have been proposed for both intracavitary and external-binding sites with ANS for some proteins (4–8). The effect of point mutations on the fluorescence lifetime components of ANS–TL complexes was explored. Twelve mutants from different β-strands and A–B loop (E34W) were chosen because their side chains are oriented inside of the cavity. The two mutants with exposed side chains, G47W (exposed B–C loop) and E104W (exposed site of G strand), were chosen as controls. Lifetime analyses of fluorescent decay for all mutant TL-ANS complexes are shown in Table 3 and Fig. 11a. The lifetime components segregate into two groups, short and long lifetimes, with similar fractional contributions to the steady-state spectrum in the members of each group. The relationship between the fluorescent lifetime and the steady-state emission maximum is informative as to the impact of the mutations at various positions. It is evident that the lifetimes for both the long- and short-lifetime components decrease very weakly with the increase of the ANS fluorescence λmax (Fig. 11b).
Table 3.
The fluorescence decay parameters for the complexes resulting from the mixture of TL mutants (5 μm) and ANS (15 μm).
| α1 | α2 | α3 | τ1 (ns)* | τ2 (ns) | τ3 (ns) | λmax (nm) | f1 | f2 | f3 | χ2 | |
|---|---|---|---|---|---|---|---|---|---|---|---|
| E34W | 0.72 | 0.11 | 0.17 | 0.25 | 3.06 | 15.14 | 465 | 0.06 | 0.11 | 0.83 | 1.1 |
| M39W | 0.62 | 0.15 | 0.23 | 0.25 | 4.37 | 15.77 | 466 | 0.03 | 0.15 | 0.82 | 1.1 |
| G47W | 0.55 | 0.14 | 0.31 | 0.25 | 3.72 | 15.62 | 468 | 0.02 | 0.10 | 0.88 | 1.1 |
| M55W | 0.71 | 0.13 | 0.16 | 0.25 | 3.50 | 15.24 | 465 | 0.06 | 0.14 | 0.80 | 1.1 |
| A66W | 0.78 | 0.10 | 0.12 | 0.25 | 3.62 | 15.95 | 472 | 0.07 | 0.14 | 0.79 | 1.1 |
| H84W | 0.75 | 0.14 | 0.11 | 0.25 | 3.77 | 15.72 | 472 | 0.07 | 0.21 | 0.72 | 1.0 |
| I88W | 0.71 | 0.14 | 0.15 | 0.25 | 3.88 | 16.51 | 467 | 0.05 | 0.17 | 0.78 | 1.1 |
| F99W | 0.54 | 0.15 | 0.31 | 0.25 | 4.06 | 15.50 | 467 | 0.03 | 0.11 | 0.86 | 1.0 |
| C101W | 0.47 | 0.14 | 0.39 | 0.25 | 3.70 | 14.62 | 469 | 0.02 | 0.08 | 0.90 | 1.0 |
| G103W | 0.64 | 0.18 | 0.18 | 0.25 | 2.72 | 14.01 | 475 | 0.05 | 0.15 | 0.80 | 1.1 |
| E104W | 0.64 | 0.12 | 0.24 | 0.25 | 3.77 | 15.70 | 466 | 0.03 | 0.11 | 0.86 | 1.0 |
| L105W | 0.46 | 0.19 | 0.35 | 0.25 | 4.12 | 17.42 | 469 | 0.02 | 0.11 | 0.87 | 1.2 |
The measurements were conducted at emission λmax for each complex.
was fixed in fluorescence decay analysis.
Figure 11.
The correlation of fluorescence lifetimes for mutant TL (5 μm) ANS (15 μm) complexes with fractional intensities (a) and λmax (b). Symbols: triangle, circle and square represents long, short and free ANS lifetime components.
The point mutations result in the distribution of the ANS emission maximum within a range of 465–475 nm, while the long and short lifetimes fall in to the range of 14.01–17.42 ns and 2.72–4.37 ns, respectively. The role of the specific interaction of ANS with TL will be the subject of future study.
Because both TL and β-lactoglobulin have heterogeneity of fluorescent ANS lifetimes, it seems quite likely that other lipocalins and ligand-binding proteins will exhibit a similar pattern. Data presuming that ANS–protein interactions are purely hydrophobic must be interpreted with caution in light of the likely presence of multiple-binding sites and electrostatic interactions in many lipid-binding proteins. Elucidation of the precise binding mechanisms for each protein will aid past and future studies using ANS.
Supplementary Material
Acknowledgments
This work was supported by U.S. Public Health Service Grants NIH EY-11224 and EY00331 as well as the Edith and Lew Wasserman Endowed Professorship in Ophthalmology.
Footnotes
The following supplemental materials are available for this article:
Figure S1. A long-normal fitting of the DAS components for apoWTL-ANS (lane A) and apoG59W-ANS (lane B) complexes.
Figure S2. The fluorescence decay analysis for the mixture of apo-WTL (5 μm) and ANS (15 μm) by MEM method.
This material is available as part of the online article from: http://www.blackwell-synergy.com/doi/full/10.1111/j.1751-1097.2007.00180.x
Please note: Blackwell Publishing is not responsible for the content or functionality of any supplementary materials supplied by the authors. Any queries (other than missing material) should be directed to the corresponding author for the article.
References
- 1.Son DS, Hariya S, Shimoda M, Kokue E. Contribution of alpha 1-acid glycoprotein to plasma protein binding of some basic antimicrobials in pigs. J Vet Pharmacol Ther. 1996;19:176–183. doi: 10.1111/j.1365-2885.1996.tb00036.x. [DOI] [PubMed] [Google Scholar]
- 2.Uversky VN, Winter S, Lober G. Use of fluorescence decay times of 8-ANS-protein complexes to study the conformational transitions in proteins which unfold through the molten globule state. Biophys Chem. 1996;60:79–88. doi: 10.1016/0301-4622(96)00009-9. [DOI] [PubMed] [Google Scholar]
- 3.Semisotnov GV, Rodionova NA, Razgulyaev OI, Uversky VN, Gripas AF, Gilmanshin RI. Study of the “molten globule” intermediate state in protein folding by a hydrophobic fluorescent probe. Biopolymers. 1991;31:119–128. doi: 10.1002/bip.360310111. [DOI] [PubMed] [Google Scholar]
- 4.Matulis D, Lovrien R. 1-Anilino-8-naphthalene sulfonate anion-protein binding depends primarily on ion pair formation. Biophys J. 1998;74:422–429. doi: 10.1016/S0006-3495(98)77799-9. [DOI] [PMC free article] [PubMed] [Google Scholar]
- 5.Ory JJ, Banaszak LJ. Studies of the ligand binding reaction of adipocyte lipid binding protein using the fluorescent probe 1, 8-anilinonaphthalene-8-sulfonate. Biophys J. 1999;77:1107–1116. doi: 10.1016/S0006-3495(99)76961-4. [DOI] [PMC free article] [PubMed] [Google Scholar]
- 6.Lartigue A, Gruez A, Spinelli S, Riviere S, Brossut R, Tegoni M, Cambillau C. The crystal structure of a cockroach pheromone-binding protein suggests a new ligand binding and release mechanism. J Biol Chem. 2003;278:30213–30218. doi: 10.1074/jbc.M304688200. [DOI] [PubMed] [Google Scholar]
- 7.Schonbrunn E, Eschenburg S, Luger K, Kabsch W, Amrhein N. Structural basis for the interaction of the fluorescence probe 8-anilino-1-naphthalene sulfonate (ANS) with the antibiotic target MurA. Proc Natl Acad Sci USA. 2000;97:6345–6349. doi: 10.1073/pnas.120120397. [DOI] [PMC free article] [PubMed] [Google Scholar]
- 8.Collini M, D'Alfonso L, Molinari H, Ragona L, Catalano M, Baldini G. Competitive binding of fatty acids and the fluorescent probe 1-8-anilinonaphthalene sulfonate to bovine beta-lactoglobulin. Protein Sci. 2003;12:1596–1603. doi: 10.1110/ps.0304403. [DOI] [PMC free article] [PubMed] [Google Scholar]
- 9.Breustedt DA, Schonfeld DL, Skerra A. Comparative ligand-binding analysis of ten human lipocalins. Biochim Biophys Acta. 2006;1764:161–173. doi: 10.1016/j.bbapap.2005.12.006. [DOI] [PubMed] [Google Scholar]
- 10.Essassi D, Zini R, Tillement JP. Use of 1-anilino-8-naphthalene sulfonate as a fluorescent probe in the investigation of drug interactions with human alpha-1-acid glycoprotein and serum albumin. J Pharm Sci. 1990;79:9–13. doi: 10.1002/jps.2600790104. [DOI] [PubMed] [Google Scholar]
- 11.Flower DR. The lipocalin protein family: Structure and function. Biochem J. 1996;318(Pt. 1):1–14. doi: 10.1042/bj3180001. [DOI] [PMC free article] [PubMed] [Google Scholar]
- 12.Kosower EM, Kanety H. Intramolecular donor-acceptor systems. 10. Multiple fluorescence from 8-(phenylamino)-1-naphthalenesulfonates. J Am Chem Soc. 1983;105:6236–6243. [Google Scholar]
- 13.Kosower EM. Excited state electron and proton transfers. Ann Rev Phys Chem. 1986;37:127–156. [Google Scholar]
- 14.Kenney-Wallace GA, Jonah CD. Picosecond molecular relaxations during electron solvation in liquid alcohol and alcohol-alkane solutions. Chem Phys Lett. 1976;39:596–600. [Google Scholar]
- 15.Moore RA, Lee J, Robinson GW. Hydration dynamics of electrons from a fluorescent probe molecule. J Phys Chem. 1985;89:3648–3654. [Google Scholar]
- 16.Lee J, Robinson GW. Electron hydration dynamics using the 2-anilinonaphthalene precursor. J Am Chem Soc. 1985;107:6153–6156. [Google Scholar]
- 17.Upadhyay A, Bhatt T, Tripathi HB, Pant DD. Photophysics of 8-anilinonaphthalene-1-sulfonate. J Photochem Photobiol A Chem. 1995;89:201–207. [Google Scholar]
- 18.Lobel D, Marchese S, Krieger J, Pelosi P, Breer H. Subtypes of odorant-binding proteins-heterologous expression and ligand binding. Eur J Biochem. 1998;254:318–324. doi: 10.1046/j.1432-1327.1998.2540318.x. [DOI] [PubMed] [Google Scholar]
- 19.Collini M, D'Alfonso L, Baldini G. New insight on beta-lactoglobulin binding sites by 1-anilinonaphthalene-8-sulfonate fluorescence decay. Protein Sci. 2000;9:1968–1974. doi: 10.1110/ps.9.10.1968. [DOI] [PMC free article] [PubMed] [Google Scholar]
- 20.D'Alfonso L, Collini M, Baldini G. Evidence of heterogeneous 1-anilinonaphthalene-8-sulfonate binding to beta-lactoglobulin from fluorescence spectroscopy. Biochim Biophys Acta. 1999;1432:194–202. doi: 10.1016/s0167-4838(99)00105-3. [DOI] [PubMed] [Google Scholar]
- 21.Gasymov OK, Abduragimov AR, Yusifov TN, Glasgow BJ. Interstrand loops CD and EF act as pH-dependent gates to regulate fatty acid ligand binding in tear lipocalin. Biochemistry. 2004;43:12894–12904. doi: 10.1021/bi049076o. [DOI] [PubMed] [Google Scholar]
- 22.Gasymov OK, Abduragimov AR, Yusifov TN, Glasgow BJ. Structural changes in human tear lipocalins associated with lipid binding. Biochim Biophys Acta. 1998;1386:145–156. doi: 10.1016/s0167-4838(98)00092-2. [DOI] [PubMed] [Google Scholar]
- 23.Lange DC, Kothari R, Patel RC, Patel SC. Retinol and retinoic acid bind to a surface cleft in bovine beta-lactoglobulin: A method of binding site determination using fluorescence resonance energy transfer. Biophys Chem. 1998;74:45–51. doi: 10.1016/s0301-4622(98)00164-1. [DOI] [PubMed] [Google Scholar]
- 24.Greene LH, Wijesinha-Bettoni R, Redfield C. Characterization of the molten globule of human serum retinol-binding protein using NMR spectroscopy. Biochemistry. 2006;45:9475–9484. doi: 10.1021/bi060229c. [DOI] [PubMed] [Google Scholar]
- 25.Bychkova VE, Berni R, Rossi GL, Kutyshenko VP, Ptitsyn OB. Retinol-binding protein is in the molten globule state at low pH. Biochemistry. 1992;31:7566–7571. doi: 10.1021/bi00148a018. [DOI] [PubMed] [Google Scholar]
- 26.Glasgow BJ, Heinzmann C, Kojis T, Sparkes RS, Mohandas T, Bateman JB. Assignment of tear lipocalin gene to human chromosome 9q34-9qter. Curr Eye Res. 1993;12:1019–1023. doi: 10.3109/02713689309029229. [DOI] [PubMed] [Google Scholar]
- 27.Redl B, Holzfeind P, Lottspeich F. cDNA cloning and sequencing reveals human tear prealbumin to be a member of the lipophilic-ligand carrier protein superfamily. J Biol Chem. 1992;267:20282–20287. [PubMed] [Google Scholar]
- 28.Glasgow BJ. Tissue expression of lipocalins in human lacrimal and von Ebner's glands: Colocalization with lysozyme. Graefes Arch Clin Exp Ophthalmol. 1995;233:513–522. doi: 10.1007/BF00183433. [DOI] [PubMed] [Google Scholar]
- 29.Cormack B. Current Protocol in Molecular Biology. Greene Pub. Associates and Wiley-Interscience; New York: 1987. [Google Scholar]
- 30.Gasymov OK, Abduragimov AR, Yusifov TN, Glasgow BJ. Binding studies of tear lipocalin: The role of the conserved tryptophan in maintaining structure, stability and ligand affinity. Biochim Biophys Acta. 1999;1433:307–320. doi: 10.1016/s0167-4838(99)00133-8. [DOI] [PubMed] [Google Scholar]
- 31.Marston FAO. DNA Cloning. IRL Press; Oxford, England: 1987. A Practical Approach. [Google Scholar]
- 32.Glasgow BJ, Abduragimov AR, Farahbakhsh ZT, Faull KF, Hubbell WL. Tear lipocalins bind a broad array of lipid ligands. Curr Eye Res. 1995;14:363–372. doi: 10.3109/02713689508999934. [DOI] [PubMed] [Google Scholar]
- 33.Bozimowski D, Artiss JD, Zak B. The variable reagent blank: Protein determination as a model. J Clin Chem Clin Biochem. 1985;23:683–689. doi: 10.1515/cclm.1985.23.10.683. [DOI] [PubMed] [Google Scholar]
- 34.Skilling J, Bryan RK. Maximum entropy image reconstruction: General algorithm. Mon Not R Astron Soc. 1984;211:111–124. [Google Scholar]
- 35.Livesey AK, Brochon JC. Analyzing the distribution of decay constants in pulse-fluorimetry using the maximum entropy method. Biophys J. 1987;52:693–706. doi: 10.1016/S0006-3495(87)83264-2. [DOI] [PMC free article] [PubMed] [Google Scholar]
- 36.Lakowicz JR. Principles of Fluorescence Spectroscopy. Plenum Press; New York: 1999. [Google Scholar]
- 37.Burstein EA, Emelyanenko VI. Log-normal description of fluorescence spectra of organic fluorophores. Photochem Photobiol. 1996;64:316–320. [Google Scholar]
- 38.Gasymov OK, Abduragimov AR, Yusifov TN, Glasgow BJ. Site-directed tryptophan fluorescence reveals the solution structure of tear lipocalin: Evidence for features that confer promiscuity in ligand binding. Biochemistry. 2001;40:14754–14762. doi: 10.1021/bi0110342. [DOI] [PubMed] [Google Scholar]
- 39.Breustedt DA, Korndorfer IP, Redl B, Skerra A. The 1.8-A crystal structure of human tear lipocalin reveals an extended branched cavity with capacity for multiple ligands. J Biol Chem. 2005;280:484–493. doi: 10.1074/jbc.M410466200. [DOI] [PubMed] [Google Scholar]
- 40.Wang G, Gao Y, Geng ML. Analysis of heterogeneous fluorescence decays in proteins. Using fluorescence lifetime of 8-anilino-1-naphthalenesulfonate to probe apomyoglobin unfolding at equilibrium. Biochim Biophys Acta. 2006;1760:1125–1137. doi: 10.1016/j.bbagen.2006.02.019. [DOI] [PubMed] [Google Scholar]
- 41.Grant EH, Sheppard RJ, South GP. Dielectric Behavior of Biological Molecules in Solutions. Oxford University Press; Oxford: 1978. [Google Scholar]
- 42.Fleming GR, Porter G, Robbins RJ, Synowiec JA. Excited singlet state decay pathways in the fluorescence probe molecule 1,8-anilinonaphthalene sulphonate (ANS) Chem Phys Lett. 1977;52:228–232. [Google Scholar]
- 43.Gasymov OK, Glasgow BJ. ANS fluorescence: Potential to augment the identification of the external binding sites of proteins. BBA-Proteins Proteomics. 2007;1774:403–411. doi: 10.1016/j.bbapap.2007.01.002. [DOI] [PMC free article] [PubMed] [Google Scholar]
- 44.Koti ASR, Krishna MMG, Periasamy N. Time-resolved area-normalized emission spectroscopy (TRANES): A novel method for confirming emission from two excited states. J Phys Chem A. 2001;105:1767–1771. [Google Scholar]
Associated Data
This section collects any data citations, data availability statements, or supplementary materials included in this article.


