

Abstract
We present results of theoretical studies of the variants of the monomeric teal fluorescent protein from Clavularia coral (mTFP1) which present promising members from the GFP family. Predictions of quantum chemical approaches including density functional theory and semiempirical approximations are presented for the model systems which mimic the chromophores in different environments. We describe the excitation energy spectrum of the cyan mTFP1 fluorescent protein with the original chromophore and with chromophore mutants Tyr67His and Tyr67Trp.
Introduction
Green fluorescent proteins (GFP) are being widely utilized in biology and medicine. Since the chromophore is formed without a cofactor, a GFP can be used in vivo. Recently, a significant effort is being expended to engineer new fluorescent proteins (FPs) with improved efficiency [1-3]. One of the goals is to expand the range of color palette by modifying either the immediate vicinity of the GFP chromophore or the chromophore group itself. Modern computational approaches based on quantum mechanical methods to characterize structures and optical spectra of biological chromophores inside protein matrices provide important support to experimental studies [4].
In this work we concentrate on theoretical characterization of the variants of the monomeric teal fluorescent protein from Clavularia coral (mTFP1) which present promising members from the GFP family, being uniquely bright and photostable species [5-7]. The high quantum yield of mTFP1 (0.85) makes it particularly suitable as a FRET (fluorescence resonance energy transfer) donor to either a yellow or orange FP acceptors with wavelengths 510-580 nm. Beyond the variant with the usual GFP-type chromophore on the base of the 4-(p-hydroxybenzylidene)-imidazoline molecule (Fig.1a) which is formed in nature from the amino-acid residues Ser66, Tyr67, Gly68 inside the protein globule, the Tyr67His and Tyr67Trp mutants of mTFP1 have been considered [7] giving rise to the series of chromophores shown in Fig.1b,c. Experimental studies for these engineered proteins in which the Tyr67 part of the chromophore was mutated by His and Trp [7] showed that all these versions retained their blue-shifted emission relative to the enhanced GFP counterpart.
Fig.1.

The chromophore molecules in mTFP1: (a) the chromophore structure (the anionic from) shared by GFP and mTFP1; (b) the Tyr67His mutant; (c) the Tyr67Trp mutant. Here and in other figures, carbon atoms are shown in green, oxygen in red, nitrogen in blue.
Recent studies described a series of new colors of mTFP1-derived FPs through the use of site-directed mutagenesis, and the importance of two amino acid side chains, His163 and His197, in the immediate vicinity of the chromophore group was presented [6,7]. It was suggested that a blue shift in absorption and emission in blue fluorescent proteins [6-8] was due to a positive charge on His197 (or its analogue [8]) which is in a close stacking position with respect to the chromophore. The role of His163, which is hydrogen bonded to the chromophore, is even less certain, although plausible suggestions on its significant cationic character have been formulated [7]. A hypothesis put forward was that His163 and His197 act in an independent and additive fashion to increase the energy of the electronic transitions responsible for absorbance and fluorescence through an electrostatic mechanism [7].
Beyond other advantages of theoretical simulations, an assignment of specific protonation states to amino acid side chains, in particular to the His, Asp, Glu residues in proteins, may be performed computationally faster and often with a better efficiency than by experimental efforts. In this work we provide support to a particular assignment in mTFP1 and its mutants and formulate conclusions on the role of specific residues in the chromophore containing pocket.
The strategy of our modeling was discussed in details in previous publications [9,10]: equilibrium geometry parameters of the model molecular clusters mimicking the protein structures were optimized with the B3LYP/6-31G* density functional theory (DFT) approximation, and vertical excitation energies were computed by using the ZINDO technique [11]. As demonstrated in [9,10,12] the ZINDO approach to estimate the S0-S1 excitation energies at the DFT-optimized equilibrium geometry parameters for the GFP-like systems performs with a high accuracy; discrepancies between calculated and measured band positions are within 15-20 nm.
Ab initio quantum chemical calculations for the chromophores illustrated in Fig.1 have been carried out previously by Hasegawa et al. [13], however, the authors concentrated on the theoretical characterization of the chromophores excitations, but not on the role of the surrounding residues.
Models
The optical spectra of the mTFP1 variants was modeled using molecular clusters constructed from the coordinates of the heavy atoms in the crystal structure PDBID:2HQK [6]. The extended cluster model for considerations was constructed by including into the system the chromophore unit and the side chains of the 10 nearest amino acid residues: Asn69, Arg70, Arg95, Asp144, Ser146, Glu148, His163, His197, Ile199, Glu215 (Fig.2). The coordinates of their Cα atoms were kept frozen as in the crystal structure followed by optimization of all other coordinates. Four water molecules in the chromophore containing pocket resolved in the crystal structure were also included to the system.
Fig.2.

The view of the chromophore and the amino acid residues included to the model system following the crystal structure PDBID:2HQK. Four water molecules also included to the calculation scheme are not shown.
A series of mutated structures were considered by sequentially replacing His163 and His197 by Met, Asp144 by Ala, Thr, Arg75 by Leu, Ile199 by Leu or Lys, and Arg95 by Leu. All three chromophore groups (Fig.1) were analyzed inside the chromophore-containing pocket.
Before describing the results of calculations we should note that the present approach may be improved by allowing more flexibility in the model system. The crystal structure, which is our starting point, reflects single arrangement of atoms surrounding the chromophore. Apparently thermal fluctuations of the charged groups or variations in pH may cause certain effect on the chromophore's excitation energies. In future studies we hope to investigate such contributions by performing molecular dynamics simulations prior to quantum chemical optimization of equilibrium geometry parameters.
Results: structures
After the hydrogen atoms were manually added the geometry of the model system was optimized using the B3LYP/6-31G* approximation. Fig.3 illustrates the computed geometrical configuration of the model cluster. For better visibility this figure is in the same perspective as the fragment of the crystal structure PDBID:2HQK in Fig.2. In this model, both His residues (His163 and His197) are protonated and the side chain of Asp144 is unprotonated (see further discussion below). The results of this calculation is in a good agreement with the reference experimental structure.
Fig.3.

The computed equilibrium geometry configuration of the model cluster under the assumption of protonated His163 and Hi197 side chains. Majority of the peptide chains are shown in sticks with the exception of the imidazole rings of His163 and Hi197 (balls and sticks).
This good structural correspondence is violated if the side chain of His197 is unprotonated, as illustrated in Fig.4. Apparently, removing the proton from His197 destroys the stacking interaction between the imidazole ring of His197 and the benzylidene ring of the chromophore leading to the highly distorted orientation of the His197 side chain.
Fig.4.

Superposition of the computed (balls and sticks) configurations of the chromophore and the side chains of His163, His197 and of those from the crystal structure (grey sticks). Top panel: assumption of the protonated His197; bottom panel: assumption of the unprotonated His197.
This report does not comment on all structural changes which follow from the variety of virtual mutations performed in this work, except for two important variants. For the mutation of Asp144 by Ala, the top panel of Fig.5 shows the region of particular interest which includes the chromophore (Cro) and the side chains closest to its phenolic oxygen, His163, Asp144 and Ser146. The coordinates in the crystal structure apparently require locating the proton between Nε of His and the phenolic oxygen of Cro; the corresponding distance is 2.59 Å [6]. The results of geometry optimization are consistent with the protonated His species and the anionic form of the chromophore. When the molecular groups representing the negatively charged side chain of Asp144 were replaced by the Ala side chain the structure with the unprotonated His and the neutral form of the chromophore corresponded to the energy minimum as illustrated in bottom panel of Fig.5. Remarkably, the distances between phenolic oxygen of the chromophore and nitrogen of His163 and oxygen of Ser146 remained practically the same in both variants, as indicated in Fig.5.
Fig.5.
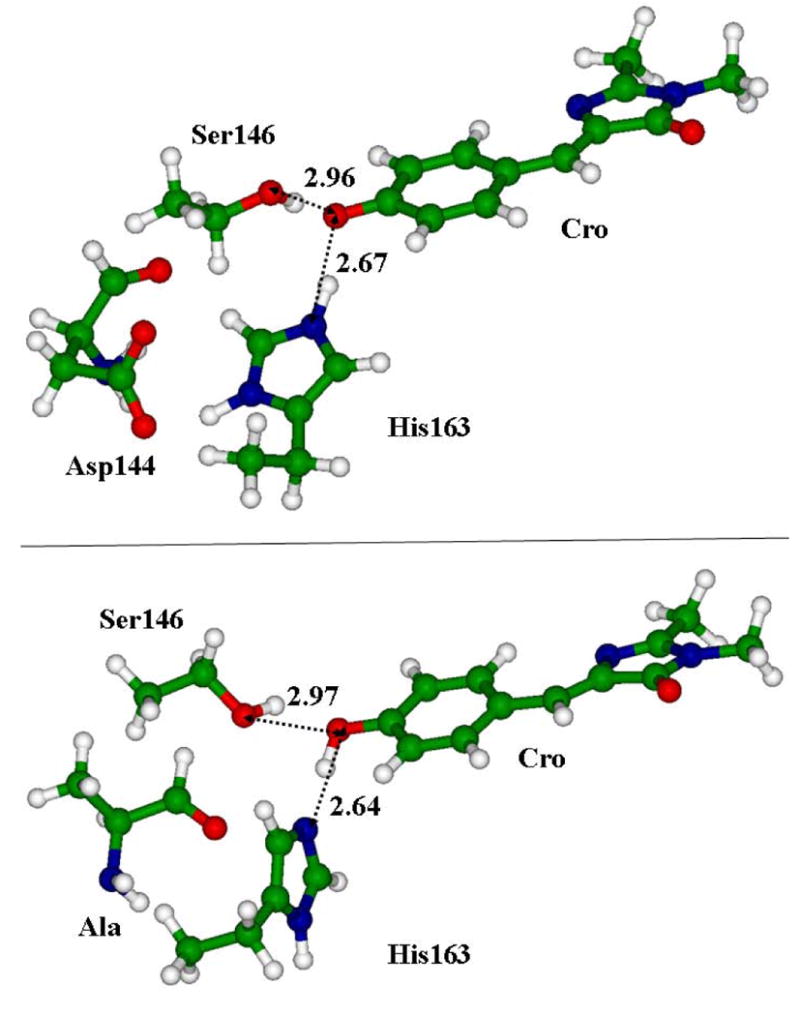
Fragments of the structures near the phenolic ring of the chromophore. Top panel: the model cluster obtained by the motifs of the crystal; bottom panel: the result of the mutation of Asp144 by Ala. Other species (see Fig.3) are not shown for clarity. Distances between heavy atoms are given in angstroms.
Secondly, the mutation of Ile199 by Lys worth mentioning, since this replacement can potentially lead to substantial changes in optical spectra of the fluorescent protein. Fig.6 shows the optimized structures of the model molecular cluster corresponding to the initial composition with the Ile199 side chain (left panel) and that of the mutated structure with the Lys side chain (right panel) emphasizing the mutual arrangement of the chromophore and these particular side chains by displaying them in a ball-and-stick representation. Although positions of other molecular groups around the chromophore (representation by lines in Fig.6) did not change noticeably, a deep insertion of the terminal charged NH3+ group from the Lys side chain very close to the imidazoline ring of the chromophore is observed.
Fig.6.

Equilibrium geometry configurations of the model cluster corresponding to the initial composition with the Ile199 side chain (left panel) and that of the mutated structure with the Lys side chain (right panel).
As with the structures contaning the GFP-like chromophore (Fig.1a), the model structures with the mutated chromophores, Tyr67His (Fig.1b) and Tyr67Trp (Fig.1c), were fully optimized in the B3LYP/6-31G* approximation under the same restrictions as for the original chromophore.
Results: absorption bands
There is an excellent agreement between the vertical excitation S0-S1 for the model cluster shown in Fig.3, as computed in the ZINDO// B3LYP/6-31G* approximation (2.66 eV, or 466 nm) and the position of the intense band (462 nm) in the observed absorption spectra of mTFP1 [6]. This result is based on the assumption of a protonated state of both side chains of His163 and His197 and, correspondingly, of the unprotonated state of Asp144. We shall use the notation of the type His163prHis197prAsp144unpr (see the upper line in Table 1, which summarizes the results) to specify the protonation status of particular residues.
Table 1.
Calculated excitation energies (ΔE), wavelengths (λ), oscillator strengths (f) for the series of model clusters, and the known experimental values [6,7].
| Model system | Theory | Experiment | |||
|---|---|---|---|---|---|
| ΔE, eV | λ, nm | f | ΔE, eV | Λ, nm | |
| His163prHis197prAsp144unpr | 2.66 | 466 | 1.1 | 2.68 | 462 |
| His197prHis163unprAsp144pr | 2.63 | 471 | 1.0 | ||
| His163Met | 2.56 | 483 | 1.2 | 2.54 | 487 |
| His197Met | 2.69 | 462 | 1.1 | ||
| His163unpr(Asp144Ala)Cropr | 3.25 | 381 | 0.9 | ||
| His163unpr(Asp144Ser)Cropr | 3.23 | 384 | 0.9 | ||
| (Ile199Lys)His163unprAsp144prHis197unpr | 2.48 | 501 | |||
| (Ile199Lys/Asp144Thr)His163unprHis197pr | 2.61 | 474 | |||
| (Tyr67His)His163unprAsp144unprHis197unpr | 3.17 | 391 | 0.9 | 3.36 | 369 |
| (Tyr67His)His163unprAsp144unprHis197pr | 3.18 | 389 | 0.8 | ||
| (Tyr67Trp)His163unprAsp144unprHis197unpr | 2.91 | 456 | 0.7 | 2.82 | 440 |
| (Tyr67Trp)His163unprAsp144unprHis197pr | 3.03 | 410 | 0.7 | 2.92 | 424 |
| (Tyr67Trp)His163unprAsp144prHis197pr | 3.01 | 412 | 0.7 | ||
The second line in Table 1 (His197prHis163unprAsp144pr) shows the results assuming a proton transfer from His163 to Asp144 (see Fig.3 and the top panel of Fig.5) which leads to a slight red shift to 471 nm in the absorption band away from the experimental value. It should be noted that the conformation with His163prAsp144unpr corresponds to a slightly lower total energy (by 1.4 kcal/mol in the B3LYP/6-31G* approximation) than that with His163unprAsp144pr, and the energy barrier for this proton transfer is about 0.4 kcal/mol. Combining these data with the structural information (Fig.4) the results of the modeling performed here conclude that the conformation His197prHis163prAsp144unpr occurs in mTFP1.
In accordance with experimental observations [7], mutation of His163 to Met results in a noticeable red shift of the absorption maximum to 483 nm (line His163Met in Table 1). In contrast, replacing His197 by Met (line His197Met in Table 1) shows little effect on the excitation spectra.
As discussed above, replacement of Asp144 by Ala (Fig.5) or Ser leads to the neutral form of the chromophore at the expense of the proton from the His163 side chain. These changes are reflected in the computed excitation energies (lines His163unpr(Asp144Ala)Cropr and His163unpr(Asp144Ser)Cropr in Table 1) which lead to strongly blue shifted band positions near 380 nm, typical for the neutral form of the GFP chromophore.
Mutation of Ile199 to a Lys residue containing a charged side (Fig.6) resulted in the structure in which protonation of Asp144 was favorable and the side chains His163 and His197 were unprotonated. To prepare the structure we did not study in detail the proton transfers between corresponding atomic sites, but instead followed the replacements in accord with energy minimization procedure. As seen in the corresponding line ((Ile199Lys)His163unprAsp144prHis197unpr) of Table 1, a substantial red shift to 501 nm in the absorption spectra of this variant of mTFP1 is predicted. The double mutant ((Ile199Lys/Asp144Thr)His163unprHis197pr) also accounts for a red shift, but to a smaller extent (474 nm). Unfortunately, no experimental information is available for these variants.
Next, the mutated chromophores, Tyr67His and Tyr67Trp, is considered. The structural cages around these modified chromophores are assumed to be the same as in mTFP1 and therefore the coordinates of the Cα atoms of the side chains are held at the same places as in mTFP1. Of course, this assumption may lead to somewhat greater discrepancies with the experimental data as seen in the last 5 lines of Table 1. For the Tyr67Trp mutant, two close bands (440 and 424 nm) in the absorption spectrum were observed [7]. Nevertheless, an overall agreement between theoretical and experimental values is very good and it may be concluded that the results of simulations on the role of these mutations in the spectral properties of mTFP1 are in accord with the experimental observations.
Qualitative conclusions on the role of these mutations in the spectral properties of mTFP1 are in accord with the experimental observations.
Conclusions
It is shown that the most important residues determining spectral shifts are His163, His197 and Asp144. Variation of the protonation states of these residues and low barrier hydrogen bond between His163 and Asp144 can shift spectral lines in the blue or red direction. These model calculations properly describe the spectral shifts due to mutation of His163 and His197 by Met. The most important residue for the blue shift in mTFP1 is His163 (in contrast to the assumption in paper [8]). We were able to properly describe the excitation energy spectrum of the cyan mTFP1 fluorescent protein with the original chromophore and with chromophore mutants Tyr67His and Tyr67Trp.
Mutation of Asp144 to a non-polar residue (Ala or Ser) and protonation of His163 leads to the proton transfer from His163 to the chromophore and to a shift of the electronic transition into the UV region. Mutation of the Ile199 residue to a protonated Lys causes the red shift of the excitation spectrum of mTFP1. The amount of this shift is determined by the protonation of one or both active site His residues.
Acknowledgments
We thank the staff and administration of the Advanced Biomedical Computing Center for their support of this project. We thank Dr. Brian Luke for very helpful comments. This project has been funded in whole or in part with federal funds from the National Cancer Institute, National Institutes of Health, under contract number HHSN261200800001E. The content of this publication does not necessarily reflect the views or policies of the Department of Health and Human Services, nor does mention of trade names, commercial products, or organization imply endorsement by the U.S. Government. This work is partly supported by the Russian Foundation for Basic Research (project # 10-03-00085).
Footnotes
Publisher's Disclaimer: This is a PDF file of an unedited manuscript that has been accepted for publication. As a service to our customers we are providing this early version of the manuscript. The manuscript will undergo copyediting, typesetting, and review of the resulting proof before it is published in its final citable form. Please note that during the production process errors may be discovered which could affect the content, and all legal disclaimers that apply to the journal pertain.
References
- 1.Tsien RY. The green fluorescent protein. Annu Rev Biochem. 1998;67:509–544. doi: 10.1146/annurev.biochem.67.1.509. [DOI] [PubMed] [Google Scholar]
- 2.Zimmer M. Green fluorescent protein (GFP): applications, structure, and related photophysical behavior. Chem Rev. 2002;102:759–781. doi: 10.1021/cr010142r. [DOI] [PubMed] [Google Scholar]
- 3.Stepanenko OV, Verkhusha VV, Kuznetsova IM, Uversky VN, Turoverov KK. Fluorescent proteins as biomarkers and biosensors: throwing color lights on molecular and cellular processes. Curr Protein Pept Sci. 2008;9:338–369. doi: 10.2174/138920308785132668. [DOI] [PMC free article] [PubMed] [Google Scholar]
- 4.Nemukhin AV, Grigorenko BL, Savitsky AP. Computer modeling of structure and spectra of fluorescent proteins. Acta Naturae. 2009;2:35–46. [PMC free article] [PubMed] [Google Scholar]
- 5.Wachter RM, King BA, Heim R, Kallio K, Tsien RJ, Boxer SG, Remington SJ. Crystal structure and photodynamic behavior of the blue emission variant Y66H/Y145F of green fluorescent protein. Biochemistry. 1997;36:9759–9765. doi: 10.1021/bi970563w. [DOI] [PubMed] [Google Scholar]
- 6.Ai HW, Henderson JN, Remington SJ, Campbell RE. Directed evolution of a monomeric, bright and photostable version of clavularia cyan fluorescent protein: structural characterization and applications in fluorescence imaging. Biochem J. 2006;400:531–540. doi: 10.1042/BJ20060874. [DOI] [PMC free article] [PubMed] [Google Scholar]
- 7.Ai HW, Olenych SG, Womg P, Davidson MW, Campbell RE. Hue-shifted monomeric variants of clavularia cyan fluorescent protein: identification of the molecular determinants of color and applications in fluorescence imaging. BMC Biology. 2008;6:13. doi: 10.1186/1741-7007-6-13. [DOI] [PMC free article] [PubMed] [Google Scholar]
- 8.Henderson JN, Remington SJ. Crystal structures and mutational analysis of amFP486, a cyan fluorescent protein from Anemonia majano. Proc Natl Acad Sci USA. 2005;102:12712–12717. doi: 10.1073/pnas.0502250102. [DOI] [PMC free article] [PubMed] [Google Scholar]
- 9.Topol I, Collins J, Polyakov I, Grigorenko B, Nemukhin A. On photoabsorption of the neutral form of the green fluorescent protein chromophore. Biophys Chem. 2009;145:1–6. doi: 10.1016/j.bpc.2009.08.002. [DOI] [PubMed] [Google Scholar]
- 10.Collins JR, Topol IA, Nemukhin AV, Savitsky AP. Computational modeling structure and spectra of biological chromophores. Proc SPIE. 2009;7191:71912. [Google Scholar]
- 11.Zerner MC. In: Rev Comput Chem. Lipkowitz KB, Boyd DB, editors. Vol. 2. VCH Publishing; New York: 1991. pp. 313–366. [Google Scholar]
- 12.Wan S, Liu S, Zhao G, Chen M, Han K, Sun M. Photoabsorption of green and red fluorescent protein chromophore anions in vacuo. Biophys Chem. 2007;129:218–223. doi: 10.1016/j.bpc.2007.06.003. [DOI] [PubMed] [Google Scholar]
- 13.Hasegawa J, Fujimoto K, Swerts B, Miyahara T, Nakatsuji H. Excited states of GFP chromophore and active site studied by the SAC-CI method: Effect of protein-environment and mutations. J Comput Chem. 2007;28:2443–2452. doi: 10.1002/jcc.20667. [DOI] [PubMed] [Google Scholar]