Fig. 2.
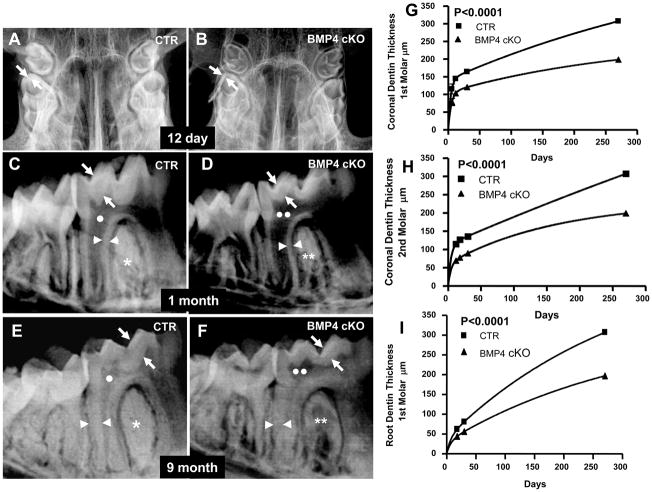
Fig. 2a. High Resolution Digital X-ray analysis and estimation of dentin thickness in control (Panels A, C, E) and BMP4 cKO (Panels B, D, F) mice. These are representative X-rays from 12 day mice (Panel A, B), 1 month (Panel C, D) and 9 month (Panel E, F) mice. The dentin thickness in crown or coronal region and the root region was quantitated in 1 to 2 animals of each genotype at each age, from 12 days to 9 months. The values were then fit to an exponential associated curve using Prism-GraphPad software program (Panel G, H, I). This equation gave R values >0.95 for best curve of analysis. The significance of the difference in the genotype measures between CTR and BMP4 cKO was P<0.0001. Thus there was significantly reduced coronal (arrows) and root (arrowheads) dentin thickness (30 to 35%), as well as apparent enlarged pulp chambers (two white circles-Panel D and F) in BMP4 cKO mice compared to control mice (one white circle-Panel C and D). BMP4 cKO mice have also reduced radio-opacity (two white asterisks-Panel D and F) and display osteopenia like phenotype in the alveolar bone compared to the wild type control mice (one white asterisks-Panel C and E).
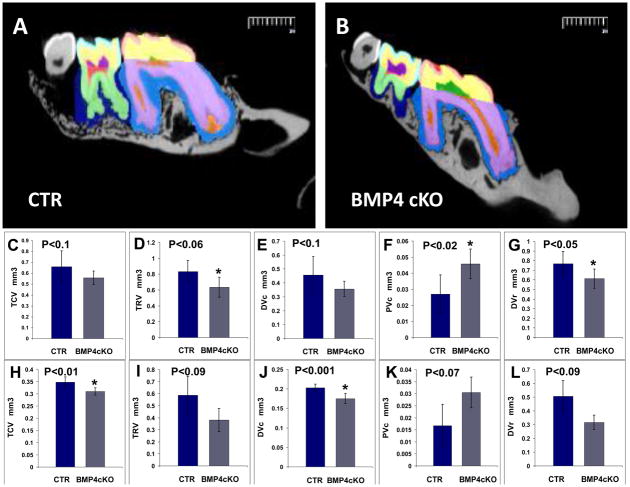
Fig. 2b. MicroCT analysis of 1st and 2nd molars of CTR and BMP4 cKOs of 1 year old animals. A set of 4 CTR and 4 BMP4 cKO jaws from 1 year old mice were subjected to μCT analysis by Numira, Inc (www.numirabio.com) using parameters that we developed with them to quantitate various volumetric aspects of the tooth structure. Panel A and B show cross-sections from the μCT analysis representing colored parameters to be measured in the μCT analysis. In the 1st molar, pink represents the volume measure for the enamel (EV-see Figure 6). Yellow represents the volume of the crown mineralized dentin (DVc). Green represents the pulp volume in the crown that would include any predentin (PVc). The light purple represents the dentin volume in the root region (DVr). The red region represents the pulp volume in the root, including any predentin (PVr). Total crown volume (TCV) and total root volume were also measured in these 1 year animals. In a similar manner, color coding for the 2nd molar is light blue for the enamel volume, EV (see Figure 6G), yellow for the dentin volume of the crown region (DVc), dark purple for the pulp volume of the crown (PVc), and light green for the dentin volume in the root (DVr). The outer blue region around the molar teeth represents the periodontal region of unmineralized tissue and showed no significant difference in CTR and BMP4 cKO animals. Panel C to F shown quantitation and t-test for the 1st molar, with significant increase in PVc and decrease in DVr. There were decreases in the other parameters that showed a tread but were not significant. Panels H to L represent the data and P values for the 2nd molar with significant decreases in TCV and DVc. There was an increase in PVc that had a P=0.07 and less significant decreases in TRV and DVr. In at least one of the molars there was a significant decrease in all the volume measurements that were observed.


