Abstract
Evaluation of bone marrow fibrosis and osteosclerosis in myeloproliferative neoplasms (MPN) is subject to interobserver inconsistency. Performance data for currently utilized fibrosis grading systems are lacking, and classification scales for osteosclerosis do not exist. Digital imaging can serve as a quantification method for fibrosis and osteosclerosis. We used digital imaging techniques for trabecular area assessment and reticulin-fiber quantification. Patients with all Philadelphia negative MPN subtypes had higher trabecular volume than controls (p ≤0.0015). Results suggest that the degree of osteosclerosis helps differentiate primary myelofibrosis from other MPN. Numerical quantification of fibrosis highly correlated with subjective scores, and interobserver correlation was satisfactory. Digital imaging provides accurate quantification for osteosclerosis and fibrosis.
Keywords: bone marrow fibrosis, digital imaging, myeloproliferative neoplasms, osteosclerosis
Introduction
Myeloproliferative neoplasms (MPN) are a heterogeneous disease group. Their many overlapping clinical and histological features cause frequent diagnostic challenges. In 2008 the World Health Organization (WHO) revised the diagnostic criteria for essential thrombocythemia (ET), polycythemia vera (PV), primary myelofibrosis (PMF), myelodysplastic syndrome (MDS), and other MPN [1]. The new WHO guidelines and diagnostic approach for MPN rely on a combination of clinical characteristics, molecular genetic findings such as BCR-ABL or JAK2 mutation status, and morphologic features such as megakaryocyte atypia and degree of fibrosis. Despite increased understanding of MPN, diagnosis and classification remain difficult to impossible in some cases.
A common feature of MPN is an initial hypercellular phase, which may progress to a late-stage fibrotic phase with increased transformation to acute leukemia [2]. In the fibrotic phase, the bone marrow core biopsy shows increased connective tissue deposition, which is detected by reticulin and trichrome stains. Marrow fibrosis is frequently accompanied by osteosclerosis, a thickening and irregularity of the bony trabeculae [3]. Furthermore, many of the distinguishing morphologic and clinical features of the MPN are lost in the fibrotic phase. Consequently, when initial presentation occurs in a fibrotic phase rather than in a hypercellular phase, it can be extremely difficult to determine whether the patient has primary myelofibrosis or myelofibrosis secondary to another MPN such as ET or PV [2]. Although it is assumed that the fibrotic transformation of ET and PT have similar biological features and prognostic significance, this has not been formally tested, in part because of subjectivity in grading fibrosis and the continuum of the transformation process to a fibrotic stage.
Marrow fibrosis is routinely assessed in bone marrow core biopsies of patients with a known or suspected MPN, and is a diagnostic criterion in the 2008 WHO classification system of MPN. Frequently used myelofibrosis grading systems include the Bauermeister system [4], subsequently modified by Manoharan [5], which assesses fibrosis on a 0-4 scale; and the recently revised European consensus system that uses a 0-3 scale [6,7]. These subjective scoring systems have numerous limitations including interobserver variability, inconsistency of use, and possible confusion for the clinician as to which system was used to classify the neoplasm of an individual patient. A numerical assessment of reticulin fibrosis would provide a reproducible and precise way of following patients over time, and would help standardize assessment of fibrosis among both pathologists and hematologists.
Despite the recognition that osteosclerosis often accompanies fibrosis [8,9], osteosclerosis remains under-recognized as a diagnostic criterion and is not always mentioned in hematopathology reports. Due to the lack of a defined scoring system, the significance of osteosclerosis is uncertain; consequently, it is not a diagnostic criterion in the 2008 WHO classification of MPN. Likewise, it is not known whether the degree of osteosclerosis can help differentiate one MPN from another.
The objective of this study was to test the utility of digital imaging as an objective quantification method for both bone marrow fibrosis and osteosclerosis. In addition, we tested the hypothesis that objective quantification of osteosclerosis can aid in the classification of MPN. Furthermore, we compared the performance of an objective, numerical scoring system for fibrosis with the subjective grading systems currently in use. We also determined whether there is a correlation between molecular abnormalities (mutations in JAK2 and cMPL) and the objective fibrosis and osteosclerosis scores.
Materials and Methods
Selection of study group
University of Utah Institutional Review Board approval was obtained prior to initiating this study. We conducted a retrospective review of cases given a definitive diagnosis of chronic MPN between 1991 and 2009 at the Department of Pathology at the University of Utah Health Sciences Center. Classification of all cases was performed according to the 2008 WHO criteria [1], via comprehensive review of the bone marrow core biopsy, aspirate smears, peripheral blood counts, molecular studies, and clinical data. Cases with insufficient clinical data, inadequate core size, extensive fragmentation, and/or extensive crush artifact were excluded. A total of 101 patients (122 biopsies) were eligible for inclusion in the study.
Histomorphologic assessments were performed on posterior superior iliac spine trephine biopsies (2 mm diameter, median length 15 mm; range 8-29 mm) obtained at the time of diagnosis for all patients. In addition, 41 serial interval biopsies from 13 patients, representing multiple biopsies over time, were included. The cases of MPN included PMF, ET, PV, unclassifiable MPN or MPN/MDS, and chronic myelogenous leukemia (CML). Since bone turnover modulation has been reported in CML patients taking BCR-ABL kinase inhibitors (Imatinib) [10], all CML specimens were from untreated and newly diagnosed subjects. Cases of PV and ET were subdivided into pre-fibrotic and post-fibrotic stage, based on their reticulin scores according to the European consensus classification system [6,7]. Cases with fibrosis scores of 0 or 1 were placed into the pre-fibrotic category and labeled as “ET” or “PV”, whereas cases with fibrosis scores of 2 or 3 were labeled as “post-ET myelofibrosis” or “post-PV myelofibrosis”.
Selection of controls
The normal marrow control group consisted of 69 patients undergoing initial lymphoma staging at the University of Utah Health Sciences Center / Huntsman Cancer Hospital (Table 1). We selected only bone marrow core biopsies that showed no evidence of lymphoma or other disease processes. We excluded patients who had any prior history of bone or bone marrow disease, bone trauma, or prior treatment for malignancy.
Table 1. Characteristics of MPN specimens and controls.
| number | age | M:F ratio | |
|---|---|---|---|
| control | 69 | 55.3 ± 13.5 | 1.5 : 1 |
| PMF | 34 | 54.3 ± 15.8 | 1.3 : 1 |
| ET | 20 | 49.1 ± 20.4 | 0.8 : 1 |
| post-ET MF | 14 | 62.8 ± 13.3 | 0.7 : 1 |
| PV | 14 | 61.3 ± 14.2 | 0.8 : 1 |
| post-PV MF | 7 | 70.1 ± 4.0 | 0.8 : 1 |
| CML | 10 | 53.9 ± 21.5 | 1.5 : 1 |
| MPD/MDS, MDS-U | 22 | 63.8 ± 8.1 | 1.1 : 1 |
Control = normal bone marrows from lymphoma staging biopsies; PMF = primary myelofibrosis; ET = essential thrombocythemia; post-ET MF = post - essential thrombocythemia myelofibrosis; PV = polycythemia vera; post-PV MF = post - polycythemia vera myelofibrosis; CML = chronic myelogenous leukemia; MPN/MDS = combined myeloproliferative/myelodysplastic neoplasms and MPN-U = unclassifiable myeloproliferative neoplasms
Objective quantification of fibrosis
Adequately reticulin-stained bone marrow core biopsies were digitally scanned with the ScanScope® XT system (Aperio Technologies, Inc., Vista, CA, USA). Three representative well-preserved areas (0.5 mm2 each) of hematopoietic marrow space from each biopsy were selected. Areas with lymphoid nodules, medium or large vessels, and fibers framing adipocytes were excluded. The percentage of black pixels (i.e., percent reticulin positivity) was calculated using a color deconvolution algorithm provided in the ScanScope® software (Aperio Technologies, Inc., Vista, CA, USA). The three percentages were averaged to determine an objective numerical quantification of reticulin staining.
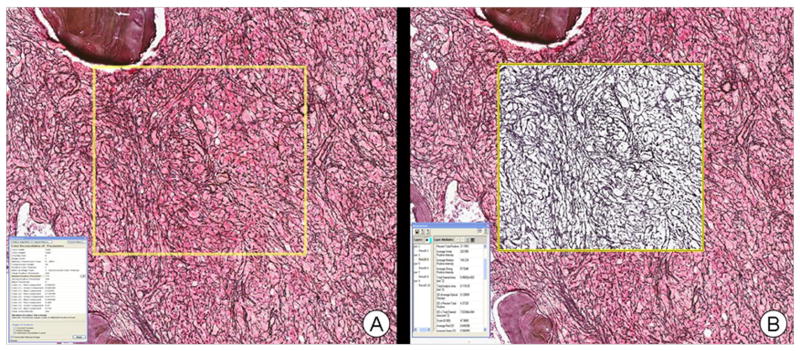
The color deconvolution algorithm separates the image into multiple channels, corresponding to the actual colors of the stains used. This allows the pathologist to accurately measure the area for each stain separately, even when the stains are superimposed at the same location. The example shown in Figure 1 is a result of running the algorithm for the reticulin stain color channel, and shows isolation of reticulin fibers as the other stains are removed. The area for reticulin staining is given as a numerical output by the algorithm, i.e., as a percentage of the total positive staining area. The total stained area is calculated in mm2, from which the actual area for reticulin stain is calculated.
Figure 1.
Example of use of color deconvolution algorithm: A) Scanned reticulin stained core biopsy image with rectangular region of analysis (yellow box) prior to analysis. B) The results after running the algorithm for reticulin stain color channel, resulting in isolation of reticulin fibers. The area of reticulin staining is given in the numerical output screen as a percentage of the total positive staining area.
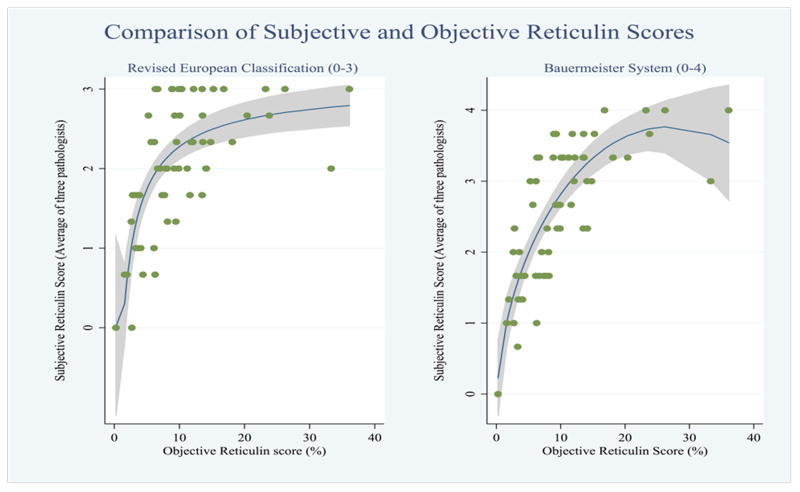
Three pathologists (M.S., S.P., and C.T.) provided a subjective score of reticulin fibrosis for the same cases by viewing the reticulin-stained slides, in conjunction with trichrome-stained slides when available. They were blinded to the objective reticulin score, the other pathologists' subjective scores, and the clinical diagnosis. Fibrosis was scored using the Bauermeister system (0-4) as well as the European consensus system (0-3). This resulted in two sets of fibrosis scores determined by each pathologist. The objective numerical score, obtained via digital imaging using the color deconvolution algorithm, was plotted against a majority consensus subjective score of both systems from the three pathologists to determine correlation using Spearman's rho [11], a measure of the linear relationship (magnitude and direction) between two variables. The closer the correlation is to either +1 or -1, the stronger the correlation.
Quantification of osteosclerosis
To quantify the area of each bone marrow core biopsy occupied by trabecular bone, hematoxylin and eosin-stained bone marrow core biopsy slides were digitally scanned with the ScanScope® XT system (Figure 2A). The entire hematopoietic area was circled manually to allow for calculation of the total biopsy area (Figure 2B). Cortical bone, fragmented areas, and areas with crush artifact were excluded. Each bony trabecula was also circled manually, in order to allow for calculation of total trabecular area (Figure 2C). Areas were quantitated using the ImageScope software's area pixel count algorithm. Trabecular volume (TV) was calculated as a percentage by dividing total trabecular area by total biopsy area.
Figure 2.
Quantification of osteosclerosis: A) Digitally scanned bone marrow core biopsy with the ScanScope XT system (Aperio Technologies, Inc., Vista, CA). B) Total biopsy area calculated using the pixel count algorithm included in Aperio's ImageScope software by encircling of total biopsy (avoiding crushed or fragmented bone and cortical bone). C) Trabecular area calculated using the pixel count encircling of trabecular bone. Trabecular volume (TV) was calculated using the equation (TV%) = Sum of trabecular area / Total biopsy area.
Correlation with molecular abnormalities
The clinical records of PMF, ET, and PV patients were searched to determine JAK2 and cMPL mutation status if evaluation had been performed. Patients with a BCR-ABL mutation (CML) or pre-existing complex cytogenetic abnormalities (MPN/MDS) were excluded from this analysis since JAK2 and cMPL were not done for these cases. Mutation status was correlated with the objective scores of fibrosis and osteosclerosis.
Statistical analysis
All statistical analyses were performed using SAS software, Version 9.1 of the SAS System (© 2002-2003 SAS Institute, Inc., Cary, NC, USA). Interobserver variability in the subjective assessment of fibrosis was determined for both the Bauermeister and European consensus systems, by calculation of the Cronbach's alpha coefficient of correlation [12] (≥ 0.9 = excellent, ≥ 0.8 = good, ≥ 0.7 = acceptable, ≥ 0.6 = questionable, ≥ 0.5 = poor, < 0.5 = unacceptable). Correlation of digital scoring of fibrosis with each of the two subjective scoring systems was carried out using Spearman's rho.
Receiver operating characteristic (ROC) analysis was used to select the optimal osteosclerosis value for separating MPN entities.
Results
All but one case of primary myelofibrosis presented in fibrotic stage, with a reticulin score of 2 or 3. The single bona fide case of pre-fibrotic PMF was excluded from statistical analysis. Our analysis included a total of 121 MPN specimens including PMF (n = 34), ET (n = 34), PV (n = 21), unclassifiable MPN or MPN/MDS (n = 22), and untreated, newly diagnosed CML (n = 10), as well as 69 controls (Table 1). Our subclassification of cases with ET and PV using reticulin fibrosis resulted in 20 cases of ET, 14 cases of post-ET myelofibrosis, 14 cases of PV, and 7 cases of post-PV myelofibrosis.
Osteosclerosis
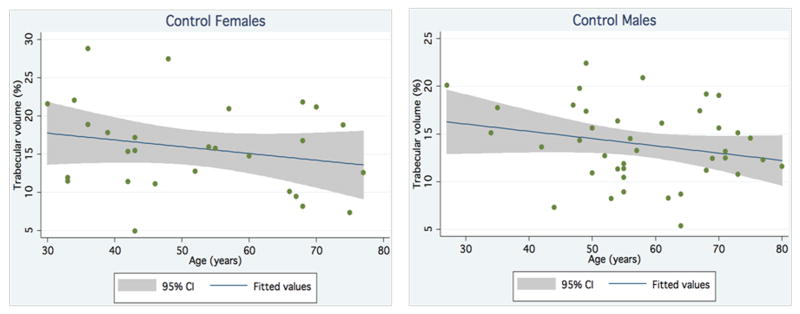
To establish a frame of reference for comparison, TV (i.e., percentage of marrow space occupied by trabecular bone) was determined objectively via area pixel count for the 69 controls. There were no significant differences in age and gender between controls and MPN patients. The control group had an average trabecular volume of 14.7% ± 4.8%. TV decreased slightly with age; however, this was not statistically significant. TV did not show significant gender differences (Figure 3).
Figure 3.
Trabecular volume of control males and females by age.
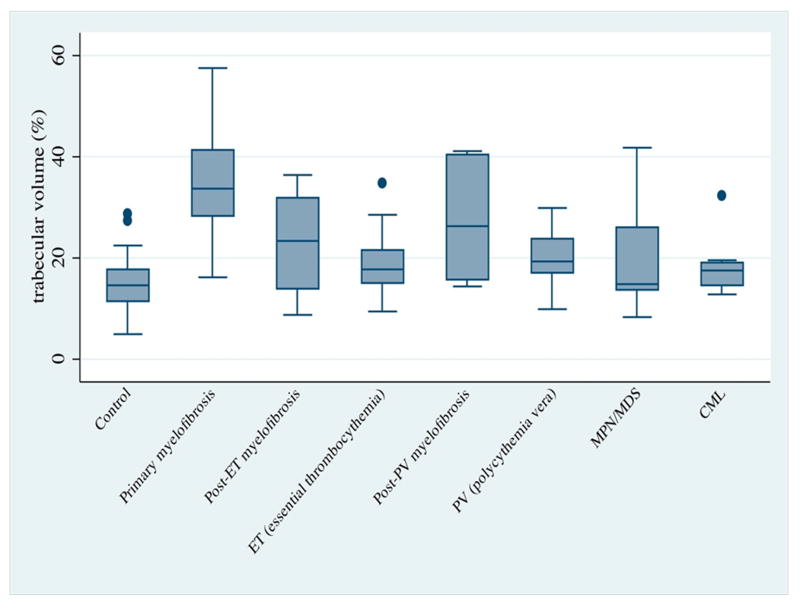
TV was assessed in the same fashion for MPN patients. All categories of MPN showed higher bone TV than did the control group (Figures 4 and 5). This difference was statistically significant for all MPN groups, except for newly diagnosed CML (Table 2). PMF displayed a striking increase in TV, when compared to both ET (p <0.0001) and PV (p <0.0001). Most important, primary myelofibrosis tended to have a higher TV than did secondary myelofibrosis in other MPN. This difference was statistically significant for post-ET myelofibrosis (p =0.0004), but not for post-PV myelofibrosis (p =0.0725).
Figure 4.
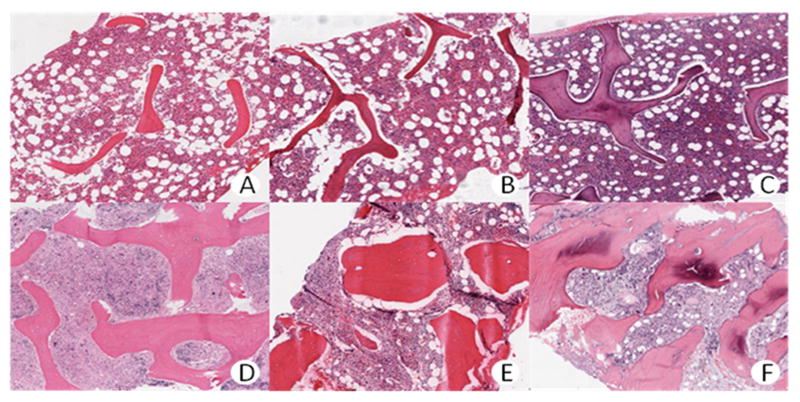
Trabecular volume in selected control patients (A-C) and MPN patients (D-F). A – 10%. B – 15%. C – 20%. D – 30%. E – 40%. F – 50%.
Figure 5.
Trabecular volume (%) of different groups of MPN patients: Box plots displaying distribution of trabecular volume for each disease category and normal controls.
Table 2. Statistical comparison of trabecular volume in MPN groups with normal controls (column 2) and primary myelofibrosis patients (column 3).
| P value vs. control | P value vs. PMF | |
|---|---|---|
| control | ---- | <0.0001 |
| PMF | <0.0001 | ---- |
| ET | 0.0015 | <0.0001 |
| post-ET MF | <0.0001 | 0.0004 |
| PV | 0.0006 | <0.0001 |
| post-PV MF | <0.0001 | 0.0725 |
| CML | 0.0461 | <0.0001 |
| MPN/MDS, MPN-U | 0.0014 | <0.0001 |
Control = normal bone marrows from lymphoma staging biopsies; PMF = primary myelofibrosis; ET = essential thrombocythemia; post-ET MF = post - essential thrombocythemia myelofibrosis; PV = polycythemia vera; post-PV MF = post - polycythemia vera myelofibrosis; CML = chronic myelogenous leukemia; MPN/MDS = combined myeloproliferative/myelodysplastic neoplasms and MPN-U = unclassifiable myeloproliferative neoplasms
ROC analysis (data not shown) disclosed a maximum efficiency at 23% TV for separating PMF from controls (sensitivity 89%, specificity 98%, area under the curve [AUC] 0.9696), and at 30% TV for separating PMF from ET and PV (sensitivity 72%, specificity 87.5%, AUC 0.8429).
Fibrosis
To objectively quantify the amount of reticulin fibrosis, 62 cases with marrow fibrosis due to MPN were selected for analysis [PMF (n = 26), ET (n = 8), fibrotic-phase ET (n = 11), PV (n = 6), fibrotic-phase PV (n = 6), other MPN (n = 5)]. Cases with inadequate sample quality or suboptimal staining were excluded. The numeric digital scores obtained with color deconvolution for PMF (range 5.6-36.1%, mean 13.45%), post-ET myelofibrosis (range 3.88-33.3%, mean 11.68%) and post-PV myelofibrosis (range 9.91-14.1%, mean 12%) were significantly higher than those for ET (range 0.25-7.7%, mean 3.55%) and PV (range 3.66-9.46%, mean 5.39%). Subjective scores of fibrosis determined in MPN biopsies by the three pathologists, using both the Bauermeister and the revised European systems, were compared. The overall concordance between the three pathologists was in the “excellent” category for both the Bauermeister system (Cronbach's alpha coefficient 0.92) and the revised European consensus system (Cronbach's alpha coefficient 0.90). The objective numerical score, obtained via digital imaging using the color deconvolution algorithm, was plotted against a majority consensus subjective score for each case (Figure 6). Correlation of the objective numeric score was similar for both the Bauermeister system (rho = .78) and the revised European system (rho = .66).
Figure 6.
Correlation of subjective and objective assessment of fibrosis.
Correlation of objective and subjective fibrosis and osteosclerosis scores with clinical status
Seven of the thirteen patients with two or more serial biopsies showed progressive increase in TV over time. Five of these thirteen patients underwent bone marrow transplantation, and had available pre- and post-transplant bone marrow biopsy specimens. Increased TV and fibrosis was noted in all pre-transplantation samples. Post-transplant biopsies from three of the five patients (in one PMF patient and two patients with myelofibrosis secondary to ET) showed reduced TV with no morphologic evidence of residual / recurrent disease as evident by normal or reduced cellularity and lack of fibrosis as well as 100% donor chimerism. The objective and subjective assessments of fibrosis and osteosclerosis in one representative PMF patient are shown as an example (Table 3 and Figure 7). His three pre-transplant biopsies showed osteosclerosis and increasingly reticulin fibrosis and collagen deposition. TV was around 30% in all three pre-transplant biopsies. However, his two post-transplant biopsies showed decreased TV at 23% and 21%, respectively. Reticulin fibrosis increased gradually from 11.8% to 15.2% in the three pre-transplant biopsies, and then decreased to 13.5% and 6.2% in the two post-transplant biopsies. The same trend was noted by subjective scoring of reticulin fibrosis. In this patient, the objective measurements of TV and reticulin fibrosis correlate very well with disease status.
Table 3. Osteosclerosis and fibrosis in pre- and post-transplant biopsies in a PMF patient.
| Pre-transplant | Post-transplant | ||||
|---|---|---|---|---|---|
| January 2008 |
May 2008 |
June 2008 |
December 2008 |
June 2009 |
|
| Trabecular Volume (%) | 30.14 | 29.31 | 31.08 | 23.00 | 21.32 |
| Reticulin fibrosis (%) | 11.8 | 13.6 | 15.2 | 13.5 | 6.2 |
| Reticulin fibrosis (0-3 scale) | 2+ | 2+ | 3+ | 2+ | 1+ |
Figure 7.
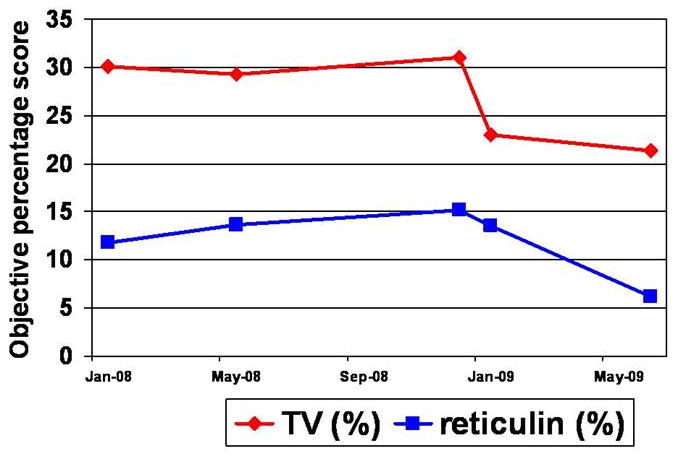
Pre- and post-transplant specimen values for TV and fibrosis in one patient. January, May and June ‘08 represent pre-transplant samples. January and May ‘09 represent post-transplant samples.
The remaining two of the five transplants, both on patients with primary myelofibrosis, showed persistently high objective and subjective measurements of fibrosis and TV in post–transplant samples. Post-transplant biopsies from these two cases disclosed morphologic evidence of persistent PMF indicating recurrent disease, which was further supported by mixed chimerism (32% recipient DNA and 97% recipient DNA, respectively).
Correlation of objective fibrosis and osteosclerosis scores with JAK2 and cMPL status
Of the 75 patients with PMF, ET, and PV, 51 (68%) had undergone testing for mutations in JAK2 and cMPL. Of the patients with molecular results, only 2 (4%) had a mutation in cMPL. One of these patients was also JAK-2 mutation positive. Thirty-two patients (63%) were JAK2 positive and cMPL negative, whereas 17 (33%) were negative for mutations in both JAK2 and cMPL. We found no statistical relationship between JAK2 status and either trabecular volume or reticulin score. The number of cMPL mutations was too low to perform statistical analysis.
Discussion
MPN are clonal disorders that are characterized by the abnormal proliferation of hematopoietic cells from one or several cell lineages, and that share several overlapping clinical and histomorphologic features [13]. Although a combination of clinical, molecular and histomorphologic features is frequently required to render a final diagnosis of MPN, the recently revised 2008 WHO diagnostic criteria reflect an increasing awareness of the role of bone marrow histology. The identification of proliferative hematopoietic lineages, abnormal megakaryocytic morphology and distribution, and reticulin fibrosis aid in the classification of MPN. Nevertheless, limitations exist, largely due to the fact that most of these diagnostic criteria are predominantly based on expert evaluation or consensus statements and lack strict criteria or credible gold standards. This is further impeded by the lack of studies that attempt data validation of proposed histomorphologic features or rare reports showing an inability of expert reviewers to reproducibly apply morphologic criteria in making the diagnosis [9].
Reticulin and trichrome stains are routinely used to assess the presence or absence of marrow fibrosis in bone marrow core biopsies of MPN patients. The most frequently used grading systems to assess myelofibrosis are based on the Bauermeister system (0-4 scale) [4] and the recently revised European consensus system (0-3 scale) [6,7]. The presence and grading of fibrosis is not only important to diagnose MPN, but also guide treatment decisions and patient stratification in clinical trials. However, controversy continues regarding the optimal system for routinely and reproducibly determining reticulin fiber content. The European consensus system incorporates osteosclerosis into its grading scheme, and is favored by many pathologists because of its simplified 0-3 scale. Interestingly, our results showed equivalent interobserver variability for both the Bauermeister system and the European consensus classification, with excellent Cronbach's alpha coefficients. Although the digital numerical scores showed high correlation with both systems, the Bauermeister system demonstrated slightly better performance than the European consensus classification. It is unclear whether this reflects familiarity with the grading systems, as experience with the European consensus system is limited.
Unlike fibrosis, osteosclerosis does not have defined subjective (or objective) scoring criteria or a grading system for routine clinical use. This is reflected in the observation that osteosclerosis currently is not a diagnostic criterion in the 2008 WHO classification of MPN, despite the recognition that it is a morphologic component in many MPN. The literature contains rare examples of objective quantification of osteosclerosis via manual measurement of trabecular volume [8,10,14,15]. However, these measurements are somewhat laborious and time-consuming. Consequently, few hematopathologists have utilized them in routine practice, despite consistent observation of increased osteosclerosis in PMF and other MPN [3,8,16]. Likewise, it is not known whether the degree of osteosclerosis can help differentiate one MPN from another. In keeping with previous reports [8], our study indicates that all categories of MPN, except newly diagnosed CML, showed significantly higher TV than did the control group. Most important, our findings show a strikingly higher TV in PMF compared to both ET and PV (p <0.0001 in both cases). Use of a 30% TV cut-off showed maximum efficiency for separating PMF from ET and PV by ROC analysis. In addition, primary myelofibrosis tended to have a higher TV than did myelofibrosis secondary to other MPN. This difference was statistically significant for post-ET myelofibrosis but failed to attain statistical significance for post-PV myelofibrosis, most likely because the post-PV myelofibrosis group was small and displayed marked TV variation. We also identified a progressive increase in TV over time in seven of thirteen MPN patients with available serial biopsies. Similarly, we saw a decrease in TV in the post-transplant specimens of MPN patients with no evidence of disease. This preliminary evidence suggests that the fibrosis and osteosclerosis scores obtained by digital imaging correlate with disease status, and may provide and objective way of classifying disease severity at diagnosis and over time.
Digital imaging is an emerging technology, with great promise for numerous applications throughout the field of pathology. Although its use is not yet ubiquitous, in some institutions it has already become valuable in standardizing subjective measures such as Her2/neu amplification in breast cancers [17]. Our study demonstrates the utility of digital imaging as an objective quantification method for both bone marrow fibrosis and osteosclerosis. Digital imaging can provide a simple, rapid and reproducible tool to quantify osteosclerosis and fibrosis of bone marrow biopsies in both clinical practice and investigative pathology. The increasing availability of pattern recognition software makes it possible to readily automate the process of quantification of TV and reticulin fibrosis. An objective numerical assessment of reticulin fibrosis and osteosclerosis would provide a more precise way of following patients over time for disease progression or evaluating response to therapy, and would help standardize assessment of fibrosis among pathologists.
Acknowledgments
The authors acknowledge the assistance of Susan Schulman and Leita Rogers with manuscript preparation, and the assistance of Robin Fenn with scanning of slides. The authors would like to acknowledge the MPD research consortium for their support to the MPN clinic and 1P01CA108671-O1A2 (NCI) to JTP
Sources of Funding: 1P01CA108671-O1A2
Footnotes
Conflict of interest statement: MES is a consultant on the medical advisory board for Aperio Technologies, Inc. CJT, ARW, SLP, KH and JTP have no actual or potential conflicts of interest.
Publisher's Disclaimer: This is a PDF file of an unedited manuscript that has been accepted for publication. As a service to our customers we are providing this early version of the manuscript. The manuscript will undergo copyediting, typesetting, and review of the resulting proof before it is published in its final citable form. Please note that during the production process errors may be discovered which could affect the content, and all legal disclaimers that apply to the journal pertain.
References
- 1.Swerdlow SH, Campo E, Harris NL, et al., editors. WHO classification of tumours of haematopoietic and lymphoid tissues. fourth edition. Geneva, Switzerland: WHO Press; 2008. pp. 31–64. [Google Scholar]
- 2.Kvasnicka HM, Thiele J. Classification of Ph-negative chronic myeloproliferative disorders--morphology as the yardstick of classification. Pathobiology. 2007;74:63–71. doi: 10.1159/000101706. [DOI] [PubMed] [Google Scholar]
- 3.Tefferi A. Myelofibrosis with myeloid metaplasia. N Engl J Med. 2000;342:1255–65. doi: 10.1056/NEJM200004273421706. [DOI] [PubMed] [Google Scholar]
- 4.Bauermeister DE. Quantitation of bone marrow reticulin--a normal range. Am J Clin Pathol. 1971;56:24–31. doi: 10.1093/ajcp/56.1.24. [DOI] [PubMed] [Google Scholar]
- 5.Monaharan A, Horsley R, Pitney WR. The reticulin content of bone marrow in acute leukemia in adults. Br J Haematol. 1979;43:185–90. doi: 10.1111/j.1365-2141.1979.tb03740.x. [DOI] [PubMed] [Google Scholar]
- 6.Thiele J, Kvasnicka HM, Facchetti F, et al. European consensus on grading bone marrow fibrosis and assessment of cellularity. Haematologica. 2005;90:1128–32. [PubMed] [Google Scholar]
- 7.Thiele J, Kvasnicka HM. Myelofibrosis--what's in a name? Consensus on definition and EUMNET grading. Pathobiology. 2007;74:89–96. doi: 10.1159/000101708. [DOI] [PubMed] [Google Scholar]
- 8.Poulsen LW, Melsen F, Bendix K. A histomorphometric study of haematological disorders with respect to marrow fibrosis and osteosclerosis. APMIS. 1998;106:495–9. doi: 10.1111/j.1699-0463.1998.tb01377.x. [DOI] [PubMed] [Google Scholar]
- 9.Wilkins BS, Erber WN, Bareford D, et al. Bone marrow pathology in essential thrombocythemia: interobserver reliability and utility for identifying disease subtypes. Blood. 2008;111:60–70. doi: 10.1182/blood-2007-05-091850. [DOI] [PubMed] [Google Scholar]
- 10.Fitter S, Dewar AL, Kostakis P, et al. Long-term imatinib therapy promotes bone formation in CML patients. Blood. 2008;111:2538–47. doi: 10.1182/blood-2007-07-104281. [DOI] [PubMed] [Google Scholar]
- 11.Spearman C. The proof and measurement of association between two things. By C Spearman 1904. Am J Psychol. 1987;100:441–71. [PubMed] [Google Scholar]
- 12.Bland JM, Altman DG. Cronbach's alpha. BMJ. 1997;314:572. doi: 10.1136/bmj.314.7080.572. [DOI] [PMC free article] [PubMed] [Google Scholar]
- 13.Tefferi A. Pathogenesis of myelofibrosis with myeloid metaplasia. J Clin Oncol. 2005;23:8520–30. doi: 10.1200/JCO.2004.00.9316. [DOI] [PubMed] [Google Scholar]
- 14.Bock O, Loch G, Schade U, et al. Osteosclerosis in advanced chronic idiopathic myelofibrosis is associated with endothelial overexpression of osteoprotegerin. Br J Haematol. 2005;130:76–82. doi: 10.1111/j.1365-2141.2005.05573.x. [DOI] [PubMed] [Google Scholar]
- 15.Melsen F, Melsen B, Mosekilde L, Bergmann S. Histomorphometric analysis of normal bone from the iliac crest. Acta Pathol Microbiol Scand A. 1978;86:70–81. doi: 10.1111/j.1699-0463.1978.tb02014.x. [DOI] [PubMed] [Google Scholar]
- 16.Thiele J, Kvasnicka HM, Fischer R. Histochemistry and morphometry on bone marrow biopsies in chronic myeloproliferative disorders - aids to diagnosis and classification. Ann Hematol. 1999;78:495–506. doi: 10.1007/s002770050546. [DOI] [PubMed] [Google Scholar]
- 17.Hall BH, Ianosi-Irimie M, Javidian P, et al. Computer-assisted assessment of the human epidermal growth factor receptor 2 immunohistochemical assay in imaged histologic sections using a membrane isolation algorithm and quantitative analysis of positive controls. BMC Med Imaging. 2008;8:11. doi: 10.1186/1471-2342-8-11. [DOI] [PMC free article] [PubMed] [Google Scholar]


