

Abstract
Nanoparticle-assisted drug delivery has been emerging as an active research area in recent years. The in vivo biodistribution of nanoparticle and its following mechanisms of biodegradation and/or excretion determine the feasibility and applicability of such a nano-delivery platform in the practical clinical translation. In this work we report the synthesis of the highly positive charge, near-infrared fluorescent mesoporous silica nanoparticles (MSNs) that demonstrate rapid hepatobiliary excretion, for use as traceable drug delivery platforms of high capacity. MSNs were incorporated with near-infrared fluorescent dye indocyanine green (ICG) via covalent or ionic bonding, to derive comparable constructs of significantly different net surface charge. In vivo fluorescence imaging and subsequent inductively coupled plasma-mass spectroscopy of harvested tissues, urine, and feces revealed markedly different uptake and elimination behaviors between the two conjugations; with more highly charged moieties (+34.4 mV at pH 7.4) being quickly excreted from the liver into the gastrointestinal tract, while less charged moieties (-17.6 mV at pH 7.4) remained sequestered within the liver. Taken together, these findings suggest that charge-dependent adsorption of serum proteins greatly facilitates the hepatobiliary excretion of silica nanoparticles, and that nanoparticle residence time in vivo can be regulated by manipulation of surface charge.
Keywords: In vivo clearance of nanoparticle, mesoporous silica nanoparticle, hepatobiliary excretion, near-infrared fluorescence, surface charge of nanoparticle, drug delivery
1. Introduction
Nanoparticle-assisted drug delivery has been emerging as an active research area in recent years. The in vivo biodistribution of nanoparticle and its following mechanisms of biodegradation and/or excretion determine the feasibility and applicability of such a nano-delivery platform in the practical clinic. It is known that most nanoparticles tend to exhibit high uptake in the reticuloendothelial system (RES) of liver and spleen upon intravenous administration and are not rapidly degraded or excreted. The targeted delivery of nanoparticles by surface functionalization of bioactive molecules can enhance their accumulation in diseased organs and cells, or mitigate the uptake by the RES.[1, 2] Specific targeting of nanoparticles to tumors has been accomplished in various systems, nevertheless, with the modest efficiency of delivery in general.[3-6] In other words, there is a high-weighted percentage of administered nanoparticles will accumulate in tissues/organs other than the targeted tumor. If such substantial amount of nanoparticles reside in the tissues/organs cannot undergo further biodegradation or excretion, it may cause unwanted cytotoxicity and other side-effects.[7-13] Thus, to define the characteristics of synthetic nanoparticles that govern their biodegradation and/or excretion in vivo would be the prerequisite for them to be applied as the drug delivery systems in clinical therapeutics.
To best minimize toxicity and/or collateral effects, a nanoparticle should either be degraded in situ into truly non-cytotoxic subcomponents or be excreted from the body, once it has served its diagnostic/therapeutic purpose. Numerous studies have been reported on the biocompatibility of nanoparticles and, to a lesser degree, their degradation by-products.[7,9-11,14-20] There are two primary routes of clearance/excretion of nanoparticles. One is the renal filtration with excretion into the urine; and the other is hepatobiliary (HB) processing with excretion into the bile. Clearance of nanoparticles is determined primarily by size and charge. Nanoparticles that carry significant surface charge tend to adsorb serum proteins that can affect their biodistribution, elicit immune response, and indiscriminately destabilize cell membranes and proteins. Nanoparticle size, however, most strongly correlates with clearance dynamics – with particles 3 nm in diameter and smaller extravasating tissues nonspecifically, those 3-8 nm in diameter undergoing renal clearance, those 30-80 nm in diameter being sequestered in lung and leaky vasculature (e.g., tumor and inflamed tissue, via the enhanced permeation and retention effect), and particles larger than 80 nm becoming trapped by liver and spleen.[14] Dendrimers and polymers less than 8 nm in diameter primarily undergo renal clearance.[15] Large biodegradable nanoparticles have been designed to undergo renal clearance after processing via intracellular catabolism, which results in smaller, filterable subparticles. Clearance of quantum dots (QDs) is dependent on nanoparticle size and charge. QDs with diameters less than approximately 5.5 nm and zwitterionic coatings demonstrate rapid renal clearance.[16] Clearance of carbon-base nanoparticles varies depending on shape, chemical composition and size. Liu et al. reported the near-complete clearance of single-walled carbon nanotubes (SWNTs) functionalized with polyethylene-glycol (PEG) from mice via the HB and renal pathways in approximately 2 months.[15] Liposome-based nanoparticles primarily undergo HB clearance. Additionally, owing to extensive serum protein opsonization, liposome nanoparticles demonstrate significant RES uptake and retention.[21,22] The PEGylated gold nanospheres, with long blood circulation times (∼30 h), have demonstrated a propensity to accumulate in the liver and spleen of mice as long as 7 days after their injection, leading to acute hepatic inflammation and apoptosis.[17] Silica is a promising material for the development of nanoparticles possessing good biocompatibility. However, only few clearance studies for silica-based nanoparticles are currently available. Kumar et al. in recent work using multimodal organically modified silica (ORMOSIL) nanoparticles manifest the in vivo biodistribution and clearance of 20-25 nm silica nanoparticles.[18] The clearance studies suggest an initial uptake of the ORMOSIL nanoparticles by the RES system, followed by their gradual degradation and excretion via the HB mechanism over a period of 15 days.
Albeit nanoparticles with diameter larger than 80 nm tend to be trapped in liver and spleen, they possess larger payload capacity for use as drug delivery systems. To explore the factors that govern the RES escape and subsequent HB excretion of nanoparticles larger than 80 nm, in this work we report on the synthesis of highly positive surface charge mesoporous silca nanoparticles (MSNs) that we have covalently labeled with a near-infrared fluorescent dye, for use as in vivo contrast agents. As described below, these fluorescent MSNs demonstrate not only relatively rapid uptake by the liver, but relatively rapid hepatobilliary excretion into the intestinal tract as well (less than 30 min; Fig. 1.); to the best of our knowledge, the first surface charge manipulated rapid hepatobiliary excretion of silica nanoparticles larger than 80 nm to be reported. Previous in vivo imaging studies by our group, with the same fluorescent dye ionically conjugated to the same nanoparticle, reveal markedly different uptake and elimination patterns.[19] Differences in the uptake and excretion of covalently-labeled MSNs from that of ionically-labeled MSNs are thus attributed to differences in surface charge.
Fig. 1.
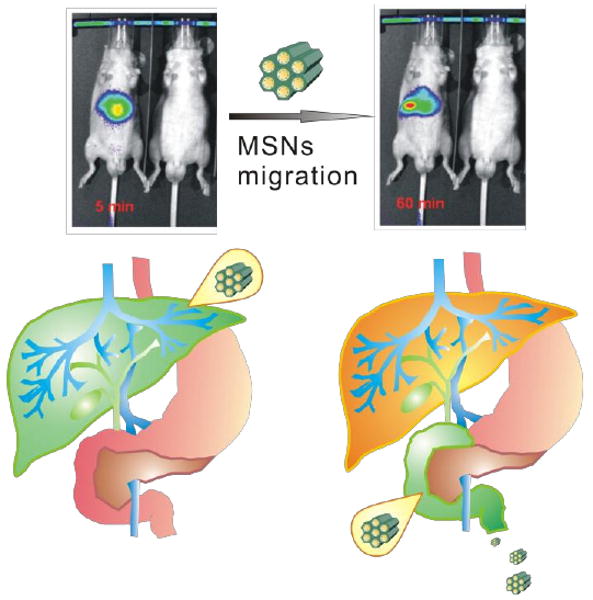
Tracking of fluorescently labeled MSNs in vivo. Five minutes following their tail-vein injection, most MSNs appear localized within the left and medial lobes of the liver. After one hour, significant numbers of MSNs have already begun to undergo hepatobiliary excretion and have migrated towards/into the biliary duct.
For these investigations we elected to use MCM-41 mesoporous silica. With its intrinsically large surface area (∼1000 m2/g), large pore volume (∼1.0 cm3/g), inherent chemical stability, and highly-ordered hexagonal pore structure and adjustable pore size (1.5-30 nm), MCM-41 mesoporous silica has found application in a variety of settings that include catalysis,[20-22] separation,[23] drug delivery,[24-28] and controlled drug release[29]. Earlier studies have shown it to be remarkably non-cytotoxic and especially well suited to the efficient and protective transport of lipid-insoluble molecules across cell/organelle membranes.[30-32] We recently exploited these attributes of MCM-41 to synthesize extraordinarily bright, near-infrared, contrast agents that retained over 95% of their available ligand binding sites for subsequent drug conjugation and biological targeting.[26] Near-infrared fluorophores were used for these studies as, at wavelengths between 650nm and 900nm, both mammalian tissue and MSN exhibit only modest absorption of photons; thereby enabling greater photon penetration. In our previously reported work,[26] by ionically tiling the enormous surface areas of trimethylammonium-incorporated MSNs (MSN-TA) with the dye ICG, we achieved fluorophore loadings nearly 3 orders of magnitude greater than possible for aqueous suspensions, due to the MSNs' steric inhibition of fluorophore aggregation and self-quenching, as well as it shielding of ICG from metabolic reduction and photo/thermal degradation. In vivo optical imaging of the MSN-TA-ICG biodistribution in mouse and rat demonstrated rapid (minutes) and significant uptake of MSNs by liver; a finding confirmed ex vivo by inductively couple plasma-mass spectroscopy (ICP-MS) of silicon content, with liver accounting for slightly more than 35% of silicon uptake 6 hours post-injection – 4 times higher than the next highest-retention organ, the kidney. TEM imaging of frozen tissue cross-sections, 3 hours post-injection, showed the sequestered MSNs to be largely concentrated within the intracellular vesicles of Kupffer cells. In the current study we sought to determine what role, if any, an MSN's surface charge played in its biodistribution, clearance from circulation, and excretion via comparing MSNs with surfaces modified for covalently-conjugated fluorophores to those with surfaces modified for ionically-conjugated fluorphores.
2. Materials and methods
2.1. Materials
Tetraethoxysilane (TEOS), cetyltrimethylammonium bromide (CTAB), methanol, ammonium hydroxide (30%), and 3-Aminopropyltrimethoxysilane (APTS) were purchased from Acros Organics. N-trimethoxysilylpropyl-N,N,N-trimethylammonium chloride (50%, in methanol), indocyanine green (ICG), and pyridine were obtained from Sigma-Aldrich Chemical Co. Cy5.5 NHS ester was secured from GE Healthcare Life Sciences. Ringer's solution, with an ionic strength comparable to that of human plasma (NaCl: 8.60 mg, KCl: 0.3 mg, CaCl2: 0.33 mg, for every 1 ml of H2O), was purchased from Henry Schein Inc.
2.2 Preparation of MSN-NH2 samples
CTAB (0.58 g) was dissolved in NH4OH (0.51 M, 300 ml) at 40°C, to which dilute TEOS (0.2 M in 5.0 ml of ethanol) was added. After vigorous stirring for 5 h, APTS (5.0 ml) and TEOS (1.0 M in 5.0 ml of ethanol) were added, with vigorous stirring for another 1 h. The resulting solution was then aged at 40°C for 24 h. Samples were collected by repeated centrifuging for 20 min at 12,000 rpm, washing, and redispersing in deionized water and ethanol. Solid products were then isolated by centrifuge. Surfactant templates were removed by extraction in acidic ethanol (∼ 1.0 g of HCl in 50 ml of ethanol at 65 °C for 24 h).
2.3 Preparation of MSN-NH2-ICG samples
Covalent conjugation of the near-infrared fluorophore ICG within the MSN's silica framework, to derive MSN- NH2-ICG, was as follows. First, an ICG stock solution was prepared by mixing ICG (1 mg) in methanol (1 ml). The ICG stock solution was then further diluted in methanol to a concentration of ICG (12 ug) in methanol (1 ml). To this diluted ICG-methanol solution (12 ug/ml) was added pyridine and a non-extracted MSN-NH2 sample (15 mg). The resulting mixture was then stirred at room temperature for 2 h. MSN-NH2-ICG complex was next washed with methanol and Ringer's solution, and centrifuged for 20 min at 12000 rpm, twice. The amount of ICG loading in individual MSN-NH2 samples was determined by measuring the decrease in optical absorption of the residual solution at 680 nm, with concentration-dependent calibrations having been made beforehand. Leaching experiments were carried out by suspending MSN-NH2-ICG (5 mg) in 5 ml Ringer's solution, HCl (20 mM) and NaOH (20 mM) solution for 30 min, followed by centrifuging for 20 min at 12000 rpm.
2.4 Preparation of MSN-NH2-Cy5.5 samples
Covalent conjugation of the near-infrared fluorophore Cy5.5 within the MSN's silica framework, to derive MSN- NH2-Cy5.5, was as follows. First, a Cy5.5-NHS ester stock solution was prepared by mixing Cy5.5-NHS ester powder (2 mg) in DMSO (1 ml). Next 200 ml of the DMSO/Cy5.5 stock solution was added to a non-extracted MSN-NH2 sample (15 mg), and the mixture further diluted in 50 ml DMSO. After stirring at room temperature for 2 h, the MSN-NH2-Cy5.5 complex was washed with DMSO and Ringer's solution twice, followed by centrifuging for 20 min at 12000 rpm. The amount of Cy5.5 loading in individual MSN-NH2 samples was determined by measuring the decrease in optical absorption of the residual solution at 645 nm.
2.5 Nanoparticle Characterization
The zeta potentials of pure-form MSN, MSN-NH2, MSN-NH2-ICG, and MSN-NH2-Cy5.5 samples were measured via titration in a Malvern Zetasizer 3000 HS. Zeta potential distributions were obtained by averaging ten measurements. The samples were prepared at concentration of 2 mg in 1 ml of ddH2O. pH values were adjusted by the addition of HCl or NaOH (0.02 M). Before each measurement, each sample was sonicated for 1 min to preclude aggregation. The morphology of MSN samples were determinied via TEM (Hitachi, H-7650 operating at an acceleration voltage of 80 kV). Surface areas and pore sizes were determined by N2 adsorption-desorption isotherms obtained at 77 °K on a Micrometric ASAP 2010 apparatus. Samples were outgassed at 10-3 Torr and 120 °C for approximately 6 h prior to adsorption studies. Pore size distribution curves were obtained from the analysis of the desorption portion of the isotherms, using the BJH (Barrett-Joyner-Halenda) method.
2.6 TEM Imaging of Liver Tissues
For electron microscopy, tissue specimens were fixed overnight in glutaraldehyde buffered (2.5%) with phosphate buffered saline (PBS; 0.1M, pH 7.4). Tissues were then washed 3 times in PBS and post-fixed for 1 h in a solution containing OsO4 buffered (2%) with PBS. Next tissues were washed 3 times in dH2O, and dehydrated stepwise in EtOH. Tissues were polymerized using Spurr resin at 68 °C for 15 h. The embedded specimens were subsequently thin-sectioned into 70 nm slices and viewed on a Hitachi H-7650 TEM, operating at 80kV.
2.7 In Vivo Optical Imaging
In vivo fluorescent imaging was carried out on a commercial Xenogen/Caliper IVIS-200 In Vivo Imaging System (with isoflurane anesthesia) as well as on a home-made in vivo optical imaging system (with urethane anesthesia). For the latter, light from a 100 W Hamamatsu xenon lamp was passed through fluorophore-dependent bandpass interference filters (Model 545AF75, Omega Optical), to induce ICG or Cy5.5 fluorescence. The imaging sensor was a charge-coupled device (CCD) camera (DW436, Andor Technology), thermoelectrically cooled to -90°C. Bandpass interference filters (FF495 Ex 02-25, Smerok, USA) were placed over a 50mm f/1.2 lens (Nikon), to pass fluorescent but block excitation light. Animal body temperatures were maintained at 37°C via a heating pad. Prior to imaging, male nude mice (∼20 g, 6-8 weeks old) or Male Sprague Dawley rats (weight ca. 250 g) were either fasted for 12 h or placed on Teklad 2916 diets for 5 days, to minimize rodent chow autofluorescence within the GI-tract, and anesthetized with either isoflurane (2% in O2) or urethane (1.5 g/kg) i.p. injection. MSN-NH2-ICG and MSN-NH2-Cy5.5, at a dosage of 16 mg/kg, was injected i.v. via the tail-vein of animals. Animals were sacrificed by either CO2 overdose or cervical dislocation, approximately 3 h after whole-body imaging. Major organs were then immediately harvested intact, imaged for fluorescence using the in vivo imaging system, and frozen at -80 °C to await silicon distribution studies.
2.8 Mass Spectroscopy of Tissues and Excrement
Silicon in various organs was measured using ICP-AES (Jarrell-Ash, ICAP 9000). Sample preparation for ICP-AES was by dissolution of each organ in HNO3 (1 ml), HCl (3 ml), and HF (1 ml). Tissue solutions were then diluted in dH2O (100 ml) and heated at 120°C for 2 days. Data presented in this work were obtained from averaging three control animals (Ringer's-only injection) and four experimental animals (MSN-NH2-ICG or MSN-NH2-Cy5.5).
3. Results and discussion
3.1 Synthesis and Characterization of MSN-NH2-ICG
As illustrated in Fig. 2, secondary amine labeling of MSN were prepared via the sol-gel processes we previously used (see Methods), but without co-condensation of TA-silane with tetraethoxysilane (TEOS), since the positively charge TA groups were no longer needed for fluorophore conjugation.[26] TEM imaging of MSN-NH2 samples (Fig. 3a) showed hexagonal shape and uniform size, with a mean particle diameter of 50-100 nm.
Fig. 2.
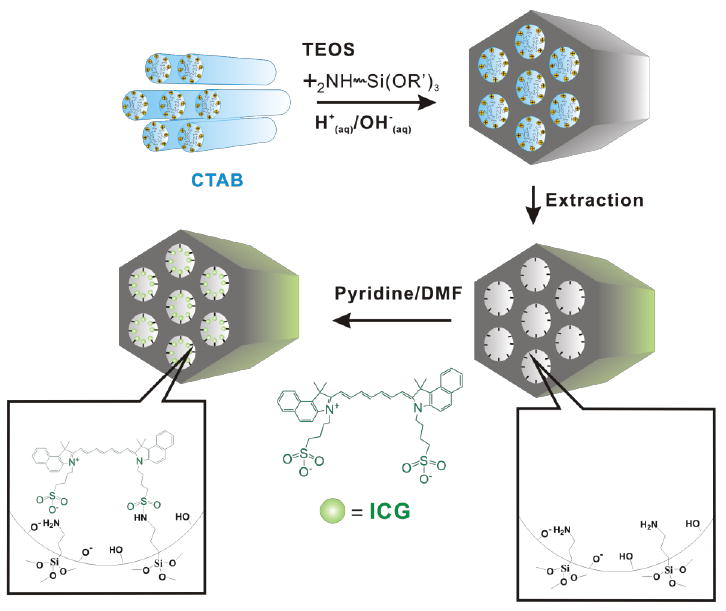
Sol-gel secondary amine labeling of and fluorophore conjugation to MSN surfaces. Adsorption of fluorophore within the hexagonal nanochannels of the resulting MSN-NH2 was performed in methanol solutions, to preclude fluorophore aggregation at high loading densities.
Fig. 3.
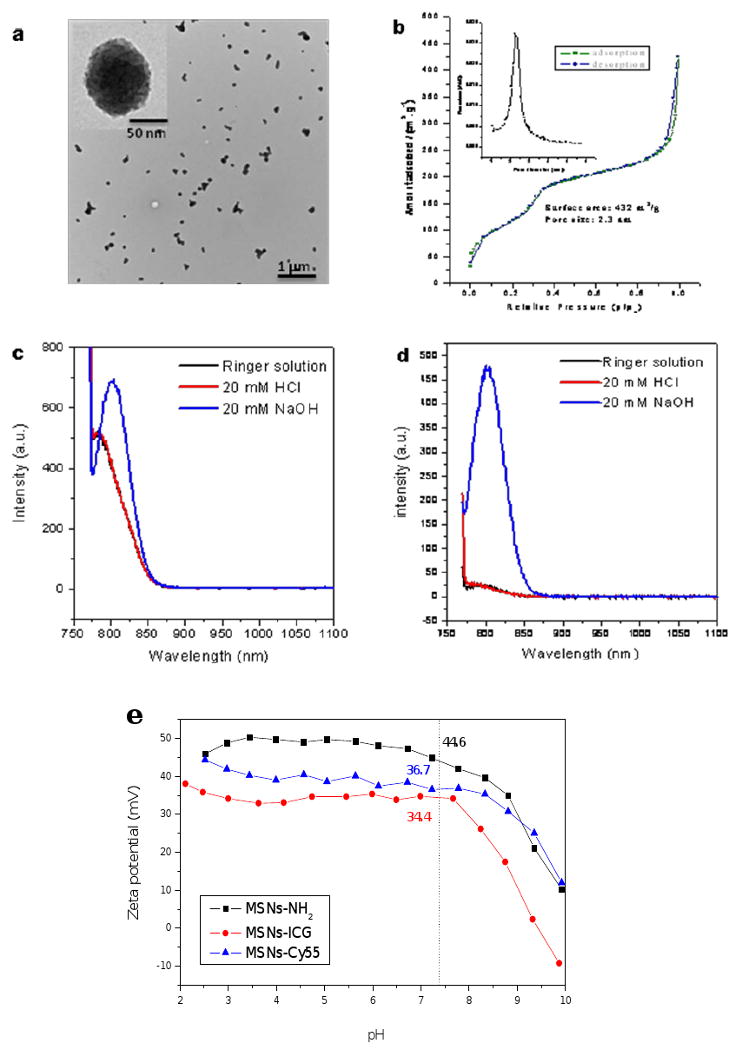
In vitro characterization of MSNs. (a) TEM images of MSN-NH2 showing typical hexagonal structure and 80 nm average particle diameter. (b) Nitrogen adsorption-desorption isotherms and pore-size distribution of MSN-NH2. Fluorescent spectra (c) of MSN-NH2-ICG in suspension and (d) of free ICG that leached from MSN-NH2-ICG into the surrounding media, over a wide range of pH. (e) Zeta potential dependence on pH for various MSN constructs, with mean values listed for pH 7.4.
Nitrogen adsorption-desorption isotherms and pore size distribution of MSN-NH2 (Fig. 3b) revealed high surface area (432 m2/gm), uniform pore diameter (2.3 nm), and large accessible pore volume (0.38 cm3/gm). Adsorption of ICG or Cy5.5 within the hexagonal nanochannels of the resulting MSN-NH2 was performed in methanol solutions, to preclude fluorophore aggregation at high loading densities. Measurements were also made of the fluorescence spectra of MSN-NH2-ICG (Fig. 3c) in a physiological buffer (Ringers solution) of neutral pH, 20 mM HCl and 20 mM NaOH – to validate the adsorption of ICG and Cy5.5 onto the MSN and the stability of its fluorescence over a wide range of pH. Spectra of MSN-NH2-ICG in HCl and Ringers solution showed similar high levels of fluorescence, but with emission maxima blue-shifted (relative to free ICG in H2O) from 830 nm to 785 nm, while stronger fluorescence was observed for MSN-NH2-ICG in NaOH, with maximal emission less blue-shifted at 805 nm. Centrifuging these samples and examining their respective supernatants revealed significant leaching of ICG from MSN-NH2-ICG in NaOH (Fig. 3d); likely the result of the strong electrostatic repulsion between the negative charge of the sulfonic groups and the un-modified surface of silanol groups. Very little ICG was found to leach from the MSN-NH2-ICG in neutral or acidic pH aqueous solutions (Fig. 3d).
3.2 Surface Charge Verification of Various MSN Samples
To better assure that surface charge alone and not fluorophore chemistry was responsible for differences in nanoparticle biodistribution and excretion, two different near-infrared probes were used for in vivo tracking: ICG, to enable direct comparison with our previous ionically-conjugated MSN-TA-ICG studies, and Cy5.5. Zeta-potential measurements of MSN-NH2, MSN-NH2-ICG, and MSN-NH2-Cy5.5 were made by automated titration in aqueous solutions with pHs ranging from 2 to 10 (Fig. 3e). MSN loadings of Cy5.5 were adjusted so that MSN-NH2-Cy5.5 and MSN-NH2-ICG had similar zeta surface potentials at pH 7.4 (+36.7 mV vs. +34.4 mV, respectively). In aqueous solutions of acidic to neutral pH, the abundant surface silanol groups (Si-OH) of MSNs that had not been linked to amines became highly protonated. Since the amino-silanol groups themselves also possessed net positive charge, the amine-functionalized MSNs (MSN-NH2) demonstrated very positive zeta surface potentials over a wide range of pH, with little likelihood of nanoparticle aggregation or flocculation. Covalent conjugation of near-infrared fluorophores to the amino groups of MSN-NH2 only slightly reduced the MSN's zeta surface potential between pH 2 and pH 8 – from +48.5 mV at pH 3 to +44.6 mV at pH 7.4 for MSN-NH2, from +34.5 mV at pH 3 to +34.4 mV at pH 7.4 for MSN-NH2-ICG, and from +42.0 mV at pH 3 to +36.7 mV at pH 7.4 for MSN-NH2-Cy5.5 – reflecting the relatively low percentage of amines covalently bonded to fluorescent molecules and the delocalized positive charge of Cy 5.5's chromaphore. Previous studies with the same MSNs but functionalized with TA groups for ionic bonding of ICG (MSN-TA), demonstrated zeta surface potentials of -9.1 mV and +35.7 mV for at pH of 7.4 and 3.0 respectively, and of -17.6 mV and +35.3 mV for MSN-TA-ICG at pH of 7.4 and 3.0 respectively.[26] The much greater variation of zeta surface potential with pH of MSN-TA-ICG samples, from -17.6 mV to +35.5 mV in going from pH 7.4 to pH 3.0, is thought to reflect the increasing protonation of the surface silanol groups (not bonded to ICG) as well as protonation of one of ICG's two negative sulfate groups; leaving one negative sulfate group and one positive pyrrolium group per ICG, for a net molecular charge near zero that did not contribute to the MSN's net surface charge. In contrast, MSN-NH2-ICG exhibited very little (< 2.0 mV) variation in zeta surface charge between pH 7.4 and pH 3.0.
3.3 Surface Charge-Mediated Rapid Hepatobiliary Excretion of MSNs
In vivo biodistribution imaging studies of MSNs were conducted on groups of 6 to 8 week-old male nude mice that had either been fasted for 12 h before imaging, or had been placed on a low autofluorescence rodent chow diets for at least 5 days prior to imaging. Mice, including positive and negative controls, were anesthetized with either gaseous isoflurane or injectable urethane, placed onto 37 °C heated stages, and imaged continuously for fluorescence every 5 min for 4 h immediately following tail-vein bolus injections of 12, 24, or 30 mg/kg of MSN-NH2-ICG or MSN-NH2-Cy5.5 dissolved in 150 μL of sterile Ringers solution. At the end of the first day's imaging session (0 days post-injection; 0 DPI), one mouse was sacrificed by cervical dislocation and its organs (heart, lungs, liver, spleen, kidneys, stomach, large and small intestines, pancreas, bladder, and testicles) harvested for ex vivo fluorescence imaging in the same in vivo imaging system, to correlate anatomy and further quantify photon flux measurements. All remaining animals were survived in metabolic cages – to enable daily collection of urine and feces – and imaged in vivo and ex vivo on 1, 2, and 5 DPI, including each animal's urine and feces. Harvested organs, once imaged ex vivo, were individually frozen intact (unfixed) at -80 °C along with that animal's collected urine and feces, to await preparation for ICP-MS of their silica content. Although feces collection had high efficiency, urine collection did not; with substantial volume losses arising from specimen evaporation on non-accessible surfaces.
Almost immediately following tail-vein injection, both MSN-NH2-ICG and MSN-NH2-Cy5.5 began to appear within the liver, reflecting the approximately 18% of venous circulation that shunts to the liver via the portal vein. Ten minutes following the bolus injection of nanoparticles, nearly all of the MSN-NH2-ICG and MSN-NH2-Cy5.5 had localized to the liver, while after 60 minutes, a significant percentage of MSNs had already migrated into the duodenum via the biliary duct (the profile of MSN-NH2-ICG was shown in Fig. 4). Four hours following their injection, in vivo imaging revealed that the overwhelming majority of MSNs had concentrated within the jejunum and duodenum, with only modest signal emanating from the liver. Interestingly, in addition to the nude mice, the similar migration pattern of MSN-NH2-ICG was also observed in the Male Sprague Dawley rats (weight ca. 250 g) (Fig. 5). It implicates that the hepatobiliary transport of MSN-NH2-ICG from circulation into GI tract is particle- rather than animal-dependent.
Fig. 4.
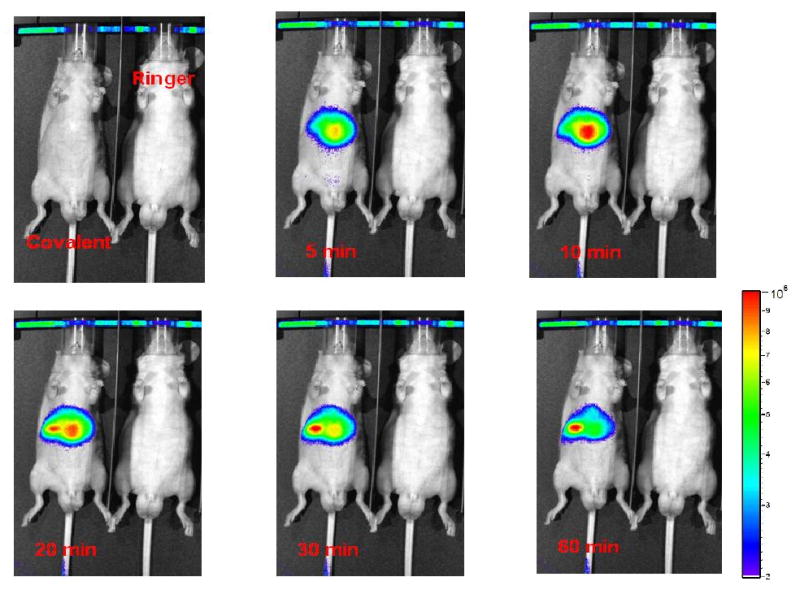
Hepatobiliary transport of MSN-NH2-ICG from circulation into GI tract (left) with control animal for comparison (right). Within 10 min of injection nearly all of the MSN has been sequestered by the liver. After 60 min a significant percentage of MSN have already begun to enter the GI tract – an observation confirmed by subsequent ex vivo fluorescence imaging and ICP-MS of harvested tissues.
Fig. 5.
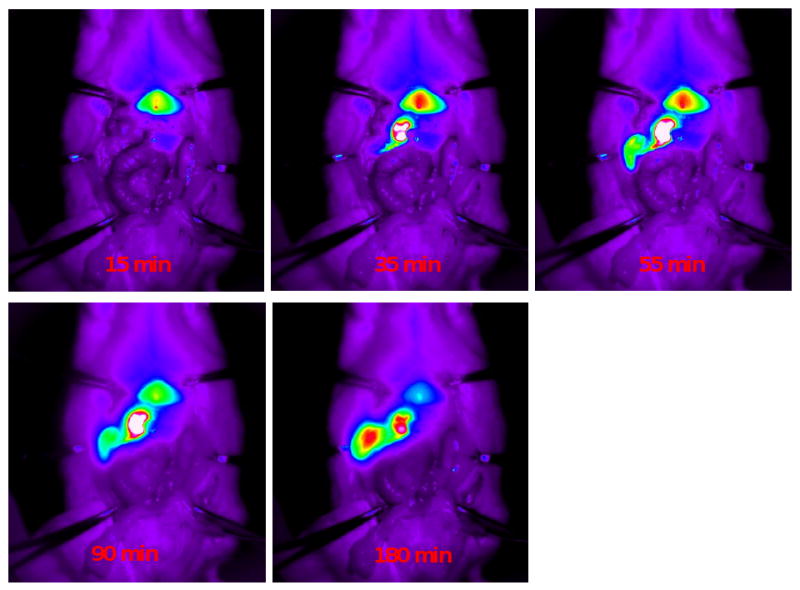
Hepatobiliary dynamic transport of MSN-NH2-ICG from circulation into GI tract in an anesthetized rat following i.v. injection. Within 10 min of injection nearly all of the MSN-NH2-ICG has been sequestered by the liver. After 30 min a substantial percentage of MSN-NH2-ICG has already begun to migrate into the GI tract.
Ex vivo fluorescence imaging of organs harvested on 0 DPI correlated well with in vivo fluorescence imaging of the same animal done minutes earlier; with significant accumulation of MSNs in the duodenum/jejunum, modest amounts remaining in the liver, and a small background signal in stomach (Fig. 6a and 6b). In vivo and ex vivo imaging of mice and organs on subsequent DPIs revealed very little if any MSN retention by the liver or lower gastrointestinal tract. Fluorescence imaging of urine and feces, however, demonstrated most MSN entering hepatobiliary transport to be excreted in feces within 24 hours of nanoparticle injection, with no detectable renal excretion whatsoever (Fig. 6c). Fluorescence imaging of harvested tissues and excrement of mice injected with MSN-NH2-Cy5.5 revealed no differences in MSN distribution or elimination from that of mice injected with MSN-NH2-ICG (Fig. 7).
Fig. 6.
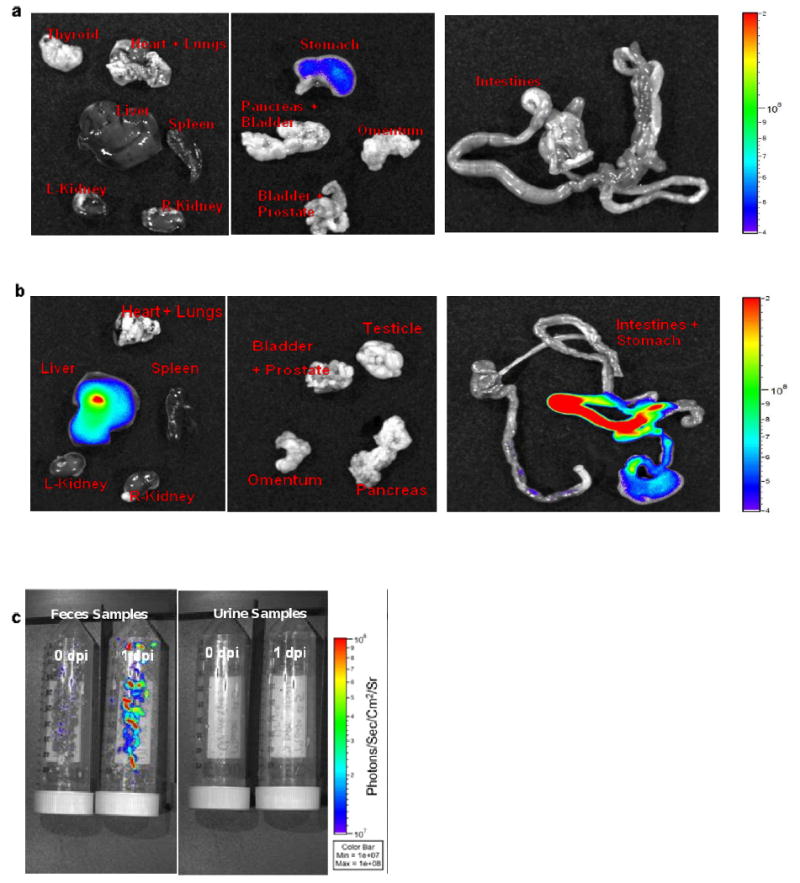
Ex vivo fluorescence imaging of excrement and organs harvested from mice were shown in Fig.6.; (a) the control animal and (b) the treated mouse, ∼3 h following tail-vein injection of 16 mg/kg MSN-NH2-ICG. While similar levels (i.e., dietary background) are seen in the two stomachs, significantly more MSN is apparent in the liver and intestine of the nanoparticle-treated mouse; a finding consistent with the fluorescent imaging of the same two animals' urine and feces (c).
Fig. 7.
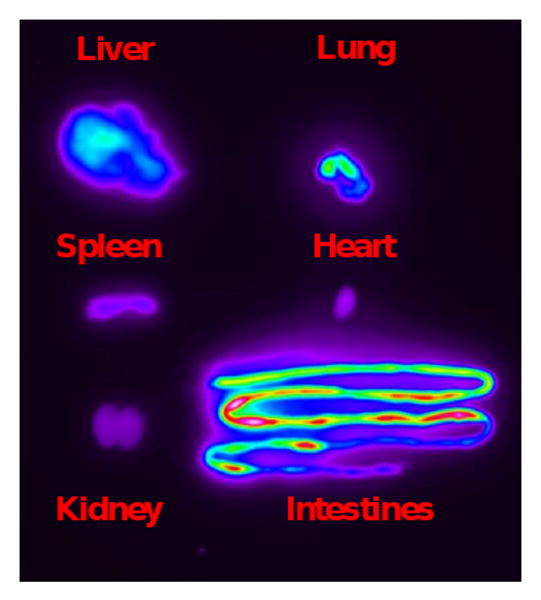
A representative ex vivo image of the bio-distribution of MSN-NH2-Cy5.5 in an 8 week-old, 20 g mouse, obtained via the in vivo optical imaging system 3 h post nanoparticle injection. As with MSN-NH2-ICG, most of the Cy5.5 fluorescence signal is seen emanating from the GI tract after already having undergone hepatobiliary excretion. To preclude intrinsic food fluorescence in the GI tract, each mouse was either fasted for 12 h before an experiment or maintained on a low autofluorescence rodent chow diet for at least 5 days prior to imaging. Following ex vivo fluorescence imaging, organs were analyzed for silicon content by ICP-MS.
3.4 Quantification of Silica Excretion Using ICP-MS
To verify the fluorescence observed during optical imaging was indeed that of intact MSN-NH2-ICG and not simply that of MSN-dissociated ICG, we evaluated harvested tissues and excrement for their silica content using ICP-MS. ICP-MS measurements showed significant uptake of silica by the liver and gastrointestinal tract immediately following injection of MSNs (0 DPI), with rapid elimination from those organs over the next 3 days (Fig. 8b) – consistent with in vivo and ex vivo fluorescence imaging studies. ICP-MS of feces revealed the silica content excreted from MSN-NH2-ICG -injected mice to be well above (>60%) that excreted from mice not given MSN-NH2-ICG (i.e., dietary sources), for each of the 3 days following nanoparticle administration; with peak excretion (>130% above control) occurring on 2 DPI (Fig. 8a). No silica was detected in the urine of either control groups or groups receiving MSN-NH2-ICG; a finding that was consistent with our fluorescence imaging of the same specimens and distinct from the observation of smaller, renally-excreted silica nanoparticles reported recently.[33, 34] Comparison (Fig. 8c), on 3 DPI, of mice injected with MSNs to control animals revealed similar concentrations of silica in spleen (90 ppm) and heart (110 ppm), ∼35% lower concentration in lung (140 ppm), ∼350% higher concentration in kidney (170 ppm), ∼55% higher concentration in intestines (300 ppm), ∼75% higher concentration in feces (1800 ppm), and a trace in liver (30 ppm). These data suggest MSN excretion was still ongoing after 3 days, albeit at a far reduced rate, and may reflect the onset of residual MSN biodegradation into orthosilicic acid (Si(OH)4), that is known to permeate numerous mammalian tissues and undergo eventual renal excretion.[35] The microscopic observation of MSN excretion in liver was further, at least in part, evidenced by TEM measurements. TEM images of 70 nm thick liver-sections harvested from anesthetized mice, 10 min following i.v. injection of 16 mg/kg MSN-NH2-ICG (Fig. 9a) and 3 days following i.v. injection of 16 mg/kg MSN-NH2-ICG (Fig. 9b), were taken for comparison. Although statistically limited by the small areas sampled, several MSNs are readily apparent in the cell cytoplasm (white arrows in Fig. 9a) shortly after probe administration while few could be found in any of the sections made 3 or more days later, suggesting relatively efficacious excretion from the liver.
Fig. 8.
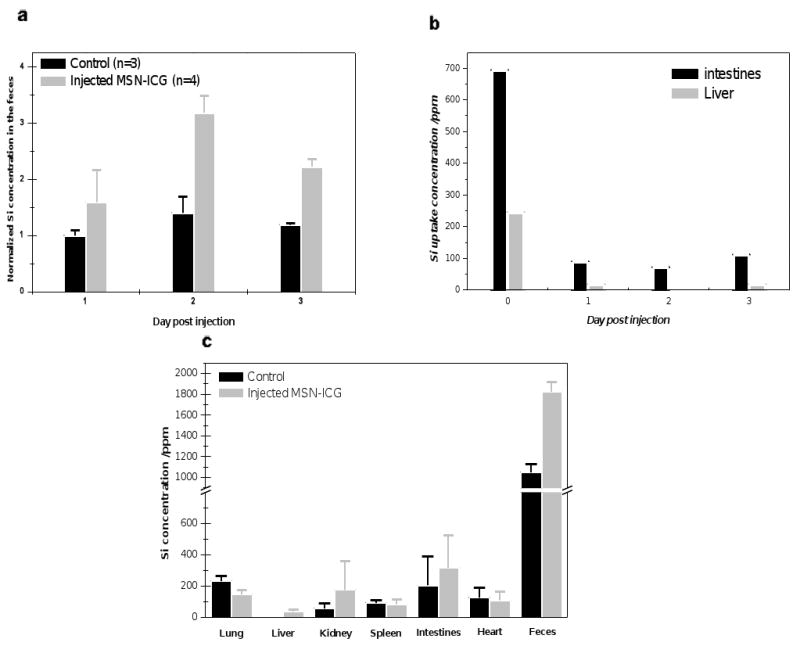
ICP-MS of silicon content in harvested organs and excrement of mice following i.v., injection of 16 mg/kg MSN-NH2-ICG. (a) MSN excretion in feces began immediately, with peak elimination occurring between 1 and 2 days post nanoparticle injection. (b) Approximately 3 h following nanoparticle administration (0 DPI), large numbers of MSNs appear within both intestinal wall (feces-free) and liver, while subsequently excreted MSNs (from liver) are largely confined to feces, as evidenced by the roughly background levels of silicon in the intestines on 1, 2, and 3 DPI and the feces excretion data of (a). (c) Detailed accounting of silicon on 3 DPI, but with cummaltive accounting of fecal silicon, showing levels of silicon roughly that of background (diet-derived).
Fig. 9.
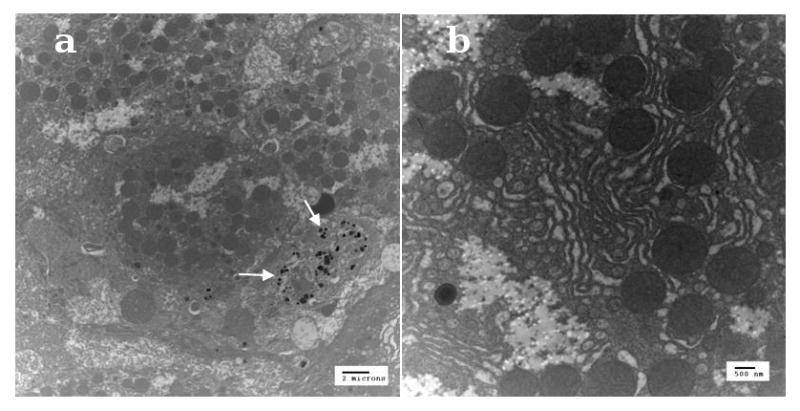
Representative TEM images of 70 nm thick liver-sections harvested from anesthetized mice (a) 10 min following i.v. injection of 16 mg/kg MSN-NH2-ICG (2 um scale-bar) and (b) 3 days following i.v. injection of 16 mg/kg MSN-NH2-ICG (500 nm scale-bar). Although statistically limited by the small areas sampled, several MSNs are readily apparent in the cell cytoplasm (white arrows, left) shortly after probe administration while few could be found in any of the sections made 3 or more days later, suggesting relatively efficacious excretion from the liver.
To quantitatively compare how the surface charge affects the MSN excretion in vivo, the zeta surface potentials of various MSN contrast agents, modified from MSN-NH2 and MSN-TA structures, at different pH values vs. their time of clearance onset in vivo are listed in Table 1. At physiological pH, the MSNs possess more surface charge, such as MSN-NH2-ICG: +34.4 mV, show rapid onset of clearance within 30 min after administration. In contrast, those MSNs with lower surface charge, such as MSN-TA-ICG: -17.6mV and Mag-FITC@MSNs: -16.8 mV, [36] indicate much longer residence in the body for days to months.
Table 1. The zeta surface potentials of MSN samples at different pH values vs. time for in vivo clearance onset.
4. Conclusion
We synthesized mesoporous silica nanoparticles onto which we covalently conjugated the near-infrared fluorophore indocyanine green (MSN-NH2-ICG) – for comparison to our previous in vitro and in vivo studies of the same fluorophore ionically conjugated to the same nanoparticle (MSN-TA-ICG). Nitrogen adsorption-desorption isotherms of unconjugated MSN-NH2 demonstrated surface areas roughly 50%, pore sizes roughly 85%, and accessible pore volumes roughly 29% those of unconjugated MSN-TA. At physiological pH and slightly more acidic conditions, like those found within endosomes, zeta surface potential measurements of MSN-NH2-ICG revealed it to have considerably more surface charge than MSN-TA-ICG: +34.4 mV vs. -17.6 mV, at a pH of 7.4. In vivo fluorescence imaging of mice and ex vivo fluorescence imaging of their harvested tissues and excrement revealed marked differences in nanoparticle bioelimination between the 2 formulations; whereas MSN-TA-ICG was previously shown to possess high uptake and retention in liver, identical but covalently-labeled MSN-NH2-ICG was found to undergo rapid transport into the gastrointestinal tract and subsequent elimination via feces. ICP-MS analysis of organs harvested 3 DPI further suggested a possible onset of nanoparticle biodegradation into orthosilicic acid with potential renal excretion, although this could not be confirmed by secondary means due to inefficiencies in collecting urine specimens and insufficient sensitivity of ex vivo fluorescence imaging. While both MSN-TA-ICG and MSN-NH2-ICG were found to undergo sequestration by the liver, we postulate that the latter's greater surface charge resulted in it being more highly opsonized by serum proteins and thus amenable to hepatobiliary excretion into the gastrointestinal tract. As such, judicious tailoring of the surface charge of MSNs might enable one to control both MSN rates of excretion and MSN biodistribution – a functionality that could lead their widespread clinical use as targetable contrast agents and traceable drug delivery platforms.
Acknowledgments
The study was conducted with the support of the NHRI Intramural Research Grants MED-097-PP-04 and NM-097-PP-03 from National Health Research Institutes of Taiwan; and of the Grant NSC 097-2221-E-400-001 from the National Science Council of Taiwan. The optical imaging session is partially suppoted by NIH grants P30 CA14599 (awarded to the Universiy of Chicago Cancer Research Center) and U54 RR023560 (awarded to the University of Chicago Institute for Translational Medicine), for funding the small animal imaging initiatives.
Footnotes
Publisher's Disclaimer: This is a PDF file of an unedited manuscript that has been accepted for publication. As a service to our customers we are providing this early version of the manuscript. The manuscript will undergo copyediting, typesetting, and review of the resulting proof before it is published in its final citable form. Please note that during the production process errors may be discovered which could affect the content, and all legal disclaimers that apply to the journal pertain.
References
- 1.Gabizon A, Shmeeda H, Barenholz Y. Pharmacokinetics of pegylated liposomal Doxorubicin: review of animal and human studies. Clin Pharmacokinet. 2003;42(5):419–436. doi: 10.2165/00003088-200342050-00002. [DOI] [PubMed] [Google Scholar]
- 2.Tsai CP, Chen CY, Hung Y, Chang FH, Mou CY. Monoclonal antibody-functionalized mesoporous silica nanoparticles (MSN) for selective targeting breast cancer cells. J Mater Chem. 2009;19(32):5737–5743. [Google Scholar]
- 3.DeNardo SJ, DeNardo GL, Miers LA, Natarajan A, Foreman AR, Gruettner C, et al. Development of tumor targeting bioprobes ((111)In-chimeric L6 monoclonal antibody nanoparticles) for alternating magnetic field cancer therapy. Clin Cancer Res. 2005;11(19 Pt 2):7087s–7092s. doi: 10.1158/1078-0432.CCR-1004-0022. [DOI] [PubMed] [Google Scholar]
- 4.Cai W, Shin DW, Chen K, Gheysens O, Cao Q, Wang SX, et al. Peptide-labeled near-infrared quantum dots for imaging tumor vasculature in living subjects. Nano Lett. 2006;6(4):669–676. doi: 10.1021/nl052405t. [DOI] [PubMed] [Google Scholar]
- 5.Simberg D, Duza T, Park JH, Essler M, Pilch J, Zhang L, et al. Biomimetic amplification of nanoparticle homing to tumors. Proc Natl Acad Sci U S A. 2007;104(3):932–936. doi: 10.1073/pnas.0610298104. [DOI] [PMC free article] [PubMed] [Google Scholar]
- 6.Liu Z, Cai W, He L, Nakayama N, Chen K, Sun X, et al. In vivo biodistribution and highly efficient tumour targeting of carbon nanotubes in mice. Nat Nanotechnol. 2007;2(1):47–52. doi: 10.1038/nnano.2006.170. [DOI] [PubMed] [Google Scholar]
- 7.Hardman R. A toxicologic review of quantum dots: toxicity depends on physicochemical and environmental factors. Environ Health Perspect. 2006;114(2):165–172. doi: 10.1289/ehp.8284. [DOI] [PMC free article] [PubMed] [Google Scholar]
- 8.Cheng C, Porter AE, Muller K, Koziol K, Skepper JN, Midgley P, et al. Imaging carbon nanoparticles and related cytotoxicity. J Phys: Conf Ser. 2009;151:012030. [Google Scholar]
- 9.Cho WS, Kim S, Han BS, Son WC, Jeong J. Comparison of gene expression profiles in mice liver following intravenous injection of 4 and 100 nm-sized PEG-coated gold nanoparticles. Toxicol Lett. 2009;191(1):96–102. doi: 10.1016/j.toxlet.2009.08.010. [DOI] [PubMed] [Google Scholar]
- 10.Vertegel AA, Siegel RW, Dordick JS. Silica nanoparticle size influences the structure and enzymatic activity of adsorbed lysozyme. Langmuir. 2004;20(16):6800–6807. doi: 10.1021/la0497200. [DOI] [PubMed] [Google Scholar]
- 11.Li C, Liu H, Sun Y, Wang H, Guo F, Rao S, et al. PAMAM nanoparticles promote acute lung injury by inducing autophagic cell death through the Akt-TSC2-mTOR signaling pathway. J Mol Cell Biol. 2009;1(1):37–45. doi: 10.1093/jmcb/mjp002. [DOI] [PubMed] [Google Scholar]
- 12.Ballou B, Ernst LA, Andreko S, Harper T, Fitzpatrick JAJ, Waggoner AS, et al. Sentinel lymph node imaging using quantum dots in mouse tumor models. Bioconjug Chem. 2007;18(2):389–396. doi: 10.1021/bc060261j. [DOI] [PubMed] [Google Scholar]
- 13.Dobrovolskaia MA, Mcneil SE. Immunological properties of engineered nanomaterials. Nat Nanotechnol. 2007;2(8):469–478. doi: 10.1038/nnano.2007.223. [DOI] [PubMed] [Google Scholar]
- 14.Panyam J, Labhasetwar V. Biodegradable nanoparticles for drug and gene delivery to cells and tissue. Adv Drug Deliv Rev. 2003;55(3):329–347. doi: 10.1016/s0169-409x(02)00228-4. [DOI] [PubMed] [Google Scholar]
- 15.Liu Z, Davis C, Cai W, He L, Chen X, Dai H. Circulation and long-term fate of functionalized, biocompatible single-walled carbon nanotubes in mice probed by Raman spectroscopy. Proc Natl Acad Sci U S A. 2008;105(5):1410–1415. doi: 10.1073/pnas.0707654105. [DOI] [PMC free article] [PubMed] [Google Scholar]
- 16.Balogh L, Nigavekar SS, Nair BM, Lesniak W, Zhang C, Sung LY, et al. Significant effect of size on the in vivo biodistribution of gold composite nanodevices in mouse tumor models. Nanomedicine. 2007;3(4):281–296. doi: 10.1016/j.nano.2007.09.001. [DOI] [PubMed] [Google Scholar]
- 17.Renaud G, Hamilton RL, Havel RJ. Hepatic metabolism of colloidal gold-low-density lipoprotein complexes in the rat: evidence for bulk excretion of lysosomal contents into bile. Hepatology. 1989;9(3):380–392. doi: 10.1002/hep.1840090307. [DOI] [PubMed] [Google Scholar]
- 18.Hardonk MJ, Harms G, Koudstaal J. Zonal heterogeneity of rat hepatocytes in the in vivo uptake of 17 nm colloidal gold granules. Histochemistry. 1985;83(5):473–477. doi: 10.1007/BF00509211. [DOI] [PubMed] [Google Scholar]
- 19.Singh R, Pantarotto D, Lacerda L, Pastorin G, Klumpp C, Prato M, et al. Tissue biodistribution and blood clearance rates of intravenously administered carbon nanotube radiotracers. Proc Natl Acad Sci U S A. 2006;103(9):3357–3362. doi: 10.1073/pnas.0509009103. [DOI] [PMC free article] [PubMed] [Google Scholar]
- 20.Yang ST, Guo W, Lin Y, Deng XY, Wang HF, Sun HF, et al. Biodistribution of pristine single-walled carbon nanotubes in vivo. J Phys Chem C. 2007;111(48):17761–17764. [Google Scholar]
- 21.Alexis F, Pridgen E, Molnar LK, Farokhzad OC. Factors affecting the clearance and biodistribution of polymeric nanoparticles. Mol Pharm. 2008;5(4):505–515. doi: 10.1021/mp800051m. [DOI] [PMC free article] [PubMed] [Google Scholar]
- 22.Longmire M, Choyke PL, Kobayashi H. Clearance properties of nano-sized particles and molecules as imaging agents: considerations and caveats. Nanomedicine (Lond) 2008;3(5):703–717. doi: 10.2217/17435889.3.5.703. [DOI] [PMC free article] [PubMed] [Google Scholar]
- 23.Choi HS, Liu W, Misra P, Tanaka E, Zimmer JP, Itty Ipe B, et al. Renal clearance of quantum dots. Nat Biotechnol. 2007;25(10):1165–1170. doi: 10.1038/nbt1340. [DOI] [PMC free article] [PubMed] [Google Scholar]
- 24.Sadauskas E, Danscher G, Stoltenberg M, Vogel U, Larsen A, Wallin H. Protracted elimination of gold nanoparticles from mouse liver. Nanomedicine. 2009;5(2):162–169. doi: 10.1016/j.nano.2008.11.002. [DOI] [PubMed] [Google Scholar]
- 25.Kumar R, Roy I, Ohulchanskky TY, Vathy LA, Bergey EJ, Sajjad M, et al. ACS Nano. 2010. In Vivo Biodistribution and Clearance Studies Using Multimodal Organically Modified Silica Nanoparticles. ASAP. [DOI] [PMC free article] [PubMed] [Google Scholar]
- 26.Lee CH, Cheng SH, Wang YJ, Chen YC, Chen NT, Souris J, et al. Near-Infrared Mesoporous Silica Nanoparticles for Optical Imaging: Characterization and In Vivo Biodistribution. Adv Funct Mater. 2009;19(2):215–222. [Google Scholar]
- 27.Kesanli B, Lin WB. Mesoporous silica anchored Ru catalysts for highly enantioselective hydrogenation of beta-ketoesters. Chem Commun (Camb) 2004;21(20):2284–2285. doi: 10.1039/b406697a. [DOI] [PubMed] [Google Scholar]
- 28.Wang YJ, Caruso F. Enzyme encapsulation in nanoporous silica spherest. Chem Commun (Camb) 2004;7(13):1528–1529. doi: 10.1039/b403871a. [DOI] [PubMed] [Google Scholar]
- 29.De Vos DE, Dams M, Sels BF, Jacobs PA. Ordered mesoporous and microporous molecular sieves functionalized with transition metal complexes as catalysts for selective organic transformations. Chem Rev. 2002;102(10):3615–3640. doi: 10.1021/cr010368u. [DOI] [PubMed] [Google Scholar]
- 30.Nakanishi K, Tanaka N. Sol-gel with phase separation. Hierarchically porous materials optimized for high-performance liquid chromatography separations. Acc Chem Res. 2007;40(9):863–873. doi: 10.1021/ar600034p. [DOI] [PubMed] [Google Scholar]
- 31.Wang YJ, Bansal V, Zelikin AN, Caruso F. Templated synthesis of single-component polymer capsules and their application in drug delivery. Nano Lett. 2008;8(6):1741–1745. doi: 10.1021/nl080877c. [DOI] [PubMed] [Google Scholar]
- 32.Vallet-Regi M, Balas F, Arcos D. Mesoporous materials for drug delivery. Angew Chem Int Ed Engl. 2007;46(40):7548–7558. doi: 10.1002/anie.200604488. [DOI] [PubMed] [Google Scholar]
- 33.Trewyn BG, Slowing II, Giri S, Chen HT, Lin VSY. Synthesis and functionalization of a mesoporous silica nanoparticle based on the sol-gel process and applications in controlled release. Acc Chem Res. 2007;40(9):846–853. doi: 10.1021/ar600032u. [DOI] [PubMed] [Google Scholar]
- 34.Tsai CP, Hung Y, Chou YH, Huang DM, Hsiao JK, Chang C, et al. High-contrast paramagnetic fluorescent mesoporous silica nanorods as a multifunctional cell-imaging probe. Small. 2008;4(2):186–191. doi: 10.1002/smll.200700457. [DOI] [PubMed] [Google Scholar]
- 35.Lu CW, Hung Y, Hsiao JK, Yao M, Chung TH, Lin YS, et al. Bifunctional magnetic silica nanoparticles for highly efficient human stem cell labeling. Nano Lett. 2007;7(1):149–154. doi: 10.1021/nl0624263. [DOI] [PubMed] [Google Scholar]
- 36.Lu J, Choi E, Tamanoi F, Zink JI. Light-activated nanoimpeller-controlled drug release in cancer cells. Small. 2008;4(4):421–426. doi: 10.1002/smll.200700903. [DOI] [PMC free article] [PubMed] [Google Scholar]
- 37.Huang DM, Hung Y, Ko BS, Hsu SC, Chen WH, Chien CL, et al. Highly efficient cellular labeling of mesoporous nanoparticles in human mesenchymal stem cells: implication for stem cell tracking. FASEB J. 2005;19(12):2014–+. doi: 10.1096/fj.05-4288fje. [DOI] [PubMed] [Google Scholar]
- 38.Xing X, He X, Peng J, Wang K, Tan W. Uptake of silica-coated nanoparticles by HeLa cells. J Nanosci Nanotechnol. 2005;5(10):1688–1693. doi: 10.1166/jnn.2005.199. [DOI] [PubMed] [Google Scholar]
- 39.Giri S, Trewyn BG, Stellmaker MP, Lin VSY. Stimuli-responsive controlled-release delivery system based on mesoporous silica nanorods capped with magnetic nanoparticles. Angew Chem Int Ed Engl. 2005;44(32):5038–5044. doi: 10.1002/anie.200501819. [DOI] [PubMed] [Google Scholar]
- 40.Burns AA, Vider J, Ow H, Herz E, Penate-Medina O, Baumgart M, et al. Fluorescent silica nanoparticles with efficient urinary excretion for nanomedicine. Nano Lett. 2009;9(1):442–448. doi: 10.1021/nl803405h. [DOI] [PMC free article] [PubMed] [Google Scholar]
- 41.He X, Nie H, Wang K, Tan W, Wu X, Zhang P. In vivo study of biodistribution and urinary excretion of surface-modified silica nanoparticles. Anal Chem. 2008;80(24):9597–9603. doi: 10.1021/ac801882g. [DOI] [PubMed] [Google Scholar]
- 42.Park JH, Gu L, von Maltzahn G, Ruoslahti E, Bhatia SN, Sailor MJ. Biodegradable luminescent porous silicon nanoparticles for in vivo applications. Nat Mater. 2009;8(4):331–336. doi: 10.1038/nmat2398. [DOI] [PMC free article] [PubMed] [Google Scholar]
- 43.Wu SH, Lin YS, Hung Y, Chou YH, Hsu YH, Chang C, et al. Multifunctional mesoporous silica nanoparticles for intracellular labeling and animal magnetic resonance imaging studies. Chembiochem. 2008;9(1):53–57. doi: 10.1002/cbic.200700509. [DOI] [PubMed] [Google Scholar]