

Abstract
Olfactory bulb ensheathing glia (OB-OEG) promote repair of spinal cord injury (SCI) in rats after transplantation at acute or subacute (up to 45 days) stages. The most relevant clinical scenario in humans, however, is chronic SCI, in which no more major cellular or molecular changes occur at the injury site; this occurs after the third month in rodents. Whether adult OB-OEG grafts promote repair of severe chronic SCI has not been previously addressed. Rats with complete SCI that were transplanted with OB-OEG 4 months after injury exhibited progressive improvement in motor function and axonal regeneration from different brainstem nuclei across and beyond the SCI site. A positive correlation between motor outcome and axonal regeneration suggested a role for brainstem neurons in the recovery. Functional and histological outcomes did not differ at subacute or chronic stages. Thus, autologous transplantation is a feasible approach as there is time for patient stabilization and OEG preparation in human chronic SCI; the healing effects of OB-OEG on established injuries may offer new therapeutic opportunities for chronic SCI patients.
Keywords: Axonal regeneration, Chronic transplantation, Functional recovery, Glial scar, Paraplegia
INTRODUCTION
Most spinal cord injuries (SCI) cause permanent and irreversible functional deficits. The devastating prognosis for people suffering severe SCI has provided an impetus to search for therapies aimed at curing this chronic pathology; the use of olfactory ensheathing glia (OEG) transplantation is a promising repair strategy. There are more than 40 articles that show positive effects of OEG after SCI of various types and severities (1); most of these follow spinal cord trauma (2–9), including contusion (10), but there are 13 studies that show no or limited beneficial effects. The differences seem related to the sources of cells, ages of the animals and the methods used for culture and transplantation. After the third week in vitro, adult rodent olfactory bulb (OB)-OEG become senescent and have an associated change in phenotype (11). Thus, grafting of older cultures may compromise cell survival and/or migration (12–15). Whether to use OEG from the olfactory bulb (central) or from the epithelium (peripheral) is also a debated issue. Mucosally derived OEG are more accessible, but they seem to have inferior migratory and growth-promoting properties (16–18) compared to bulbar OEG (2–9). Based on these studies and the prospect for autologous therapy, we used adult non-senescent OEG of bulbar origin in this study.
In the majority of previous studies, OEG have been transplanted immediately after SCI (the acute stage). Since many patients take several weeks or even months for clinical stabilization, however, a delayed transplant paradigm would be more clinically relevant. Moreover, if autologous transplantation is to be used, cell preparation requires time. Hence, an intervention several months after SCI is a more realistic paradigm. Experimental OB-OEG grafting has been delayed for 7 and 30 days (10, 19), but never beyond 45 days (20), which has been considered to be the subacute stage (21, 22). In the absence of further manipulation and when no more cellular and molecular changes occur, SCIs are considered to be at the chronic stage, which is after the third month in rodents (21, 22). Here, we determined the repair efficacy of OB-OEG grafted at the chronic stage into the injury site and after complete SCI to evaluate regeneration rather than plasticity of spared fibers. We also compared functional and histological outcomes with grafting at the subacute stage and quantified the regeneration of relevant descending motor tracts at both subacute and chronic stages.
MATERIALS AND METHODS
The experimental procedures adhered to the recommendations of the European Union and the United States Department of Health for the care and use of laboratory animals and were approved by the Ethics Committee of our institution.
OEG Cultures from Adult Olfactory Bulbs
OB-OEG primary cultures were obtained from the first 2 olfactory bulb layers of 2- to 2.5-month-old Wistar Hannover rats (Harlan Laboratories, Barcelona, Spain). p75 receptor-expressing OB-OEG were purified 7 days after plating, as previously reported (2, 11). They were cultured in D/F-10S (1:1 DMEM:Ham’s F-12, Gibco-Invitrogen, Madrid, Spain; 10% fetal bovine serum) at 37°C, 5% CO2. At 2 days after purification, 2 μM forskolin (Sigma-Aldrich Química, Madrid, Spain) and 20 μg/ml bovine pituitary extract (Biomedical Technologies, Inc., Stoughton, MA) were added. Pure p75-OEG were expanded for less than 2 weeks to avoid senescence (11). Cells were detached from the flasks, labeled with bisbenzimide (Hoechst 33342; Sigma-Aldrich Química) and transplanted at a density of 100,000 cells/μl in Dulbecco’s Modified Eagle’s Medium (DMEM), as previously described (2, 4, 23, 24).
Surgery and OB-OEG Transplantation
Adult female Wistar Hannover rats (2.5 to 3 months of age, 200–230 grams, n = 28) were anesthetized with isofluorane and N2:O2 (40:60) and a laminectomy to expose T8–T9 segments was performed. In 22 of the animals, the dura was opened and the spinal cords completely sectioned using microscissors. The stumps were lifted to ensure completeness of the lesion (Fig. 1A) (4).
Figure 1.

Appearance of the surgical field during different phases of the procedure. (A) After spinal cord transection, both stumps were lifted to ensure completeness of the lesion. (B) Spinal cord stumps were placed back into the vertebral channel apposing one another. (C–F) Lesion region during the second surgery (access to the spinal cord for transplantation). (C) The resin bridge (arrow) is firmly sealed to the spinous processes and laminae of adjacent intact vertebrae. (D) After bridge removal, a dense layer of connective tissue (arrowheads) was removed to expose the underlying spinal cord (arrow). (E) Dorsal aspect of both spinal cord stumps 4 months after complete transection. (F) Transplantation of olfactory bulb-ensheathing glia (OB-OEG) using a glass micro-needle (arrow). Inset: a detail of an OB-OEG culture used for transplantation and immunolabeled with anti-p75. Arrows in A, B and E indicate the transection sites.
The paraplegic animals were then divided into 3 groups: i) subacute (SA), ii) chronic (Chr) and iii) non-transplanted (Non-T) in a second surgery. SA rats (n = 5) were transplanted with p75 OB-OEG at 1 month and Chr (n = 5) at 4 months after SCI. Non-T animals (n = 12) were not transplanted but were injected with DMEM after 1 (n = 6) or 4 (n = 6) months. In the sham operated group, 6 more animals were not transected but received a second surgery after 1 (n = 3) and 4 (n = 3) months. In the second surgery, the connective tissue formed underneath the resin bridge and above the spinal cord (Fig. 1D) was removed to expose the injury region. Glial and fibrous scars, created between the spinal cord stumps, were not removed (Fig. 1E). OB-OEG were stereotaxically grafted into both caudal and rostral intact spinal cord stumps, at 1 mm from the stump border, as previously described (4, 23) (Fig. 1F). Cells were injected in the midline of each stump, from ventral to dorsal, into 4 sites at 1.3, 1.0, 0.8 and 0.5 mm, respectively. Each site received 0.5 μl of 50,000 OEG (200,000 per stump). Non-T animals were injected with 0.5 μl of DMEM instead and sham controls were not injected.
In both surgeries, spinal cords were covered with durafilm (Ferrosan, London, UK). Vertebral columns were stabilized placing a resin bridge between adjacent vertebrae (Fig. 1C) made of an autopolymerizing acrylic resin (Duralay; Reliance Dental Manufacturing Co., Worth, IL) (25, 26).
Animal Care, Physiotherapy and Rehabilitation
Immediately after surgery, 1 ml of lactate Ringer’s solution and analgesic magnesium metamizol (Nolotil, Boehringer Ingelheim, Barcelona, Spain) were administered subcutaneously. An antibiotic, Augmentine (amoxiciline/clavulanic acid, 1 g/200 mg, GlaxoSmithKline, Madrid, Spain) was also administered and twice more every 8 hours.
Urinary bladder was manually expressed 4 times a day until autonomous voidance and then once daily. Detailed postoperative care has been described (27). To keep paraplegic rats in good condition they received active and passive range of motion. Active range of motion was performed using the climbing test (Appendix 1) once a week. Daily passive range of motion included movement of joints below the level of injury (25 times each joint) and massages of muscles and skin over bone prominences.
All animals were allowed to survive for 12 months after the first surgery (lesion surgery) and subjected to a third surgery for tracer injection (see below). All paraplegic animals with a complete lesion had to be maintained in good and stable clinical condition for 1 year. Paraplegic animals had 2 additional surgeries for OB-OEG transplantation and tracer injection. At the time of the last surgery, the animals were not only paraplegic but also aged (15 months old); animal care was adapted from those used for humans (27).
Functional Analysis
A detailed description of the climbing test used in this study was previously reported (4) and is described in Appendix 1 and presented as supplemental data (see Video, Supplemental Digital Content 1, http://links.lww.com/NEN/A62). Training started when the animals were 1 month old and continued until the first surgery. Comparison of the performance of transplanted and non-transplanted rats started 1 month after the first surgery (lesion) (Fig 2).
Figure 2.
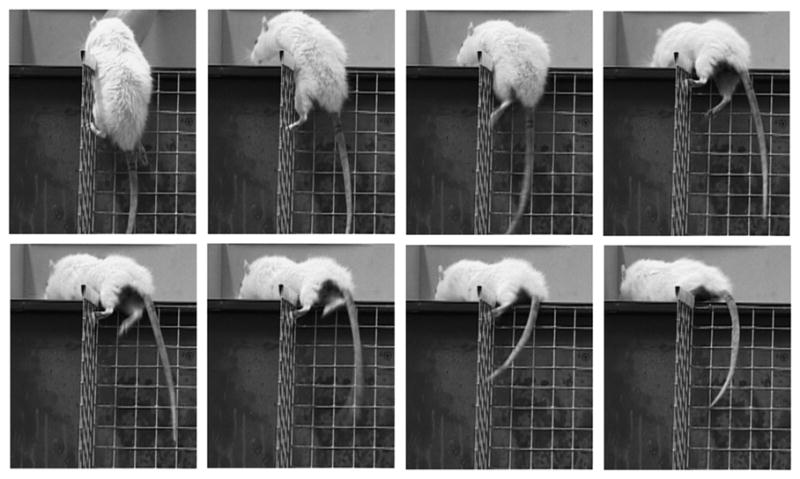
Video frames of a paraplegic rat transplanted with olfactory bulb-ensheathing glia at the chronic stage, achieving the third climbing level, 5 months after transplantation. Detail of the hind limb movement indicates that this rat supports its weight and propels its body to reach the horizontal platform. The video of this animal is part of Video, Supplemental Digital Content 1, http://links.lww.com/NEN/A62.
Tracer injection
At 12 months after lesion, all animals underwent a third surgery for tracer injection. A cocktail of 25% horseradish peroxidase (HRP) and 5% wheat germ agglutinin (WGA)-HRP (Sigma-Aldrich Química) in 0.9% NaCl was injected stereotaxically into the caudal stump, at 0.5 cm from its edge as before (3). Briefly, peroxidase was injected into 13 sites (0.1 μl/site) ventro-dorsally in the midline (5 injections) and at 0.8 mm to the left and right (4 injections in each side) at 2, 1.6, 1.2, 0.8, and 0.4 mm in the midline; 1.6, 1.2, 0.8, 0.4 mm in left and right sides. Rats were allowed to survive 48 hours before perfusion. This retrograde tracer is endocytosed by axons either passing through or terminating at the site of injection; hence it identifies axons regenerating at least 0.5 cm beyond the lesion.
Histological Processing
Animals were perfused with 4% paraformaldehyde; the spinal cords and brainstems were dissected and post-fixed for 5 hours. Coronal sections of the brainstems and longitudinal sagittal sections of the spinal cords were cut in a cryostat (−20°C, 20-μm sections). Consecutive sections of the whole structures were collected onto different slides and processed for peroxidase detection and immunohistochemistry.
For peroxidase detection, the entire brainstem was sectioned at 20 μm and sections were collected sequentially to locate each region of interest. For peroxidase detection, equally spaced sections (100 μm) were processed through the entire brainstem. In these sections, the peroxidase-labeled somata were detected with the chromogen diaminobenzidine (DAB, Vector Laboratories, Burlingame, CA). To increase the signal, sections were also labeled with an antibody against wheat germ agglutinin (anti-WGA, 1/250, overnight at 4°C) and a biotinylated -conjugated secondary antibody (1/200, 45 minutes), then stained using the Vectastain Elite ABC Standard Kit (antibodies and kit from Vector). Spinal cord sections of 3 animals per group (n = 9) were also processed as described above to determine whether peroxidase diffused beyond the injury region (see Figure, Supplmental Digital Content 2, http://links.lww.com/NEN/A63).
Spinal cord sections containing the entire injury region and 2 segments above and below (i.e. from T6 to T10) were immunostained (Appendix 2). Since the sections were collected sequentially, we could identify the precise location of each section. Depending on the type of analysis (see below), these sections were incubated overnight at 4°C with the following primary antibodies: polyclonal rabbit anti-glial fibrillary acidic protein (GFAP, Dako, Barcelona, Spain; 1/500) to label reactive astroglia and to delimit the glial scar; monoclonal mouse anti-neurofilament (NFL, Hybridoma Bank RT 97,Iowa City, Iowa; 1/1500) to stain axons; and polyclonal rabbit anti-Rat S100 (Dako; 1/100) to distinguish OEG. The following day, sections were incubated with the respective secondary antibodies conjugated with Texas Red (Jackson Immunoresearch, West Grove, PA; 1/500) or Oregon Green (Molecular Probes-Invitrogen, Barcelona, Spain; 1/500), for 45 minutes at room temperature. Labeled sections were mounted with Fluoromount (SouthernBiotech, Birmingham, AL) and coverslipped.
Quantification Methods at the Injury Site
Quantification of Tissue Degeneration
Every fifth section of the entire spinal cord separated by 100 μm (total = 28/animal) was analyzed. Fibrous scar and cavities, a direct consequence of tissue degeneration, are GFAP-negative and were quantified by measuring the volume of GFAP-negative tissue at the injury site. In each GFAP-labeled section the lesion area was digitalized using a Leica microscope. In each section, fibrous scar and cystic areas (GFAP = negative tissue) were outlined and measured (μm2) using the image analysis program Metamorph and volumes were calculated as previously described (28, 29). Briefly, individual “subvolumes,” which correspond to the area in 1 section multiplied by the distance to the next (100 μm), were summed.
Quantification of Axons
Sections adjacent to those used for the quantification of tissue degeneration (n = 28, also separated by 100 μm) were double-stained with anti-GFAP to define the borders of the GFAP-positive glial scar and with anti-neurofilament to detect axons. Quantification was done within the GFAP-negative fibrous scar. From the total number of pixels in this region determined by image analysis, the percentages of those showing anti-neurofilament labeling were calculated. The averages of the percentages per rat were used for group comparisons.
Quantification of Neuronal Regeneration
Every fifth section of the whole brainstem was used for quantifying numbers of peroxidase-traced neurons. Since sections were collected in order, the precise location within the brainstem of each section was known and specific nuclei could be identified following the Paxinos and Watson atlas (30). A distance between sections of 100 μm avoided double or triple counting the same neuron in adjacent sections. Peroxidase-containing somata were identified by their cytoplasmic brown DAB chromogen reaction and counted using a Leica microscope. Sections used for counting in each nucleus, and per rat, included i) red nucleus: 14 (left) and 14 (right); ii) reticular formation: 66; iii) locus coeruleus: 20 (left) and 20 (right); iv) vestibular nucleus: 26 (left) and 26 (right); v) raphe nucleus: 60. Images of sections were taken at 10x magnification using a camera (Leica DFC300 FX) attached to the microscope.
Statistical Analysis
The variables of the behavioral recovery study were ordered categories (31). Each climbing grid was placed at an increasing angle from the horizontal plane and, thus, has a higher slope than the previous with each slope corresponding to 1 level of difficulty for the animals (Appendix 1). Scores to each ordinal category or slope and named them “climbing levels” (1<2<3<4) were assigned. For ordinal categories, non-parametric Kruskal-Wallis and Mann-Whitney U tests are most appropriate (32). We used the former test to compare the ability of the non-transplanted, OEG-transplanted and Sham groups to climb the 4 different climbing levels at both SA and Chr stages. Post hoc “Conover-Inman for pair-wise comparison” was used (33). Mann-Whitney U test was used to compare the ability to succeed in the climbing test of non-transplanted vs. OEG-transplanted groups at SA and Chr stages. Kruskal-Wallis test was used to evaluate the significance of the time-dependent improvement in function observed within the same group and between groups. Statistical analyses of differences between groups in the number of regenerated neurons (total and nuclei by nuclei) and the extent of tissue degeneration at the injury site were also made by nonparametric Kruskal-Wallis and Mann-Whitney tests. Non-parametric statistics were used because the experimental groups had fewer than 10 animals. Data are presented as the mean ± SEM. In all cases, differences were considered significant if p < 0.05. Linear regression analysis was used to evaluate the correlation between functional recovery and the number of neurons regenerating axons from individual animals.
For an estimation of the temporary progression of the functional recovery per rat, a score for each animal was calculated by summing the level achieved in the climbing test at each month during the testing period. These scores were also correlated by linear regression with the number of regenerated neurons from individual animals.
RESULTS
All animals survived following injury and after the following 2 surgeries (transplantation and tracer injection), except for one Non-T rat that died during the second surgery (DMEM injection); 4 more Non-T rats died at 1, 1.5, 2 and 4 months after the second surgery due to autonomic dysreflexia or unknown causes. One Non-T rat was eliminated from the study because it developed autotomy of its hind limb. Thus, 6 rats were used as Non-T controls. Strikingly, none of the OB-OEG grafted rats had any complication and just 1 animal from the Chr group died at the very end of the study (11.5 months after injury).
OB-OEG-Transplantation Improved Voluntary Hind Limb Movement
All transplanted and non-transplanted SCI rats had flaccid hind limb paralysis. We started to test the climbing ability of all animals 1 month after lesion. During the whole period, Non-T rats of either group (second surgery after 1 or 4 months) did not show any difference in performance (p = 0.794 and p = 0.770, respectively). This is in agreement with previous studies showing the absence of histological differences after culture medium injection (10). In addition, this indicates that the second surgery and our injection protocol were innocuous and did not interfere with the normal progression of tissue changes. Because all paraplegic Non-T rats were not statistically different they were considered as a single group (n = 6).
Rats from both SA and Chr groups behaved as Non-T rats in the climbing test before transplantation. We started comparing the climbing behavior of OB-OEG grafted and non-grafted rats from the first month post-grafting, which corresponds to the second month post-lesion for the SA group and the fifth for the Chr group (Fig. 3C).
Figure 3.

Functional recovery of paraplegic rats after olfactory bulb-ensheathing glia transplantation at subacute (SA) and chronic (Chr) stages. (A, B) Levels achieved in the climbing test by (A) non-transplanted (Non-T) and SA, and by (B) Non-T and Chr rats at 3, 5 and 7 months post-grafting. Transplanted rats showed a functional recovery significantly higher than Non-T (SA: p < 0.001 and Chr: p = 0.001). Differences started to be significant from month 6 in SA rats (month 6: p = 0.029, months 7 and 8: p = 0.020), and from month 7 in Chr (p = 0.045). There were no differences between SA and Chr groups (compare A and B). (C) Progression of the functional outcome in all groups from the first month post-lesion until the end of the survival period (month 12). Each point represents the percentage of functional recovery exhibited by animals of each group. Dashed lines show the periods used to compare the outcome of Non-T vs. SA (long dash) and Non-T vs. Chr animals (short dash) from the first to the eighth month post-grafting. Non-T animals (grey rhombi) showed a slight but insignificant recovery. Before grafting, Chr and SA groups behaved as Non-T animals. SA group (black circles) and Chr (black triangles) started improving 2 months after transplantation (3 and 6 months post-lesion, respectively). Improvement of SA and Chr rats commenced at the second month, and began to be significant from the fifth (p = 0.004) and fourth months (p = 0.021), respectively.
Functional Recovery After Grafting at the Subacute Stage
All SA transplanted rats succeeded in performing the climbing test (Fig. 3A). There was a significant functional improvement of SA group in the ability to climb with compared to the Non-T group (p < 0.001). OB-OEG grafted rats showed a progressive improvement in climbing abilities and, from the second month after transplantation, differences between SA and Non-T rats became evident. At this time, 2 out of 5 SA rats (40%) achieved level 1; a month later, 1 of these rats improved up to level 2, and a third reached level 1. At 5 months post-grafting, all SA rats succeeded in the climbing test: 1 achieved level 3 and 4 (80%) reached level one. By comparison, half of Non-T rats (50%) failed to perform any climbing level. Although the remaining exhibited some spontaneous improvement, the recovery of Non-T rats was never comparable to that of transplanted animals. Only 1 of 6 Non-T rats overcame level 1 at the second month post-injury and was the only rat that improved thereafter. After the fourth and fifth months, respectively, another 2 rats achieved the lowest climbing level, but with no further improvement (Fig. 3A). By comparison, SA animals showed significantly better scores in the climbing test and continued improving function after the fifth month. At 7 months after OB-OEG transplantation, SA rats reached their maximum functional recovery, 4 of them (80%) achieving level 3 and 1 achieved level 2 (Fig. 3A). A monthly comparison of functional outcome showed significant differences between SA and Non-T groups from the sixth month after transplantation until the end of the experiment. Conover-Inman post hoc values were p = 0.0145 at the sixth month and p = 0.0095 at the seventh month. Mann-Whitney U test also showed a significance of p = 0.029 at month 6 and p = 0.020 at month 7 and later. After the fifth month post-grafting, the climbing performance exhibited by OB-OEG transplanted rats was better than at the first (p = 0.004) and second months (p = 0.042). This time-dependent recovery was improved further at seventh month. Climbing performance at the seventh month was significantly better than that at first (p = 0.004), second (p = 0.006) and third and fourth months (p = 0.009, both). By comparison, Non-T animals did not improve their climbing abilities with time and the spontaneous outcome exhibited by some of them did not have statistical significance.
Functional Recovery After Grafting at the Chronic Stage
Before transplantation Chr rats behaved in the climbing test similar to Non-T rats, and after transplantation (4 months after injury) they recovered function more than Non-T rats (p = 0.002). One Non-T and 2 Chr rats showed some spontaneous recovery just before the second surgery (4 months post-lesion) by achieving the lowest climbing level (not shown). The functional capabilities of the 2 Chr rats showing some recovery were not diminished after OB-OEG injection, suggesting proper integration of the graft within the cord parenchyma and indicating that the transplantation can be performed safely after a chronic SCI.
Chr rats improved motor function significantly more than Non-T rats (p = 0.002) and improvement was progressive (p = 0.016) (Fig. 3B). Chr rats had improved motor function 2 months (6 post-lesion) after grafting. At this period 3 rats achieved level 1 and, a month later, they had improved to level 2 or 3. All Chr rats were able to climb at least level 1 at 4 months after grafting. At the fifth month, 3 out of 5 rats achieved level 3, 1 achieved level 2 and the other level 1. These animals gained their maximum functional recovery after the seventh month and this was significantly different from the maximum climbing performance achieved by Non-T rats (Conover-Inman p = 0.0299, Mann-Whitney U test p = 0.045). The recovery level of the Chr rats was higher at 4 months post-grafting than at 1 (p = 0.021) and 2 months (p = 0.033). These differences remained significant and increased further at the seventh month (p = 0.013 vs. month 1; p = 0.016 vs. month 2) (Fig. 3C).
Comparison Between Transplanted Groups at Subacute and Chronic Stages
Despite the transplantation delay (1 or 4 months), SA and Chr rats started recovering motor function after the second month post-grafting and continued doing so during the following months. There were no differences in climbing performance at any month post grafting (p between 0.1 and 0.635) reaching the maximum at seventh month. All transplanted rats showed hind limb movement, plantar placement of the paws and the body weight support necessary to succeed in the test) independent of the stage of transplantation (n = 10). At the end of the study, regardless of the transplantation delay, 70% of all OEG grafted rats were able to reach the platform by climbing from level 3, 10% climbing from the level 2 and 20% from level 1. All (100%) rats from SA and Chr groups had accomplished the climbing test by the fifth and fourth months, respectively. At these post-grafting testing periods the climbing performance significantly exceeded the previous test period (p = 0.004 and p = 0.021 respectively).
Tissue Repair After SCI by OB-OEG Grafts
Evaluation of Transplantation Effects on Scarring
Macroscopically, in all transplanted rats there was a white and opaque tissue at the injury site bridging both cord stumps (Fig. 4A, B), suggesting some quantitative differences in the tissue. This property was not observed in Non-T animals in which the bridge region appeared thin and translucent (Fig. 4C). By microscopy, all injured spinal cords showed an interruption of GFAP immunolabeling at the lesion over the entire spinal cord width indicating that transection was complete (Fig. 5).
Figure 4.

Transection sites of olfactory bulb-ensheathing glia-grafted and non-transplanted spinal cords 12 months after lesion. Representative macroscopic images from subacute (SA) (A) and chronic (Chr) (B) transplanted rats and from a non-transplanted (Non-T) rat. Rostral and caudal stumps in all transplanted cords were bridged by white, opaque tissue (A, B); cord stumps in non-T rats were joined by a translucent membrane (C).
Figure 5.

Longitudinal spinal cord sections showing areas used for quantification of glial-fibrillary acidic protein (GFAP)-negative tissue at the injury site. Sections of non-transferred (A) and transplanted (B) spinal cords immunolabeled with anti-GFAP. Encircled lines represent both GFAP-negative fibrous scar (arrows) and cysts (without arrows). The widths of the cords were also measured in these sections (horizontal lines in A and B). Top: rostral; bottom: caudal.
The Hoechst dye was not transferred from OB-OEG to cells of the host spinal cords (Figure, Supplemental Digital Content 3, http://links.lww.com/NEN/A64). The distribution of OB-OEG within the spinal cord was the same as previously described after transplantation at the acute stage (3, 4). Briefly, OB-OEG migrated from the injection sites and invaded the glial and fibrous scars. They intermingled with reactive astrocytes and the inhibitory fibrous scar did not hinder their migration (Figure, Supplemental Digital Content 3, http://links.lww.com/NEN/A64). To quantify the effect of OB-OEG on tissue repair and scarring, we calculated the volume of GFAP-negative tissue (fibrous scar) and cavities formed between GFAP-positive stumps (Fig. 5). Both volumes (fibrous scar and cavities) were added together since they provide a measure of trauma-induced degeneration. The mean volume of GFAP-negative tissue was larger in Non-T group (4.93 ± 0.96 mm3) as compared to SA (2.42 ± 0.34 mm3, p = 0.009) and Chr (2.14 ± 0.57 mm3, p = 0.05 for Chr) groups (Fig. 5). Therefore, the amount of fibrosis and necrosis was double in non-grafted spinal cords compared to grafted ones. This indicates that OB-OEG favored either the formation of new tissue and better stump healing and/or the decrease of tissue loss in the case of SA rats, thereby helping spinal cord repair at the lesion site. There were no significant differences in the values between rats transplanted at SA and Chr stages (p = 0.624). Thus, the efficacy of OB-OEG in spinal cord preservation at the injury appears to be independent of the timing of transplantation. The volume of GFAP-negative fibrosis and cysts was inversely related to the maximum functional levels in the climbing test (r = −0.800; p < 0.001). Therefore, better tissue preservation in OB-OEG grafted rats seemed to help axonal regeneration across the lesion.
Transplantation Promotes Axonal Regeneration of Brainstem Neurons Beyond the Scar
Axons unable to cross the injury site tend to sprout more profusely in the scar than axons elongating straight beyond. Consequently, non-treated animals may have more fibers within the scar than animals showing axonal regeneration. Although this makes neurofilament labeling at the scar not a very accurate method for quantification of axonal regeneration, we wanted to have an estimate of the number of fibers invading the injury region. We observed neurofilament-immunolabeled axons entering the scars in both grafted and Non-T spinal cords. There were no group differences in the number of pixels representing neurofilament-positive sprouts within the scar tissue of SA, Chr and Non-T rats (p = 0.462).
To quantify axonal regeneration beyond the lesion we injected the retrograde tracer at 0.5 cm from the rostral border of the caudal stump. We observed no inadvertent leakage or spread of the tracer rostrally into the lesion by analyzing the spinal cords of 3 animals from each group. The retrograde tracer did not reach the injury site or the edge of the caudal stump, but remained within the caudal cord (Figure, Supplmental Digital Content 2, http://links.lww.com/NEN/A63). Since the tracer was injected at 0.5 from the lesion, only axons crossing the injury region, invading the caudal stump and growing at least 0.5 cm beyond could pick up the tracer Thus, all neurons containing peroxidase were regenerating neurons whose axons grew 0.5 cm or more far down into the caudal stump. Retrograde peroxidase-labeled neurons were counted in 5 brainstem nuclei relevant for the initiation and modulation of locomotor patterns. All nuclei examined contained HRP-labeled neurons (Fig. 6). The mean total number of peroxidase-labeled neurons in the brainstem of sham rats was 16,399 ± 609 (n = 3). This value was 5,203 ± 1,116 in SA rats and 6,330 ± 1,176 in Chr group. The total number of neurons regenerating their axons beyond the lesion was more than twice in OB-OEG grafted animals (either SA or Chr) compared to Non-T rats (2,198 ± 416) (p < 0.018) (Fig. 7). Significance was greater when analysis was performed comparing individual nuclei: reticular formation (SA: p = 0.006; Chr: p = 0.011); vestibular nucleus (SA: p = 0.018; Chr: p = 0.019); locus coeruleus (SA: p = 0.018; Chr: p = 0.033); red nucleus (SA: p = 0.018; Chr: p = 0.011); and raphe (SA: p = 0.201; Chr. p = 0.019). The only exception was raphe nucleus of SA group in which the differences were not significant. Chr rats exhibited greater numbers of regenerating brainstem neurons in all nuclei than in SA rats but differences between the paradigms were not significant. The percentage of total traced neurons, per nuclei and experimental group, with respect to equivalent nuclei of sham animals (100 %) was 38.6% and 31.7% in Chr and SA, respectively. By comparison, 13.4% of neurons of the Non-T rats were labeled. Raphe and red nuclei contained the highest number of regenerating neurons in both SA and Chr groups. The SA rats had 63.4% and 46.6% of neurons traced in raphe and red nuclei, respectively, and the Chr rats showed 58.2% and 46.9%. Interestingly, in Non-T animals, the raphe and red nuclei showed more spontaneous regeneration than other nuclei with 25.9% neurons labeled in raphe and 28.9% in the latter. The highest incidence of regenerating neurons after OB-OEG grafting (up to 8-fold) was observed in the locus coeruleus (19% in Chr; 13.8% in SA, compared to 2.4% in Non-T). The percentage of peroxidase-labeled neurons in the reticular formation and vestibular nuclei of transplanted rats compared to sham animals was 30% to 40 %, respectively, i.e. 3 times more than in the Non-T group (Table).
Figure 6.

Brainstem coronal sections showing peroxidase-traced neurons in olfactory bulb-ensheathing glia (OB-OEG)-transplanted (A, C, E, G, I) and non-transplanted (B, D, F, H, J) rats. (A, B) Reticular formation (RF). (C, D) Vestibular nucleus (VN). (E, F) Locus coeruleus (LC). (G, H) Raphe (R). (I, J) Red nucleus (RN). Scale bar: A–J = 50 μm. Top: dorsal; bottom: ventral.
Figure 7.

Quantification of neurons regenerating axons beyond the injury region. (A–E) Histograms show the number of peroxidase-traced neurons in non-transplanted (Non-T), subacute (SA), chronic (Chr) and Sham groups counted in raphe (A), reticular formation (B), vestibular nuclei (C), locus coeruleus (D), red nuclei (E), and in all nuclei (F). Black rhombi represent the number of cell bodies per animal; bars are the average of cell bodies per group. The total number of traced neurons was significantly higher in SA and Chr animals than in Non-T, and also when comparing per nuclei (except for raphe in SA rats) (p < 0.05). There were not significant differences between SA and Chr groups in any case.
Table.
Brainstem Neurons Traced in Transplanted and Non-transplanted Animals
| Raphe | Reticular Formation | Vestibular Nucleus | Locus Coeruleus | Red Nucleus | Total | ||||||||
|---|---|---|---|---|---|---|---|---|---|---|---|---|---|
| Group | No. neurons | % | No. neurons | % | No. neurons | % | No. neurons | % | No. neurons | % | No. neurons | % | |
| Sham | 2167 ± 81 | 100 | 8107 ± 338 | 100 | 1740 ± 94 | 100 | 2202 ± 120 | 100 | 2183 ± 40 | 100 | 16399 ± 609 | 100 | |
| Subacute | 1009 ± 240 | 47 | 2273 ± 528 | 28 | 593 ± 143 | 34 | 303 ± 107 | 14 | 1025 ± 145 | 47 | 5203 ± 1116 | 32 | |
| Chronic | 1373 ± 200 | 63 | 2522 ± 430 | 31 | 746 ± 193 | 43 | 418 ± 249 | 19 | 1271 ± 161 | 58 | 6330 ± 1176 | 39 | |
| Non-transplanted | 561 ± 171 | 26 | 730 ± 202 | 9 | 224 ± 69 | 13 | 53 ± 14 | 2 | 631 ± 61 | 29 | 2198 ± 416 | 14 | |
Data are presented as mean ± SEM neurons detected by peroxidase staining as described in Methods. Also shown are the percentages of labeled neurons per nuclei and per group. The average number of labeled neurons in sham animals was 100%
In summary, the histological results show that axons from several brainstem nuclei that are relevant to motor function were able to cross the scars and grow beyond into the caudal stump. The extent of axonal regeneration was similar in rats transplanted at SA and Chr phases, indicating that the repair efficacy of OB-OEG remained unaltered after delayed transplantation and was independent of the stage of the healing process. Moreover, brainstem neurons retained their capacity to respond positively to OB-OEG up to four months post-lesion. Therefore, there was a window of at least 4 months in which OB-OEG could be applied without any apparent adverse effect.
Functional Outcome Correlated with the Extent of Axonal Regeneration and Tissue Preservation
The maximum climbing level achieved by each rat was positively correlated with the total number of retrogradely labeled brainstem neurons (r = 0.733; p = 0.001). There was also a correlation between climbing ability and the number of somata in each independent nucleus and in all nuclei analyzed (r = coefficients ranging from 0.784 to 0.641; p < 0.008). To estimate the temporary progression of functional recovery per rat, a score was obtained per animal by summing the level achieved each month during 8 months post-transplantation. We selected this period because there was no further improvement after the seventh month. The final score obtained for each rat in the performance in the climbing test correlated with both the total number of labeled cell bodies (r = 0.897; p < 0.001) and the number of somata in each nucleus (r = 0.899–0.847; p < 0.001). These positive linear correlations are consistent with the concept that these brainstem neurons contributed to the functional improvement of the implanted rats. In addition, there was a linear negative correlation between the volume of GFAP-negative tissue (fibrosis and cavities) and the total number of traced brainstem neurons in both all (r =−0.767 p < 0.001) and each (r = 0.780–0.697; p < 0.002) nuclei. This indicates that the smaller the degenerative events at the injury site, the greater axonal regeneration across. Therefore, our results suggest a role of OB-OEG on tissue preservation and/or tissue formation at the lesion zone that may facilitate axonal regeneration across it.
DISCUSSION
OB-OEG promoted both functional recovery of paraplegic rats and regeneration of supraspinal axons caudal to the lesion in rats receiving a graft after 1 and 4 months after the complete lesion. Strikingly, functional outcome after OB-OEG transplantation at 4 months post-lesion did not differ from that at either SA or acute (4) time points. In addition, axonal regeneration of brainstem neurons that are involved in different aspects of motor function (34), was more than doubled in OB-OEG-transplanted vs. non-transplanted rats, again with no differences related to time post-transplantation. Finally, the positive correlation between locomotor performance and extent of axonal regeneration distally is consistent with those brainstem neurons having contributed to the motor recovery. Thus, our results show that the effectiveness of adult OB-OEG and tissue repair was not affected by the stage of the scarring processes and that injured neurons preserved their capacity to respond to OB-OEG for at least 4 months.
The beneficial effects of OB-OEG have been related to enhanced axonal regeneration, survival and tissue sparing, remyelination, stimulation of angiogenesis and neuroprotection (41, 42). Moreover, a recent report revealed that OB-OEG express key molecules involved in the response to wounding, blood vessel development, extracellular matrix formation and remodelling and cell adhesion (43). Based on the present results, therefore, OB-OEG transplantation at subacute and chronic SCI stages could be exerting a reparative action via any or all of these mechanisms; remyelination was not examined in the present study, however.
Our study provides the first evidence that chronic SCI can be repaired by OEG transplants. Lu et al (19) and Lopez-Vales et al (20) performed transplantation at the subacute stage, i.e. after 30 and 45 days, respectively. Moreover, we used adult olfactory bulb OEG (central), whereas in the former study OEG were obtained from lamina propria (peripheral) and in the latter study from neonatal bulbs. It has been reported that mucosal OEG do not exhibit the same migratory or axonal growth-promoting properties as bulbar OEG in rodents (16–18) and neonatal OEG do not exhibit the same properties as adult OEG (24, 44). The observation that implantation of adult OEG can improve recovery after SCI and the lack of a decrease in efficacy of adult OB- makes this a more realistic paradigm for autologous cell therapy for chronic SCI.
In the context of possible future clinical applications, it has been demonstrated that OEG can be obtained from the olfactory bulbs of adult humans (45) and non-human primates (11). These cells can be easily cultured in standard incubators and expanded in large numbers using serum-containing medium. A culture of a single primate olfactory bulb provides approximately 1.5–2 × 10⁶ OEG in the short term (10 days in vitro); an additional 20 × 109 cells can be obtained after 2.5 months. This large number guarantees not only autologous transplantation but also provides cells for allotransplantation and storage. These cells express similar axonal-growth related molecules as rodent cells in vitro (11, 45), and a key issue in this regard is the demonstration that primate OB-OEG from healthy donors, ranging in age from 1.5 to 10 years (young to mature adult), promoted locomotor recovery after transplantation into paraplegic rodents (40). The surgical procedures that are compatible with human practice for unilateral bulbectomy and for autologous transplantation into injured spinal cords have been determined and checked for safety in non-human primates (11, 27). Therefore, these data point to the olfactory bulb as a reliable source of OEG for cell therapy.
A remaining and important issue addressed in the present study was the feasibility of OB-OEG autologous grafting for spinal cord repair. The most probable clinical scenario is of a young adult or adult patient who requires stabilization of the clinical condition after an accident. Hence, it seems safer to perform bulbectomies some time after injury. Moreover, after bulb removal cells need to be grown for at least 10 days in order to obtain enough OEG for transplantation. Accordingly, the experimental condition that would mimic the clinical situation more closely is the implantation in the chronic situation of OB-OEG obtained from adults with chronic SCI. We show that adult OB-OEG can effectively promote functional recovery and repair in paraplegic mammals when they are transplanted at chronic stages. Grafting can be delayed for at least a period of 4 months post-lesion with no decrease in beneficial effects. In the case of an autologous therapy this window would seem to provide enough time to obtain and prepare OEG from the olfactory bulbs and also for patient stabilization before the surgery. Therefore, our results open the prospect for a future therapy with autologous implanted OB-OEG in patients suffering from a severe chronic SCI.
Supplementary Material
Acknowledgments
This work was supported by the Ministry of Health (grant 01/1134), Ministry of Education and Science (SAF2004-04773), Fundación Investigación en Regeneración del Sistema Nervioso and the National Institutes of Health (Grant R01NS054159-01, subaward 0845 G GD202).
We thank Prof. V. Reggie Edgerton from UCLA for his contribution to improve the quality of the article. We are grateful to Luisa Juan and Natividad Pozo for help in animal care and Nuria Ruiz for providing support and advice for statistical analyses.
Appendix 1. Climbing Test
For this test, a rat has to climb from a grid of 25 × 25 mm2 holes and completely pass its body onto a smooth horizontal platform located at a height of 70 cm. The platform is smooth and slippery so the animals cannot cross it using their forelimbs. An animal can only succeed if it voluntarily moves its hind limbs, properly placing the paws on the rungs and pushing its body upwards (see Video, Supplemental Digital Content 1, http://links.lww.com/NEN/A62). The test has 4 difficulty levels (i.e. 1–4) depending on the slope of the grid (45°, 60°, 75°, or 90°, respectively). The higher the slope the greater body weight support. Normal uninjured rats (and shams) achieve the highest level. To motivate the animals they were rewarded with chocolate-hazelnut cream after each good performance. All animals were within a similar range of weight (270–300 g) for comparisons. Each animal was allowed 10 attempts per session. An attempt was counted when the rats pushed with their forelimbs and propelled the head above the horizontal platform. To keep animals unable to achieve the test motivated, a grid with 1 × 1 cm squares on top of the smooth platform was placed only after several unsuccessful tries. Using this grid, animals could pull with the forelimbs upwards, complete the performance and receive the reward (see Video, Supplemental Digital Content 1, http://links.lww.com/NEN/A62). We only considered a positive result when a rat achieved a specific level during 3 different weeks. Three examiners blinded to the treatment evaluated the outcome at the time of testing and by reviewing the videotapes of the sessions.
Video sequences of the last part of the performances of representative Non-T rats and OB-OEG grafted rats (SA and Chr) are shown (see Video, Supplemental Digital Content 1, http://links.lww.com/NEN/A62). The first video sequence is an example of a Non-T rat trying to achieve the lowest climbing level. This rat was unable to use its hind limbs voluntarily and could not propel the body onto the smooth horizontal platform. A surface with a grid was placed on top of the platform so the animal could reach the top and be rewarded after unsuccessful attempts. The second video sequence shows an OB-OEG-transplanted rat achieving level 1 at 4 months after grafting. This animal improved later on and achieved higher climbing levels. The third sequence shows an OB-OEG-grafted rat accomplishing the maximum level reached, i.e. level 3. The 3 sequences are shown in slow motion to demonstrate hind limb voluntary movements in transplanted rats compared to their absence in the Non-T animal.
Appendix 2: Tracking and Distribution of Grafted Olfactory Bulb Ensheathing Glia After Transplantation
There are no good markers for long-term detection of olfactory bulb ensheathing glia (OB-OEG). Most of the immunocytochemical markers used for OEG detection in vitro may cause misleading results in vivo because they also label other cells. For example, anti-p75 antibody does not discriminate between grafted OEG and endogenous Schwann cells invading the lesion (7, 46). Transduction of OEG by adeno- or lentiviruses encoding tag molecules could be used to track transplanted OEG, but genetic manipulation of the cells may change their phenotype. For long-term transplantation studies, the expression of genetic markers should be stable for the entire survival period and the tag molecule should be non-toxic. Green fluorescent protein (GFP) has been used in shorter-term transplantation studies to identify OB-OEG but stable expression occurs only for up to 4 months (1); thus, it is inappropriate for our experimental paradigm. Moreover, other studies report toxic effects of GFP on some cell types (47–49); some of these were not evident in culture but appeared after transplantation (50).
In view of these data and our need to track the fate of OB-OEG 8 months after transplantation, we labeled the cells with bisbenzimide (Hoechst 33342; Sigma-Aldrich Química), as in our previous studies (3, 4). To our knowledge, this is the only vital dye that lasts 8 months after transplantation and has no toxic effects on OB-OEG. To be certain that the dye was not transferred from OEG to other cells, we determined whether the dye was present in macrophages immunostained with the anti-CD68 antibody ED1 (Serotec MCA341R, 1/100) in the lesion sites of transplanted rats by confocal microscopy. The same sections were labeled with either anti-GFAP to delimit glial and fibrous scars (51, 52) or anti-S100 to detect OB-OEG (24). This analysis was performed on 10% of all spinal cord sections that were equally separated by 200 μm from 4 transplanted rats using a Leica confocal microscope (DM IRE2).
GFAP immunohistochemistry delimits glial and fibrous scars created at the injury site (Figure, Supplemental Digital Content 3, http://links.lww.com/NEN/A64, part A). We detected numerous Hoechst-labeled cells at both fibrous and glial scars (Figure, Supplemental Digital Content 3, http://links.lww.com/NEN/A64, part A, B). There were few ED1-positive macrophages that were mainly located at the glial scar and borders of the fibrous scar (Figure, Supplemental Digital Content 3, http://links.lww.com/NEN/A64, part A, C). If leakage of bisbenzimide had occurred from pre-labeled OB-OEG, macrophages should have had blue nuclei but we did not observe colocalization of ED1 and Hoechst dye within the same cells indicating that the dye was not transferred to phagocytic cells (Figure, Supplemental Digital Content 3, http://links.lww.com/NEN/A64, part B-D). Hence, if the dye had not been phagocytosed by macrophages, it is very unlikely that it was transferred from OB-OEG to other cells that lacking active phagocytic activity.
Fibrous scars created after spinal cord injury are formed by fibroblasts and are devoid of astrocytes; hence they are GFAP- and S100-negative (51, 52) (Figure, Supplemental Digital Content 3, http://links.lww.com/NEN/A64, part A). OB-OEG express S100 (24) and an antibody against this molecule can be used to identify OB-OEG in the fibrous scars of transplanted cords. S100-positive OB-OEG were found within the fibrous scar (Figure, Supplemental Digital Content 3, http://links.lww.com/NEN/A64, part E) and Hoechst-labeling colocalized with them (Figure, Supplemental Digital Content 3, http://links.lww.com/NEN/A64, part F). The absence of Hoechst uptake by macrophages and the identification of this marker in OB-OEG indicate that under our experimental conditions OB-OEG can be identified by their Hoechst nuclear staining.
Hoechst-labeled OB-OEG migrated from the injection sites and invaded the glial scars at both rostral and caudal stumps, and also the fibrous scar. They intermingled with reactive astrocytes and the inhibitory environment of the fibrous scar tissue did not hinder their migration (Figure, Supplemental Digital Content 3, http://links.lww.com/NEN/A64, part A, B). Some OB-OEG could also be found at the rostral and caudal spinal cord stumps. OB-OEG seemed to integrate properly within the host parenchyma as there was neither swelling of the tissue, phagocytic cells around grafted OB-OEG or tissue disruption at the sites of injection that would suggest graft rejection. The histological appearance of the stumps was indistinguishable from that of Sham control cords.
References
- 1.Franssen EH, de Bree FM, Verhaagen J. Olfactory ensheathing glia: Their contribution to primary olfactory nervous system regeneration and their regenerative potential following transplantation into the injured spinal cord. Brain Res Rev. 2007;56:236–58. doi: 10.1016/j.brainresrev.2007.07.013. [DOI] [PubMed] [Google Scholar]
- 2.Ramon-Cueto A, Nieto-Sampedro M. Regeneration into the spinal cord of transected dorsal root axons is promoted by ensheathing glia transplants. Exp Neurol. 1994;127:232–44. doi: 10.1006/exnr.1994.1099. [DOI] [PubMed] [Google Scholar]
- 3.Ramon-Cueto A, Plant GW, Avila J, et al. Long-distance axonal regeneration in the transected adult rat spinal cord is promoted by olfactory ensheathing glia transplants. J Neurosci. 1998;18:3803–15. doi: 10.1523/JNEUROSCI.18-10-03803.1998. [DOI] [PMC free article] [PubMed] [Google Scholar]
- 4.Ramon-Cueto A, Cordero MI, Santos-Benito FF, et al. Functional recovery of paraplegic rats and motor axon regeneration in their spinal cords by olfactory ensheathing glia. Neuron. 2000;25:425–35. doi: 10.1016/s0896-6273(00)80905-8. [DOI] [PubMed] [Google Scholar]
- 5.Imaizumi T, Lankford KL, Waxman SG, et al. Transplanted olfactory ensheathing cells remyelinate and enhance axonal conduction in the demyelinated dorsal columns of the rat spinal cord. J Neurosci. 1998;18:6176–85. doi: 10.1523/JNEUROSCI.18-16-06176.1998. [DOI] [PMC free article] [PubMed] [Google Scholar]
- 6.Nash HH, Borke RC, Anders JJ. Ensheathing cells and methylprednisolone promote axonal regeneration and functional recovery in the lesioned adult rat spinal cord. J Neurosci. 2002;22:7111–20. doi: 10.1523/JNEUROSCI.22-16-07111.2002. [DOI] [PMC free article] [PubMed] [Google Scholar]
- 7.Li Y, Decherchi P, Raisman G. Transplantation of olfactory ensheathing cells into spinal cord lesions restores breathing and climbing. J Neurosci. 2003;23:727–31. doi: 10.1523/JNEUROSCI.23-03-00727.2003. [DOI] [PMC free article] [PubMed] [Google Scholar]
- 8.Verdu E, Garcia-Alias G, Fores J, et al. Olfactory ensheathing cells transplanted in lesioned spinal cord prevent loss of spinal cord parenchyma and promote functional recovery. Glia. 2003;42:275–86. doi: 10.1002/glia.10217. [DOI] [PubMed] [Google Scholar]
- 9.Ruitenberg MJ, Levison DB, Lee SV, et al. NT-3 expression from engineered olfactory ensheathing glia promotes spinal sparing and regeneration. Brain. 2005;128:839–53. doi: 10.1093/brain/awh424. [DOI] [PubMed] [Google Scholar]
- 10.Plant GW, Christensen CL, Oudega M, et al. Delayed transplantation of olfactory ensheathing glia promotes sparing/regeneration of supraspinal axons in the contused adult rat spinal cord. J Neurotrauma. 2003;20:1–16. doi: 10.1089/08977150360517146. [DOI] [PubMed] [Google Scholar]
- 11.Rubio MP, Munoz-Quiles C, Ramon-Cueto A. Adult olfactory bulbs from primates provide reliable ensheathing glia for cell therapy. Glia. 2008;56:539–51. doi: 10.1002/glia.20635. [DOI] [PubMed] [Google Scholar]
- 12.Barakat DJ, Gaglani SM, Neravetla SR, et al. Survival, integration, and axon growth support of glia transplanted into the chronically contused spinal cord. Cell Transplant. 2005;14:225–40. doi: 10.3727/000000005783983106. [DOI] [PubMed] [Google Scholar]
- 13.Collazos-Castro JE, Muneton-Gomez VC, Nieto-Sampedro M. Olfactory glia transplantation into cervical spinal cord contusion injuries. J Neurosurg Spine. 2005;3:308–17. doi: 10.3171/spi.2005.3.4.0308. [DOI] [PubMed] [Google Scholar]
- 14.Pearse DD, Sanchez AR, Pereira FC, et al. Transplantation of Schwann cells and/or olfactory ensheathing glia into the contused spinal cord: Survival, migration, axon association, and functional recovery. Glia. 2007;55:976–1000. doi: 10.1002/glia.20490. [DOI] [PubMed] [Google Scholar]
- 15.Resnick DK, Cechvala CF, Yan Y, et al. Adult olfactory ensheathing cell transplantation for acute spinal cord injury. J Neurotrauma. 2003;20:279–85. doi: 10.1089/089771503321532860. [DOI] [PubMed] [Google Scholar]
- 16.Ramer LM, Richter MW, Roskams AJ, et al. Peripherally-derived olfactory ensheathing cells do not promote primary afferent regeneration following dorsal root injury. Glia. 2004;47:189–206. doi: 10.1002/glia.20054. [DOI] [PubMed] [Google Scholar]
- 17.Lu P, Yang H, Culbertson M, et al. Olfactory ensheathing cells do not exhibit unique migratory or axonal growth-promoting properties after spinal cord injury. J Neurosci. 2006;26:11120–30. doi: 10.1523/JNEUROSCI.3264-06.2006. [DOI] [PMC free article] [PubMed] [Google Scholar]
- 18.Steward O, Sharp K, Selvan G, et al. A re-assessment of the consequences of delayed transplantation of olfactory lamina propria following complete spinal cord transection in rats. Exp Neurol. 2006;198:483–99. doi: 10.1016/j.expneurol.2005.12.034. [DOI] [PubMed] [Google Scholar]
- 19.Lu J, Feron F, Mackay-Sim A, et al. Olfactory ensheathing cells promote locomotor recovery after delayed transplantation into transected spinal cord. Brain. 2002;125:14–21. doi: 10.1093/brain/awf014. [DOI] [PubMed] [Google Scholar]
- 20.Lopez-Vales R, Fores J, Navarro X, et al. Chronic transplantation of olfactory ensheathing cells promotes partial recovery after complete spinal cord transection in the rat. Glia. 2007;55:303–11. doi: 10.1002/glia.20457. [DOI] [PubMed] [Google Scholar]
- 21.Hill CE, Beattie MS, Bresnahan JC. Degeneration and sprouting of identified descending supraspinal axons after contusive spinal cord injury in the rat. Exp Neurol. 2001;171:153–69. doi: 10.1006/exnr.2001.7734. [DOI] [PubMed] [Google Scholar]
- 22.Velardo MJ, Burger C, Williams PR, et al. Patterns of gene expression reveal a temporally orchestrated wound healing response in the injured spinal cord. J Neurosci. 2004;24:8562–76. doi: 10.1523/JNEUROSCI.3316-04.2004. [DOI] [PMC free article] [PubMed] [Google Scholar]
- 23.Kubasak MD, Jindrich DL, Zhong H, et al. OEG implantation and step training enhance hindlimb-stepping ability in adult spinal transected rats. Brain. 2008;131:264–76. doi: 10.1093/brain/awm267. [DOI] [PMC free article] [PubMed] [Google Scholar]
- 24.Ramon-Cueto A, Avila J. Olfactory ensheathing glia: properties and function. Brain Res Bull. 1998;46:175–87. doi: 10.1016/s0361-9230(97)00463-2. [DOI] [PubMed] [Google Scholar]
- 25.Cahi E, Rosen M, Becker PJ. A comparison of the dimensional stability of three inlay pattern materials. J Dent Assoc S Afr. 1996;51:337–42. [PubMed] [Google Scholar]
- 26.McDonnell T, Houston F, Byrne D, et al. The effect of time lapse on the accuracy of two acrylic resins used to assemble an implant framework for soldering. J Prosthet Dent. 2004;91:538–40. doi: 10.1016/s0022-3913(02)52728-1. [DOI] [PubMed] [Google Scholar]
- 27.Santos-Benito FF, Munoz-Quiles C, Ramon-Cueto A. Long-term care of paraplegic laboratory mammals. J Neurotrauma. 2006;23:521–36. doi: 10.1089/neu.2006.23.521. [DOI] [PubMed] [Google Scholar]
- 28.Iannotti C, Ping Zhang Y, Shields CB, et al. A neuroprotective role of glial cell line-derived neurotrophic factor following moderate spinal cord contusion injury. Exp Neurol. 2004;189:317–32. doi: 10.1016/j.expneurol.2004.05.033. [DOI] [PubMed] [Google Scholar]
- 29.Oorschot DE. Are you using neuronal densities, synaptic densities or neurochemical densities as your definitive data? There is a better way to go. Prog Neurobiol. 1994;44:233–47. doi: 10.1016/0301-0082(94)90040-x. [DOI] [PubMed] [Google Scholar]
- 30.Paxinos G, Watson C. The rat brain in stereotaxic coordinates. 4. San Diego, California: Academic Press; 1998. [Google Scholar]
- 31.Agresti A. Categorical Data Analysis. 2. Florida: Wiley-Interscience; 2002. [Google Scholar]
- 32.Moses LE, Emerson JD, Hosseini H. Analyzing data from ordered categories. N Eng J Med. 1984;311:442–8. doi: 10.1056/NEJM198408163110705. [DOI] [PubMed] [Google Scholar]
- 33.Conover W. Practical Nonparametric Statistics. 3. Wiley; 1999. [Google Scholar]
- 34.Tracey DJ. Ascending and descending pathways in the spinal cord. In: Paxinos G, editor. The rat nervous system: Primary afferent projections to the spinal cord. San Diego, California: Academic Press; 1995. pp. 67–75. [Google Scholar]
- 35.Courtine G, Bunge MB, Fawcett JW, et al. Can experiments in nonhuman primates expedite the translation of treatments for spinal cord injury in humans? Nat Med. 2007;13:561–6. doi: 10.1038/nm1595. [DOI] [PMC free article] [PubMed] [Google Scholar]
- 36.Metz GA, Merkler D, Dietz V, et al. Efficient testing of motor function in spinal cord injured rats. Brain Res. 2000;883:165–77. doi: 10.1016/s0006-8993(00)02778-5. [DOI] [PubMed] [Google Scholar]
- 37.Whishaw IQ, Gorny B, Sarna J. Paw and limb use in skilled and spontaneous reaching after pyramidal tract, red nucleus and combined lesions in the rat: Behavioral and anatomical dissociations. Behav Brain Res. 1998;93:167–83. doi: 10.1016/s0166-4328(97)00152-6. [DOI] [PubMed] [Google Scholar]
- 38.Woodhall E, West AK, Chuah MI. Cultured olfactory ensheathing cells express nerve growth factor, brain-derived neurotrophic factor, glia cell line-derived neurotrophic factor and their receptors. Brain Res Mol Brain Res. 2001;88:203–13. doi: 10.1016/s0169-328x(01)00044-4. [DOI] [PubMed] [Google Scholar]
- 39.Boruch AV, Conners JJ, Pipitone M, et al. Neurotrophic and migratory properties of an olfactory ensheathing cell line. Glia. 2001;33:225–9. [PubMed] [Google Scholar]
- 40.Guest JD, Herrera L, Margitich I, et al. Xenografts of expanded primate olfactory ensheathing glia support transient behavioral recovery that is independent of serotonergic or corticospinal axonal regeneration in nude rats following spinal cord transection. Exp Neurol. 2008;212:261–74. doi: 10.1016/j.expneurol.2008.03.010. [DOI] [PubMed] [Google Scholar]
- 41.Barnett SC, Riddell JS. Olfactory ensheathing cell transplantation as a strategy for spinal cord repair--what can it achieve? Nature clinical practice. 2007;3:152–61. doi: 10.1038/ncpneuro0447. [DOI] [PubMed] [Google Scholar]
- 42.Richter MW, Roskams AJ. Olfactory ensheathing cell transplantation following spinal cord injury: hype or hope? Exp Neurol. 2008;209:353–67. doi: 10.1016/j.expneurol.2007.06.011. [DOI] [PubMed] [Google Scholar]
- 43.Franssen EH, De Bree FM, Essing AH, et al. Comparative gene expression profiling of olfactory ensheathing glia and Schwann cells indicates distinct tissue repair characteristics of olfactory ensheathing glia. Glia. 2008;56:1285–98. doi: 10.1002/glia.20697. [DOI] [PubMed] [Google Scholar]
- 44.Barnett SC. Olfactory ensheathing cells: unique glial cell types? J Neurotrauma. 2004;21:375–82. doi: 10.1089/089771504323004520. [DOI] [PubMed] [Google Scholar]
- 45.Barnett SC, Alexander CL, Iwashita Y, et al. Identification of a human olfactory ensheathing cell that can effect transplant-mediated remyelination of demyelinated CNS axons. Brain. 2000;123:1581–8. doi: 10.1093/brain/123.8.1581. [DOI] [PubMed] [Google Scholar]
- 46.Keyvan-Fouladi N, Raisman G, Li Y. Functional repair of the corticospinal tract by delayed transplantation of olfactory ensheathing cells in adult rats. J Neurosci. 2003;23:9428–34. doi: 10.1523/JNEUROSCI.23-28-09428.2003. [DOI] [PMC free article] [PubMed] [Google Scholar]
- 47.Liu HS, Jan MS, Chou CK, et al. Is green fluorescent protein toxic to the living cells? Biochem Biophys Res Commun. 1999;260:712–7. doi: 10.1006/bbrc.1999.0954. [DOI] [PubMed] [Google Scholar]
- 48.Detrait ER, Bowers WJ, Halterman MW, et al. Reporter gene transfer induces apoptosis in primary cortical neurons. Mol Ther. 2002;5:723–30. doi: 10.1006/mthe.2002.0609. [DOI] [PubMed] [Google Scholar]
- 49.Torbett BE. Reporter genes: too much of a good thing? J Gene Med. 2002;4:478–9. doi: 10.1002/jgm.323. [DOI] [PubMed] [Google Scholar]
- 50.Doi K, Hargitai J, Kong J, et al. Lentiviral transduction of green fluorescent protein in retinal epithelium: evidence of rejection. Vision Res. 2002;42:551–8. doi: 10.1016/s0042-6989(01)00237-1. [DOI] [PubMed] [Google Scholar]
- 51.Dusart I, Marty S, Peschanski M. Glial changes following an excitotoxic lesion in the CNS--II. Astrocytes Neuroscience. 1991;45:541–9. doi: 10.1016/0306-4522(91)90269-t. [DOI] [PubMed] [Google Scholar]
- 52.Lakatos A, Barnett SC, Franklin RJ. Olfactory ensheathing cells induce less host astrocyte response and chondroitin sulphate proteoglycan expression than Schwann cells following transplantation into adult CNS white matter. Exp Neurol. 2003;184:237–46. doi: 10.1016/s0014-4886(03)00270-x. [DOI] [PubMed] [Google Scholar]
Associated Data
This section collects any data citations, data availability statements, or supplementary materials included in this article.