

Abstract
Objective
Cardiac computed tomography (CT) allows for simultaneous assessment of left ventricular mass (LVM) and coronary artery disease (CAD). We aimed to determine whether LVM, LVM index (LVMi), and the left ventricular (LV) geometric pattern of concentric remodeling are associated with the extent of CAD in patients without left ventricular hypertrophy (LVH).
Methods
In 348 patients from the ROMICAT trial, 64-slice CT was performed and LVM measured at end-diastole. We used 3 LVM indexation criteria to obtain 3 cohorts: LVM indexed to body surface area by echocardiography (n=337) and CT criteria (n=325), and by height2.7 (n=326). The cohorts were subdivided into concentric remodeling and normal geometry. Extent of coronary plaque was classified based on a 17-segment model, treated as a continuous variable, and stratified into 3 groups: 0 segments, 1–4 segments, >4 segments.
Results
Patients with >4 segments of coronary plaque had higher LVM (Δ12.8–15.1g) and LVMi (Δ4.0–5.5g/m2 and Δ2.2g/m2.7) than those without CAD (all p≤0.03). After multivariable adjustment, LVM and LVMi remained independent predictors of extent of coronary plaque, with 0.27–0.29 segments more plaque per 20 g increase of LVM (all p=0.02), 0.32–0.34 segments more plaque per 10 g/m2 increase of LVMi (both p=0.02), and 0.80 segments more plaque per 10 g/m2.7 increase of LVMi (p=0.008). Concentric remodeling patients had 1.1–1.3 segments more plaque than those with normal geometry (all p≤0.05). Patients with >4 segments of plaque had 2-fold increase odds (all p≤0.05) of having concentric remodeling as compared to those without CAD.
Conclusion
Increased LVM, LVMi, and concentric remodeling are associated with a greater degree of coronary plaque burden in patients without LVH. These findings could provide an indication to intensify medical therapy in patients with subclinical CAD and hypertension.
Keywords: left ventricular mass, left ventricular mass index, concentric remodeling, coronary artery plaque, computed tomography
INTRODUCTION
Increased left ventricular mass (LVM) has been shown to be an independently predictor of mortality and major adverse cardiac event including coronary heart disease, stroke, and heart failure[1–3]. It has been reported to be independently predictive of low ejection fraction[4]. In addition, LVM index (LVMi) to body surface area (BSA) or height2.7 and left ventricular (LV) geometric patterns have been reported to have incremental value for prognosticating beyond that of LV mass in patients with coronary artery disease (CAD)[2, 5–9]. LV geometric patterns, which are characterized as normal geometry, concentric remodeling, concentric and eccentric hypertrophy, are believed to have incremental value for predicting cardiovascular mortality and events beyond that of LV mass measurements[2, 7]. Left ventricular hypertrophy (LVH), either concentric or eccentric, is defined as an increase in LVMi. Concentric remodeling is defined as individuals with normal LVMi and an relative wall thickness (RWT) ratio, while normal geometry is defined as normal LVMi with a normal RWT ratio[8].
A greater extent of CAD may in part explain the increase risk of cardiovascular mortality associated with increased ventricular mass and abnormal geometry in patients with LVH[10–12]. In these studies, coronary artery assessment was performed with either calcium score[10], invasive coronary angiography[11], exercise electrocardiographic stress testing[13], or prior history of CAD or myocardial infarction[2, 12]. In addition, these studies used either echocardiography and cardiac magnetic resonance imaging for LV mass analysis. Over the past few years, contrast-enhanced multi-detector computed tomography (CT) has become an emerging noninvasive modality for accurate assessment of CAD, which also allows for simultaneous three-dimensional visualization of the left ventricle for mass quantification[14].
It is unclear whether increase LVM and LVMi in the absence of LVH are associated with a higher extent of CAD or whether patients with concentric remodeling are more likely to have a greater degree of coronary plaque burden than those with normal geometry. Given that cardiac CT can assess for the presence of subclinical coronary artery disease, this imaging modalityallows for a unique insight into examining the association between LV mass measurements and coronary artery plaque burden. Thus, the purpose of this study is to determine in patients without LVH whether (1) the LV mass measurements of LVM and LVMi using 3 indexation criteria and (2) the LV geometric pattern of concentric remodeling are associated with a greater extent of CAD as determined by CT.
METHODS
Study population
Details of the “Rule Out Myocardial Infarction Using Computer Assisted Tomography” (ROMICAT) study have been previously reported[15]. Briefly, ROMICAT was a double-blinded, single site prospective observational cohort study of consecutive adult patients at low-to-intermediate likelihood of acute coronary syndrome who presented to the emergency department of Massachusetts General Hospital (MGH) with acute chest pain whose initial electrocardiogram (ECG) and biomarkers were inconclusive and were awaiting hospital admission. The intake period was a cumulative period of 18 months ending May 2007. Exclusion criteria were notable for patients with atrial fibrillation and serum creatinine > 1.3 mg/dL. All eligible patients who consented underwent ECG-gated contrast-enhanced 64-slice multi-detector CT. All patients and caregivers were blinded to the findings of the CT. Patients received standard of care to rule out acute coronary syndrome during index hospitalization, including serial ECGs, biomarkers, cardiac testing (stress test or cardiac catheterization). Our institutional review board approved the study protocol and all patients provided written informed consent.
In this analysis, we excluded patients with bicuspid aortic valves and history of aortic valve surgery. We also excluded patients who had a history of coronary bypass graft surgery and coronary stent because of the inability to accurately assess the extent of coronary artery plaque. Because we wanted to examine the effect of LV mass measurements and concentric remodeling in patients without evidence of LVH, we excluded patients with LVH as measured by CT. We used 3 separate criteria to determine the presence of LVH and performed analyses for each method separately without LVH patients. From 347 patients, we excluded 10 patients (2.8%) using the American Society of Echocardiography (ASE) based criteria [8] where LVM was indexed to BSA (LVH defined as LVM/BSAASE >95 g/m2 for women and >115 g/m2 for men) for a total of 337 patients, whom there was full visualization of the left ventricle on the multi-phase reformatted (MPR) dataset of the CT for LVM analysis, and 335 patients for the LVM/BSAASE and LV geometry analyses due to missing height data on two subjects. We excluded 22 patients (6.3%) using the height2.7 criteria [6, 9] where LVM was indexed to height2.7 (LVH defined as LVM/height2.7 ≥ 47 g/m2.7 for women and ≥ 50 g/m2.7 for men) for a total of 325 patients for LVM analysis and 323 patients for the LVM/height2.7 and geometry analyses. We excluded 21 patients (6.0%) using a recently described CT criteria [16] indexed to BSA (LVH defined as LVM/BSACT >89 g/m2 for women and >103 g/m2 for men) for a total of 326 patients for LVM analysis and 324 patients for the LVM/BSACT and geometry analyses.
CT Data Acquisition
CT imaging was performed using a standard 64-slice multi-detector CT coronary angiography (Sensation 64, Siemens Medical Solutions, Forchheim, Germany) protocol that was acquired at end inspiration and included the administration of sublingual nitroglycerin (0.6 mg) and intravenous beta-blocker (metoprolol 5–20 mg) for those with the baseline heart rate >60 beats per minute and no other contraindications. A test bolus protocol was used to determine the optimal timing of contrast injection (20 ml contrast agent followed by 40 ml saline, flow rate of 5 ml/s). Contrast agent (80–100 ml, Iodhexodol 320 g/cm3, Visipaque, General Electrics Healthcare, Princeton, NJ, USA) with 40 ml saline was injected intravenously at a rate of 5 ml/s.
CT images were acquired in spiral mode, gantry rotation time of 330 ms, 64 × 0.6 mm slice collimation, tube voltage of 120 kV, effective tube current of 850 to 950 mAs, with ECG-correlated tube current modulation when appropriate. Reconstructions were performed using retrospectively ECG-gated half-scan algorithm for a temporal resolution of 165 ms. For this temporal resolution, 10% RR interval reconstructions (10 phases) for a mean heart rate of 65 beats per minutes during scanning is adequate for the MPR dataset with 1.5 mm slice thickness and 1.5 mm increments of the transaxial images for mass, volumetric, and functional analyses. For coronary artery assessment, transaxial images were reconstructed using a medium sharp convolution kernel with a slice thickness of 0.75 mm and increment of 0.4 mm.
CT Measurements
Two experienced readers performed the CT measurements offline using dedicated cardiac workstations at the MGH Cardiovascular CT Core Lab. Quantitative LV measurements were obtained using Vitrea software (Vital Images, Minnetonka, Minnesota). LV volumes and ejection fraction (EF) were derived from the endocardial borders at end-diastolic and end-systolic phases. LV mass was derived by manually corrected semiautomated delineation of the endocardial and epicardial borders at end-diastole, with exclusion of the papillary muscles. Posterior wall thickness (PWT) was manually measured at the mid papillary level of the LV from the short-axis view at end-diastole, while the LV inner diameter (LVID) was manually measured at the mitral annulus level from the four-chamber view at end-diastole. LV mass was indexed to BSA or height2.7 for LVMi. RWT was calculated as 2 x (PWT) / LVID. Increased RWT was defined when the ratio was >0.42. The cohort was also subdivided into two mutually exclusive groups based on LV geometry: concentric remodeling and normal geometry, as illustrated in Figure 1. Concentric remodeling is defined as individuals without LVH, as defined by the 3 LVMi criteria, and a relative wall thickness (RWT) ratio > 0.42, while normal geometry is defined as no LVH with a RWT ratio ≤ 0.42 [8].
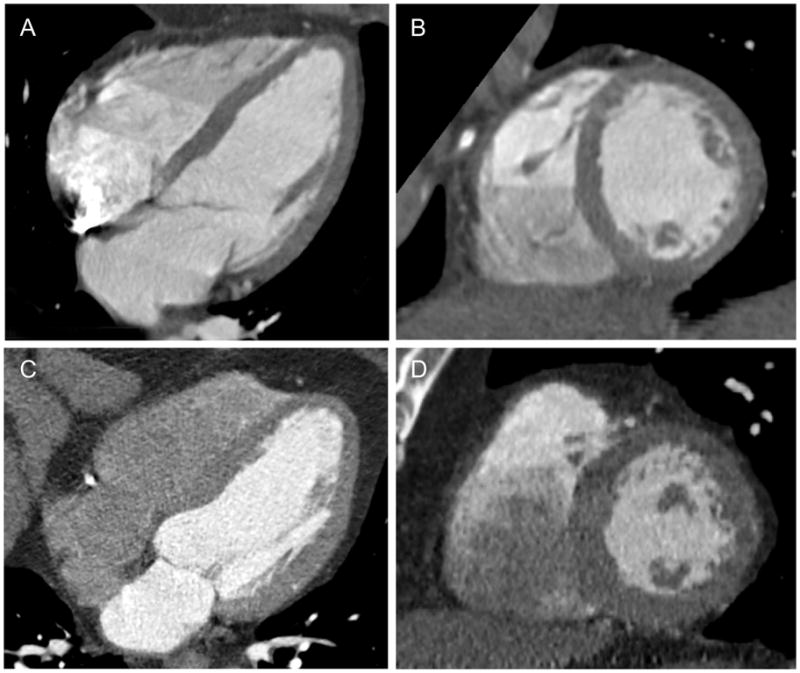
Figure 1.

Four-chamber (A) and short-axis (B) views of the left ventricle in a 53-year old man with normal geometry (normal LVM/BSA of 64 g/m2, normal LVM/height2.7 of 28 g/m2.7, and normal RWT ratio 0.33) and no coronary artery disease. Four-chamber (C) and short-axis (D) views of the left ventricle in a 64-year old man with concentric remodeling (normal LVM/BSA of 97 g/m2, normal LVM/height2.7 of 44 g/m2.7, but increase RWT ratio 0.45) and coronary artery disease (12 segments of plaque). LVM denotes left ventricular mass; BSA, body mass index; and RWT, relative wall thickness.
For the detection of CAD, the 17-segment model based on the American Heart Association classification with the addition of the posterior left ventricular branch as segment 16 and the ramus intermedius as segment 17 was used [17]. For each of the 17 segments, coronary atherosclerotic plaque, their composition (calcified, mixed, or non-calcified), and stenosis (defined as luminal narrowing >50% diameter) was visually classified as either present or absent as previously described and determined by two reader consensus using Leonardo workstation (Siemens Medical Solutions, Forchheim, Germany) as previously validated [18]. The extent of coronary plaque burden was scored from 0 to 17 and treated as a continuous variable.
Covariates of interests
Cardiovascular risk factors and medical history including medications were assessed at the time of subject’s enrollment based on self-report or obtained from the medical records during the index hospitalization. Body mass index (BMI) was defined as weight (kilograms) divided by the height squared (meters). BSA was calculated using the Dubois formula [19]. Hypertension was defined as systolic blood pressure of at least 140 mm Hg or diastolic blood pressure of at least 90 mm Hg or current antihypertensive treatment. Diabetes mellitus was defined as a fasting plasma glucose ≥ 126 mg/dL or treatment with a hypoglycemic agent. Hyperlipidemia was defined as total cholesterol of ≥ 200 mg/dl or treatment with a lipid lowering medication. Documented history of CAD included previous myocardial infarction or coronary revascularization with percutaneous transluminal coronary angioplasty. Family history of CAD was defined as having a first-degree female (<65 years) or male (<55 years) relative with a documented history of myocardial infarction or sudden cardiac death. History of LV dysfunction was obtained from review of prior echocardiography or nuclear imaging reports. Subjects were classified as smokers if they had smoked at least one cigarette per day in the year prior to the study. Estimated glomerular filtration rate (eGFR) was determined using the Modification of Diet in Renal Disease (MDRD) formula [20].
Statistical analysis
Descriptive statistics were expressed as mean ± standard deviation (SD) for continuous variables and as frequency and percentages for nominal variables. The differences in means between two groups were determined using Student’s t test for continuous variables and differences in proportions were determined by Fisher’s Exact or Chi-square test for binary variables. We stratified the extent of coronary plaques into 3 categories based on quartiles: 0 segment (1st and 2nd quartile), 1–4 segments (3rd quartile), and >4 segments (4th quartile). Comparisons between these 3 categories were performed using the least squares means test or analysis of variance from the generalized linear model for continuous variables and the Mantel-Haenszel trend test for nominal variables. We used linear regression to determine the relationship between the extent of coronary plaque and the LV mass measurements of LVM and LVMi. For multivariable model A, we included potential confounders based on a prior knowledge and included age, gender, race, hypertension, diabetes, hyperlipidemia, history of coronary artery disease, family history of coronary artery disease, history of left ventricular dysfunction, smoking, aspirin, statin, systolic blood pressure, estimated glomerular filtration rate, and left ventricular ejection fraction as measured by CT. Body mass index was included additionally in the LVM model. For multivariable model B, we included the covariates of model A with the additional adjustment for RWT as a continuous variable. For both multivariable models, testing for residual, leverage, influence diagnostics, and collinearity were performed and found no violations of the models. We used linear regression to test for interaction between gender and LWM, LVMi, and concentric remodeling to the extent of coronary plaque. We used the Mantel-Haenszel trend test to determine whether there was a trend observed between concentric remodeling and the stratified categories of extent of coronary plaques and Fisher’s Exact or Chi-square tests for comparisons of proportions between two groups. Logistic regression was employed to determine the risk of concentric remodeling between stratified categories of extent of plaque. The interobserver variability for LV mass was determined for 20 randomly selected studies and assessed using intraclass correlation coefficient (ICC). The LV mass measurements by two independent readers had excellent reproducibility with ICC for LV mass of 0.98 (95% confidence interval [CI] 0.94–0.99, p<0.001). A 2-tailed p-value of <0.05 was considered to indicate statistical significance. All analyses were performed using SAS (Version 9.1.3, SAS Institute Inc., Cary, North Carolina) and SPSS (Version 16.0, Chicago, Illinois).
RESULTS
The clinical characteristics of the study cohorts are presented in Table 1. The 3 study cohorts were similar with respect to their patient characteristics, with the mean age of 53 years (range 21 to 89 years). They were predominantly male (~60%), non-black race (~91%), with preserved LV function (EF 68%) and normal renal function (estimated GFR ~84 ml/min/1.73 m2). Of the patients with pre-existing hypertension (~37%), all but two were on hypertensive medications and their mean systolic blood pressure at the time of emergency department triage was 138 mmHg. As determined by CT, 50% of patients had some degree of atherosclerosis, with 18% of patients with at least >50% luminal stenosis (LVM/BSAASE cohort: 61 [18.1%]; LVM/height2.7 cohort: 58 [17.9%]; LVM/BSACT cohort: 59 [18.1%]). By plaque composition, 39% of patients had calcified plaque (LVM/BSAASE cohort: 133 [39.5%]; LVM/height2.7 cohort: 129 [39.7%]; LVM/BSACT cohort: 128 [39.3%]), 29% had mixed plaque (LVM/BSAASE cohort: 99 [29.4%]; LVM/height2.7 cohort: 96 [29.2%]; LVM/BSACT cohort: 94 [28.8%]), and 16% had non-calcified plaque (LVM/BSAASE cohort: 55 [16.3%]; LVM/height2.7 cohort: 53 [16.3%]; LVM/BSACT cohort: 55 [16.9%]).
Table 1.
Patient characteristics of the study cohorts without left ventricular hypertrophy based on the 3 left ventricular mass index criteria.
| LVM/BSAASE cohort (n=337) | LVM/height2.7 cohort (n=325) | LVM/BSACT cohort (n=326) | |
|---|---|---|---|
| Demographics | |||
| Age, yrs | 52.7 ± 11.7 | 52.6 ± 11.8 | 52.7 ± 11.7 |
| Gender, male (%) | 206 (61.1%) | 196 (60.3%) | 198 (60.7%) |
| Race, black (%) | 30 (8.9%) | 27 (8.3%) | 29 (8.9%) |
| Body mass index, kg/m2 | 29.0 ± 5.8 | 28.6 ± 5.4 | 28.9 ± 5.8 |
| Body surface area, m2 | 1.99 ± 0.26 | 1.99 ± 0.26 | 1.99 ± 0.26 |
| Risk factors | |||
| Hypertension (%) | 127 (37.7%) | 117 (36.0%) | 121 (37.1%) |
| Diabetes (%) | 33 (9.8%) | 29 (8.9%) | 29 (8.9%) |
| Hyperlipidemia (%) | 120 (35.6%) | 114 (35.1%) | 115 (35.3%) |
| History of CAD (%) | 17 (5.0%) | 17 (5.2%) | 16 (4.9%) |
| Family history of CAD (%) | 83 (24.6%) | 80 (24.6%) | 80 (24.5%) |
| History of LV dysfunction (%) | 6 (1.8%) | 6 (1.9%) | 6 (1.9%) |
| Smokers (%) | 169 (50.2%) | 164 (50.5%) | 164 (50.3%) |
| Medications | |||
| Aspirin (%) | 103 (30.6%) | 99 (30.5%) | 98 (30.1%) |
| Statin (%) | 91 (27.0%) | 85 (26.2%) | 87 (26.7%) |
| Hypertensive Medication (%) | 125 (37.1%) | 115 (35.4%) | 119 (36.5%) |
| Beta-blocker (%) | 72 (21.4%) | 69 (21.2%) | 70 (21.5%) |
| ACE-I (%) | 45 (13.4%) | 39 (12.0%) | 40 (12.3%) |
| Presenting Characteristics | |||
| SBP, mmHg | 138.2 ± 21.9 | 137.8 ± 21.6 | 137.8 ± 21.6 |
| eGFR, ml/min/1.73 m2 | 84.6 ± 17.4 | 84.3 ± 17.6 | 84.3 ± 17.5 |
| HR during CT scan, beats/min | 65.4 ± 11.6 | 65.4 ± 11.7 | 65.4 ± 11.7 |
| CT Measurements | |||
| LV end-systolic volume, ml | 38.6 ± 18.1 | 38.6 ± 18.2 | 38.3 ± 18.1 |
| LV end-diastolic volume, ml | 117.1 ± 30.0 | 117.0 ± 30.0 | 116.5 ± 29.7 |
| LV ejection fraction, % | 67.9 ± 9.2 | 67.9 ± 9.2 | 68.0 ± 9.3 |
| LV inner diameter, mm | 47.5 ± 5.4 | 47.5 ± 5.4 | 47.5 ± 5.4 |
| RWT ratio | 0.36 ± 0.09 | 0.36 ± 0.09 | 0.36 ± 0.09 |
| Presence of any coronary plaque | 168 (49.9%) | 162 (49.9%) | 163 (50.0%) |
LVM denotes left ventricular mass; BSA, body surface area; ASE, American Society of Echocardiography; CT, computed tomography; CAD; coronary artery disease; LV, left ventricular; ACE-I, angiotensin converting enzyme inhibitor; SBP, systolic blood pressure; eGFR, estimated glomerular filtration rate; HR, heart rate; and RWT, relative wall thickness.
LV mass and mass index and extent of coronary artery plaque
Table 2 depicts the LVM, LVMi, and extent of coronary artery plaque based on the 17-segment coronary artery model for the 3 cohorts and when stratified by gender. For all 3 cohorts, there were similar gender differences between men and women. For the LVM/BSAASE cohort, men were 4.9 years younger than women (50.7 ± 11.6 years vs 55.7 ±11.2 years; p=0.0001), had higher LVM by 49.3 g (p<0.0001), higher LVMi by 14.5 g/m2 (p<0.0001), and more segments with coronary plaques than women (p=0.005). For the LVM/height2.7 cohort, men were 4.9 years younger than women (50.7 ± 11.6 years vs 55.6 ±11.2 years; p=0.0002), had higher LVM by 47.7g (p<0.0001), higher LVMi by 3.3 g/m2.7 (p<0.0001), and more segments with coronary plaques than women (p=0.009). Similar to the LVM/BSAASE cohort, for the LVM/BSACT cohort, we found similar gender differences with men being 5.0 years younger than women (50.7 ± 11.5 years vs 55.7 ±11.3 years; p=0.0001), higher LVM by 48.3g (p<0.0001), higher LVMi by 13.9 g/m2.7 (p<0.0001), and more segments with coronary plaques than women (p=0.02). In all 3 cohorts, we also found no significant interaction between gender and LVM or LVMi to the extent of plaque.
Table 2.
LVM, LVMi, and extent of coronary artery plaque based on the 17-segment coronary artery model for the 3 cohorts and when stratified by gender.
| Total | Men | Women | ||
|---|---|---|---|---|
| Mean ± SD (range) | Mean ± SD (range) | Mean ± SD (range) | p-value | |
| LVM/BSAASE cohort, n | n=337 | n=206 | n=131 | |
| LVM, g | 145.5 ± 38.3 (64.0 – 284.0) | 164.6 ± 32.3 (64.0 – 284.0) | 115.4 ± 25.5 (67.0 – 182.0) | <0.0001 |
| LVM/BSA, g/m2 | 72.3 ± 14.0 (28.4 – 112.4) | 78.0 ± 12.8 (28.4 – 112.4) | 63.5 ± 10.8 (40.7 – 92.1) | <0.0001 |
| Extent of coronary artery plaque, segments | 2.3 ± 3.5 (0 – 16) | 2.7 ± 3.7 (0 – 16) | 1.7 ± 3.0 (0 – 13) | 0.005 |
| LVM/height2.7 cohort, n | n=325 | n=196 | n=129 | |
| LVM, g | 143.7 ± 37.2 (64.0 – 284.0) | 162.7 ± 31.3 (64.0 – 284.0) | 115.0 ± 25.0 (67.0 – 182.0) | <0.0001 |
| LVM/ height2.7, g/m2.7 | 33.4 ± 6.4 (12.5 – 49.9) | 34.7 ± 6.0 (12.5 – 49.9) | 31.4 ± 6.6 (16.2 – 45.5) | <0.0001 |
| Extent of coronary artery plaque, segments | 2.3 ± 3.5 (0 – 16) | 2.7 ± 3.8 (0 – 16) | 1.7 ± 3.0 (0 – 13) | 0.009 |
| LVM/BSACT cohort, n | n=326 | n=198 | n=128 | |
| LVM, g | 143.2 ± 36.4 (64.0 – 284.0) | 162.1 ± 30.0 (64.0 – 284.0) | 113.9 ± 23.8 (67.0 – 166.0) | <0.0001 |
| LVM/BSA, g/m2 | 71.3 ± 12.9 (28.4 – 101.6) | 76.7 ± 11.5 (28.4 – 101.6) | 62.8 ± 10.0 (40.7 – 88.2) | <0.0001 |
| Extent of coronary artery plaque, segments | 2.3 ± 3.4 (0 – 16) | 2.6 ± 3.6 (0 – 16) | 1.7 ± 3.0 (0 – 13) | 0.02 |
Abbreviations as in Table 1. LVMi denotes LVM index; and SD, standard deviation.
When stratified by the numbers of coronary artery segments, as shown in Table 3 for all 3 cohorts, patients with 1–4 segments of plaque had no difference, while those with >4 segments of plaque segments had significantly greater LVM and LVMi when compared to patients with no coronary plaque. Between patients with 1–4 segments and >4 segments, there was a significant increase in LVMi (Δ 4.9 g/m2, 95% CI: 0.7, 9.2 g/m2; p=0.02) using the LVM/BSAASE criteria, but nonsignificant (NS) increase for LVM and LVMi for the remainder of the comparisons. For the patient characteristics according to the 3 categories of coronary artery plaque segments, see Appendix.
Table 3.
LV mass and LV mass index as stratified by the extent of coronary artery plaque, with no plaque as the reference group.
| Coronary plaque segments |
|||
|---|---|---|---|
| 0 segment (reference group) | 1–4 segments | >4 segments | |
| LVM/BSAASE cohort | |||
| LVM, n (%) | 169 (50.1%) | 97 (28.8%) | 71 (21.1%) |
| Mean ± SD, g | 141.3 ± 37.5 | 144.8 ± 36.5 | 156.4 ± 41.0 |
| Difference between means (95% CI), g | - | 3.5 (−6.0, 13.0) | 15.1 (4.6, 25.7) |
| p-value | - | 0.47 | 0.005 |
| LVM/BSA, n (%) | 168 (50.1%) | 97 (29.0%) | 70 (20.9%) |
| Mean ± SD, g/m2 | 71.0 ± 13.7 | 71.6 ± 13.1 | 76.5 ± 15.2 |
| Difference between means (95% CI), g/m2 | - | 0.6 (−2.9, 4.0) | 5.5 (1.6, 9.4) |
| p-value | - | 0.75 | 0.005 |
| LVM/height2.7 cohort | |||
| LVM, n (%) | 163 (50.2%) | 95 (29.2%) | 67 (20.6%) |
| Mean ± SD, g | 139.7 ± 36.0 | 144.0 ± 36.4 | 153.1 ± 39.8 |
| Difference between means (95% CI), g | - | 4.2 (−5.1, 13.6) | 13.4 (2.8, 23.9) |
| p-value | - | 0.37 | 0.01 |
| LVM/ height2.7, n (%) | 163 (50.3%) | 95 (29.3%) | 66 (20.4%) |
| Mean ± SD, g/m2.7 | 32.7 ± 6.3 | 33.5 ± 6.2 | 35.0 ± 6.8 |
| Difference between means (95% CI), g/m2.7 | - | 0.7 (−0.9, 2.3) | 2.2 (0.4, 4.1) |
| p-value | - | 0.38 | 0.02 |
| LVM/BSACT cohort | |||
| LVM, n (%) | 163 (50.0%) | 97 (29.8%) | 66 (20.3%) |
| Mean ± SD, g | 138.8 ± 35.2 | 144.9 ± 36.5 | 151.6 ± 38.0 |
| Difference between means (95% CI), g | - | 6.0 (−3.2, 15.1) | 12.8 (2.4, 23.1) |
| p-value | - | 0.20 | 0.02 |
| LVM/BSA, n (%) | 162 (50.0%) | 97 (29.9%) | 65 (20.1%) |
| Mean ± SD, g/m2 | 70.0 ± 12.8 | 71.6 ± 13.1 | 74.0 ± 12.6 |
| Difference between means (95% CI), g/m2 | - | 1.6 (−1.6, 4.8) | 4.0 (0.3, 7.7) |
| p-value | - | 0.33 | 0.03 |
Appendix.
Patient characteristics of the 3 study cohorts based on the different LVMi criteria as stratified by the extent of coronary artery plaque segments.
| LVM/BSAASE cohort | LVM/height2.7 cohort | LVM/BSACT cohort | ||||||||||
|---|---|---|---|---|---|---|---|---|---|---|---|---|
| 0 segment | 1–4 segments | > 4 segments | p-value | 0 segment | 1–4 segments | > 4 segments | p-value | 0 segment | 1–4 segments | > 4 segments | p-value | |
| Demographics, n | 169 | 97 | 71 | 163 | 95 | 67 | 163 | 97 | 66 | |||
| Age, yrs | 47.3 ± 9.2 | 55.8± 10.4 | 61.1 ± 12.2 | <0.0001 | 47.1 ± 9.2 | 56.0 ± 10.4 | 61.2 ±12.2 | <0.0001 | 47.3 ± 9.2 | 55.9 ± 10.4 | 61.2 ± 12.3 | <0.0001 |
| Gender, male (%) | 92 (54.4%) | 62 (63.9%) | 52 (73.2%) | 0.005 | 88 (54.0%) | 60 (63.2%) | 48 (71.6%) | 0.01 | 89 (54.6%) | 62 (63.9%) | 47 (71.2%) | 0.01 |
| Race, black (%) | 18 (10.7%) | 11 (11.3%) | 1 (1.4%) | 0.05 | 18 (11.0%) | 9 (9.5%) | 0 (0%) | 0.01 | 18 (11.05) | 11 (11.3%) | 0 (0%) | 0.02 |
| Body mass index, kg/m2 | 28.6 ± 6.0 | 29.3 ± 5.8 | 29.3 ± 5.2 | 0.55 | 28.2 ± 5.6 | 29.0 ± 5.2 | 29.1 ± 5.2 | 0.38 | 28.5 ± 5.9 | 29.3 ± 5.8 | 29.3 ± 5.4 | 0.48 |
| Body surface area, m2 | 1.97 ± 0.26 | 2.00 ± 0.25 | 2.03 ± 0.27 | 0.19 | 1.96 ± 0.25 | 2.00 ± 0.25 | 2.03 ± 0.27 | 0.17 | 1.96 ± 0.26 | 2.01 ± 0.25 | 2.03 ± 0.27 | 0.15 |
| Risk factors | ||||||||||||
| Hypertension (%) | 40 (23.7%) | 42 (43.3%) | 45 (63.4%) | <0.0001 | 36 (22.1%) | 40 (42.1%) | 41 (61.2%) | <0.0001 | 37 (22.7%) | 42 (43.3%) | 42 (63.6%) | <0.0001 |
| Diabetes (%) | 10 (5.9%) | 10 (10.3%) | 13 (18.3%) | 0.004 | 9 (5.5%) | 10 (10.5%) | 10 (14.9%) | 0.02 | 9 (5.5%) | 10 (10.3%) | 10 (15.2%) | 0.02 |
| Hyperlipidemia (%) | 37 (21.9%) | 42 (43.3%) | 41 (57.8%) | <0.0001 | 33 (20.3%) | 41 (43.2%) | 40 (59.7%) | <0.0001 | 35 (21.5%) | 42 (43.3%) | 38 (57.6%) | <0.0001 |
| History of CAD (%) | 1 (0.6%) | 4 (4.1%) | 12 (16.9%) | <0.0001 | 1 (0.6%) | 4 (4.2%) | 12 (17.9%) | <0.0001 | 1 (0.6%) | 4 (4.1%) | 11 (16.7%) | <0.0001 |
| Family history of CAD (%) | 37 (21.9%) | 24 (24.7%) | 22 (31.0%) | 0.15 | 36 (22.1%) | 24 (25.3%) | 20 (29.9%) | 0.21 | 35 (21.5%) | 24 (24.7%) | 21 (31.8%) | 0.11 |
| History of LV dysfunction (%) | 1 (0.6%) | 2 (2.1%) | 3 (4.3%) | 0.05 | 1 (0.6%) | 2 (2.1%) | 3 (4.6%) | 0.05 | 1 (0.6%) | 2 (2.1%) | 3 (4.6%) | 0.05 |
| Smokers (%) | 71 (42.0%) | 52 (53.6%) | 46 (64.8%) | 0.0009 | 70 (42.9%) | 51 (53.7%) | 43 (64.2%) | 0.003 | 69 (42.3%) | 52 (53.6%) | 43 (65.2%) | 0.001 |
| Medications | ||||||||||||
| Aspirin (%) | 44 (26.0%) | 32 (33.0%) | 27 (38.0%) | 0.05 | 41 (25.2%) | 32 (33.7%) | 26 (38.8%) | 0.03 | 41 (25.2%) | 32 (33.0%) | 25 (37.9%) | 0.04 |
| Statin (%) | 27 (16.0%) | 29 (29.9%) | 35 (49.3%) | <0.0001 | 23 (14.1%) | 28 (29.5%) | 34 (50.8%) | <0.0001 | 25 (15.3%) | 29 (29.9%) | 33 (50.0%) | <0.0001 |
| Hypertensive Medication (%) | 38 (22.5%) | 42 (43.3%) | 45 (63.4%) | <0.0001 | 34 (20.9%) | 40 (42.1%) | 41 (61.2%) | <0.0001 | 35 (21.5%) | 42 (43.3%) | 42 (63.6%) | <0.0001 |
| Presenting Characteristics | ||||||||||||
| SBP, mmHg | 135 ± 20 | 142 ± 23 | 141 ± 24 | 0.02 | 135 ± 20 | 142 ± 23 | 139 ± 23 | 0.02 | 135 ± 20 | 142 ± 23 | 139 ± 23 | 0.03 |
| eGFR, ml/min/1.73 m2 | 87.3 ± 16.9 | 83.2 ± 18.3 | 79.8 ± 16.6 | 0.006 | 87.0 ± 17.0 | 82.8 ± 18.2 | 79.7 ± 17.0 | 0.01 | 87.1 ± 16.8 | 83.2 ± 18.3 | 79.2 ± 16.7 | 0.006 |
| CT Measurements | ||||||||||||
| LV ejection fraction, % | 68.4 ± 8.4 | 68.0 ± 8.8 | 66.4 ± 11.2 | 0.30 | 68.4 ± 8.5 | 67.8 ± 8.8 | 66.6 ± 11.3 | 0.38 | 68.5 ± 8.5 | 68.0 ± 8.8 | 66.7 ± 11.5 | 0.41 |
| RWT ratio | 0.35 ± 0.08 | 0.36 ± 0.08 | 0.37 ± 0.10 | 0.17 | 0.35 ± 0.08 | 0.36 ± 0.08 | 0.38 ± 0.10 | 0.18 | 0.35 ± 0.08 | 0.36 ± 0.08 | 0.37 ± 0.10 | 0.18 |
Table 4 shows the unadjusted and adjusted analyses for the association of the extent of coronary plaque and LVM and LVMi. For all 3 indexation cohorts, patients had an increase of 0.24 to 0.28 segments more plaques for every 20 g increase of LVM (all p≤0.02). Similarly, patients had more segments of plaques for every 10 unit increase of LVMi (all p≤0.02). After adjustment for potential confounders, both LVM and LVMi remained independent predictors of the extent of coronary plaque.
Table 4.
Unadjusted and adjusted multivariable linear regression models of the extent of plaque to left ventricular mass (LVM) and left ventricular mass index (LVMi) based on the 3 LVMi criteria.
| Unadjusted |
Model A† |
Model B†† |
||||
|---|---|---|---|---|---|---|
| β-estimate (95% CI) | p-value | β-estimate (95% CI) | p-value | β-estimate (95% CI) | p-value | |
| LVM/BSAASE cohort | ||||||
| LVM (per 20 g) | 0.28 (0.09, 0.48) | 0.004 | 0.24 (0.01, 0.47) | 0.04 | 0.27 (0.04, 0.50) | 0.02 |
| LVM/BSAASE (per 10 g/m2 ) | 0.40 (0.13, 0.66) | 0.003 | 0.28 (0.03, 0.54) | 0.03 | 0.32 (0.05, 0.58) | 0.02 |
| LVM/height2.7 cohort | ||||||
| LVM (per 20 g) | 0.28 (0.08, 0.49) | 0.007 | 0.27 (0.03, 0.50) | 0.02 | 0.29 (0.05, 0.53) | 0.02 |
| LVM/height2.7 (per 10 g/m2.7) | 0.74 (0.15, 1.32) | 0.01 | 0.77 (0.20, 1.35) | 0.009 | 0.80 (0.21, 1.39) | 0.008 |
| LVM/BSACT cohort | ||||||
| LVM (per 20 g) | 0.24 (0.04, 0.45) | 0.02 | 0.25 (0.004, 0.50) | 0.046 | 0.29 (0.04, 0.55) | 0.02 |
| LVM/BSACT (per 10 g/m2) | 0.33 (0.04, 0.62) | 0.02 | 0.30 (0.02, 0.59) | 0.04 | 0.34 (0.05, 0.64) | 0.02 |
Model A was adjusted for age, gender, race, hypertension, diabetes, hyperlipidemia, history of coronary artery disease, family history of coronary artery disease, history of left ventricular dysfunction, smoking, aspirin, statin, systolic blood pressure, estimated glomerular filtration rate, and left ventricular ejection fraction measured by CT. Body mass index was included only in the LVM model.
Model B was adjusted for all covariates in model A with the addition of relative wall thickness as a continuous variable.
Concentric remodeling and extent of coronary artery plaque
The patient characteristics between those with normal geometry and concentric remodeling are shown in Table 5. The majority of patients had normal geometry (81.2% to 81.8%), with 18.2% to 18.8% of patients with concentric remodeling. As expected, patients with concentric remodeling had higher RWT ratio than patients with normal geometry (all p<0.0001), since concentric remodeling is calculated based on RWT. Overall, patients with concentric remodeling were more likely to be men, have a family history of CAD, with a history of hypertension, and on anti-hypertensive medications than normal geometry patients (all p<0.05 except for hypertensive medications in the LVM/height2.7 cohort with p=0.06). All other patient characteristics were similar between patients with concentric remodeling and normal geometry (all p=NS).
Table 5.
Comparison of patient characteristics with normal geometry versus concentric remodeling.
| LVM/BSAASE cohort | LVM/height2.7 cohort | LVM/BSACT cohort | |||||||
|---|---|---|---|---|---|---|---|---|---|
| Normal geometry | Concentric remodeling | p-value | Normal geometry | Concentric remodeling | p-value | Normal geometry | Concentric remodeling | p-value | |
| Demographics, n (%) | 272 (81.2%) | 63 (18.8%) | 265 (81.8%) | 59 (18.2%) | 264 (81.5%) | 60 (18.5%) | |||
| Age, yrs | 52.4 ±11.5 | 53.6 ± 11.7 | 0.43 | 52.3 ± 11.5 | 53.3 ± 12.2 | 0.55 | 52.3 ± 11.5 | 53.8 ± 11.7 | 0.37 |
| Gender, male (%) | 152 (55.9%) | 53 (84.1%) | <0.0001 | 146 (55.1%) | 50 (84.8%) | <0.0001 | 146 (55.3%) | 51 (85.0%) | <0.0001 |
| Race, black (%) | 24 (8.8%) | 6 (9.5%) | 0.81 | 23 (8.7%) | 4 (6.8%) | 0.80 | 24 (9.1%) | 5 (8.3%) | 0.85 |
| Body mass index, kg/m2 | 28.7 ± 5.7 | 30.0 ± 6.1 | 0.12 | 28.5 ± 5.5 | 29.1 ± 5.1 | 0.50 | 28.7 ± 5.7 | 29.9 ± 6.2 | 0.14 |
| Risk factors | |||||||||
| Hypertension (%) | 94 (34.6%) | 32 (50.8%) | 0.02 | 88 (33.2%) | 28 (47.5%) | 0.04 | 90 (34.1%) | 30 (50.0%) | 0.02 |
| Diabetes (%) | 26 (9.6%) | 7 (11.1%) | 0.65 | 24 (9.1%) | 5 (8.5%) | 0.89 | 23 (8.7%) | 6 (10.0%) | 0.75 |
| Hyperlipidemia (%) | 98 (36.0%) | 21 (33.3%) | 0.77 | 94 (35.5%) | 19 (32.2%) | 0.76 | 94 (35.6%) | 20 (33.3%) | 0.74 |
| History of CAD (%) | 13 (4.8%) | 3 (4.8%) | 1.0 | 13 (4.9%) | 3 (5.1%) | 1.0 | 12 (4.6%) | 3 (5.0%) | 0.75 |
| Family history of CAD (%) | 59 (21.7%) | 24 (38.1%) | 0.009 | 57 (21.5%) | 23 (39.0%) | 0.007 | 57 (21.6%) | 23 (38.3%) | 0.007 |
| History of LV dysfunction (%) | 4 (1.5%) | 1 (1.6%) | 1.0 | 1 (1.5%) | 1 (1.7%) | 1.0 | 4 (1.5%) | 1 (1.7%) | 1.0 |
| Smokers (%) | 132 (48.5%) | 36 (57.1%) | 0.26 | 129 (48.7%) | 35 (59.3%) | 0.15 | 127 (48.1%) | 36 (60.0%) | 0.10 |
| Medications | |||||||||
| Aspirin (%) | 86 (31.6%) | 16 (25.4%) | 0.37 | 83 (31.3%) | 15 (25.4%) | 0.43 | 82 (31.1%) | 15 (25.0%) | 0.35 |
| Statin (%) | 74 (27.2%) | 16 (25.4%) | 0.88 | 70 (26.4%) | 14 (23.7%) | 0.74 | 71 (26.9%) | 15 (25.0%) | 0.76 |
| Hypertensive Medication (%) | 93 (34.2%) | 31 (49.2%) | 0.03 | 87 (32.8%) | 27 (45.8%) | 0.06 | 89 (33.7%) | 29 (48.3%) | 0.03 |
| Presenting Characteristics | |||||||||
| SBP, mmHg | 138 ± 22 | 139 ± 21 | 0.85 | 138 ± 22 | 137 ± 19 | 0.73 | 138 ± 22 | 138 ±18 | 0.91 |
| eGFR, ml/min/1.73 m2 | 85.0 ± 17.3 | 82.6 ± 18.3 | 0.33 | 84.7 ± 17.4 | 82.3 ± 18.5 | 0.35 | 84.8 ± 17.3 | 81.9 ± 18.2 | 0.24 |
| CT Measurements | |||||||||
| LV ejection fraction, % | 67.5 ± 9.5 | 69.8 ± 7.6 | 0.07 | 67.5 ± 9.5 | 69.7 ± 7.8 | 0.09 | 67.6 ± 9.5 | 70.1 ± 7.7 | 0.05 |
| RWT ratio | 0.33 ± 0.05 | 0.50 ± 0.07 | <0.0001 | 0.33 ± 0.05 | 0.50 ± 0.07 | <0.0001 | 0.33 ± 0.05 | 0.50 ± 0.07 | <0.0001 |
Abbreviations as in Table 1.
Patients with concentric remodeling had 1.1 to 1.3 more segments of coronary artery plaque as compared to those with normal geometry (LVM/BSAASE cohort: 3.3 segments vs 2.1 segments, p=0.036; LVM/height2.7 cohort: 3.2 segments vs 2.1 segments, p=0.05; LVM/BSACT cohort: 3.3 segments vs 2.0 segments, p=0.03). There were no significant gender differences in the extent of plaque in those with concentric remodeling as compared to normal geometry (all p-interaction=NS).
The proportion of patients with concentric remodeling was significantly greater in those with >4 segments than those with no plaque (LVM/BSAASE cohort: 27.1% vs 14.9 %, p=0.03; LVM/height2.7 cohort: 25.8% vs 14.7%, p= 0.048; LVM/BSACT cohort: 27.7% vs 14.2%, p=0.02). In addition, as shown in Figure 2, there was a gradient stepwise increase in the percentage of patients with concentric remodeling and extent of coronary plaque. Moreover, as depicted in Figure 3, patients with >4 segments of coronary plaques had 2-fold increase risk of having concentric remodeling as compared to those with no coronary plaque (LVM/BSAASE cohort: odds ratio [OR] 2.13, p=0.028; LVM/height2.7 cohort: OR 2.01, p=0.05; LVM/BSACT cohort: OR 2.32, p=0.018). There was no significant difference between those with 1–4 segments of plaques and no plaque (all p=NS).
Figure 2.

Proportion of patients with concentric remodeling as stratified by the number of segments with coronary artery plaque for each of the 3 LVMi cohorts. A gradient stepwise increase in the percentage of patients with concentric remodeling and extent of coronary plaque is noted. LVMi denotes left ventricular mass index.
Figure 3.
Odds ratio and 95% confidence interval for concentric remodeling as stratified by the 3 categories of extent of coronary plaque, with no plaque as the reference standard.
DISCUSSION
Our present analysis uses cardiac CT angiography and examines the association of LV mass measurements (LVM and LVMi) and LV geometry (concentric remodeling and normal geometry) to the extent of coronary artery plaque in subjects without LVH. Using 3 indexation criteria for LVMi to exclude LVH patients from our study cohorts, we found that both LVM and LVMi are independent predictors of coronary artery plaque burden in these patients without LVH. Furthermore, patients with concentric remodeling had higher plaque burden as compared to those with normal geometry. Interestingly, patients with the highest plaque burden (>4 segments) were more likely to have concentric remodeling than those without CAD. Our results are in keeping with recent report by the MESA (Multi-Ethnic Study of Atherosclerosis) findings that LV mass and concentric remodeling predicted coronary heart disease using cardiac magnetic resonance imaging [1].
In our study, we used 3 methods for indexation of LV mass and the cut-off values for the LV geometry and definition of LVH based on guidelines from echocardiography using BSA and height2.7 as well as a recent CT suggested BSA indexed values [6, 8, 9, 16]. While comparisons of different imaging modalities are of a concern, the differences between modalities are most vulnerable for volumetric measurements, and less so for mass assessment. Echocardiography, which uses geometric shape assumptions, typically underestimates volumes as compared to CT and cardiac magnetic resonance imaging [21, 22]. In contrast to volumes, LVM is not different between CT and CMR [22, 23] and not significantly different between CT and echocardiography for LVM indexed to BSA [21]. Moreover, the LV mass calculation from echocardiography appears quite robust and had been well established and validated against necropsy (r=0.90 p<0.0001) [24]. Our results support this as similar findings are seen consistently across the 3 indexation criteria used, regardless of whether the cut-points were based from BSA or height2.7 echocardiographic or CT values [6, 8, 9, 16].
Our results confirm report that patients with CAD had higher LVMi than matched normal control without CAD.[13] While prior studies have found an association between coronary artery calcium score to LVM and LVMi [10, 11, 25, 26], our study expands upon this relationship of using CT for assessing CAD by examining for the extent of coronary artery plaque using coronary CT angiography, which is a more accurate diagnostic tool for CAD assessment over calcium score. In contrast to studies that showed association with CAD and LV mass in African-Americans with LVH [10, 11, 26], our study cohort was predominantly non-black (91%), did not have LVH by CT, with a fraction reported to have pre-existing hypertension (36 to 37.7%). The high prevalence of hypertension in the absence of LVH may be attributed to the fact that most of our patients with hypertension were being treated on anti-hypertensive medications (all but 2 patients). In all 3 indexation cohorts, we found significant differences in LVM and LVMi between patients with a greater extent of coronary plaque burden (>4 segments of plaque) and those without any CAD using coronary CT angiography. In addition, after multivariable adjustment, we found that LVM and LVMi remained independently predictive of extent of coronary plaque burden, with an increase of 0.27 to 0.29 segments more plaque for every20 g increase of LVM, an increase of 0.32 to 0.34 segments more plaque for every 10 g/m2 increase of LVM/BSA, and an increase of 0.80 segments more plaque for every 10 g/m2.7 increase of LVM/height2.7. Although our cohort does not have LVH by CT, our results support the notion that the association between increased LVM and LVMi with CAD is a continuous spectrum with subclinical presentation even before the onset of overt LVH occurs.
The clinical significance of LV geometry and particularly concentric remodeling is more controversial. While the landmark trial by Koren et al in 1991 found that patients with concentric remodeling had 6% 10-year mortality as compared to 1% in those with normal geometry (p<0.001)[27], opponents which included a Framingham Heart Study in 1995 have stated that LV mass but not geometry provided incremental prognostic value[28–30]. Ghali et al subsequently reported that LVH patients had increase in mortality but that no substantial increase in mortality was noted in patients with concentric remodeling [7]. On the contrary, in several studies, patients with concentric remodeling had a worse prognosis with ~2-fold increase in risk for cardiovascular events and mortality than those with normal LV geometry [31–33]. Our study supports the latter opinion and may provide a potential explanation for their findings. In our study, we found that patients with concentric remodeling had a greater extent of coronary artery plaque burden (1.1 to 1.3 more segments of plaque) as compared to patients with normal geometry. In addition, patients with >4 segments of plaque had a 2-fold increase risk of having concentric remodeling when compared to those with no plaque. Thus, there appears to be an association between concentric remodeling and extent of coronary plaque burden, which may explain the increase risk in cardiovascular mortality in prior studies [31–33].
Concentric remodeling which is believed to be a form of cardiac adaptation can convert back to normal geometry with a 36% improvement in survival and a 54% increase in mortality if progressed to LVH in patients with normal LV function [33]. It has also been shown to be related to reduced regional systolic function, particularly if the left anterior descending territory is involved, suggesting a transitional compensatory state from concentric remodeling to ischemic-induced heart failure [34]. More recently, the VALIANT (Valsartan in Acute myocardial infarction) trial demonstrated that in addition to LVM and LVMi, abnormal LV geometry had increased risk in morbidity and mortality in the high-risk post-myocardial infarction population; and in these patients, concentric remodeling conferred a 3-fold increase in hazard in mortality over those with normal geometry [2]. Clinically, although concentric remodeling had initially been thought to be a benign process, recent data including ours suggest that it is associated with a greater degree of coronary artery plaque. Thus, if detected, aggressive medical therapy is warranted and should be geared to reverse the remodeling process and reduce coronary heart disease risk.
Study limitations
Several limitations are noteworthy in the interpretation of our study results. This is a substudy of the ROMICAT trial, which consists of emergency department chest pain patients with low- to intermediate- risk for ACS. The generalizability of our results may be limited to this patient population. While we found an association between concentric remodeling and extent of coronary plaque burden, at least in hypertensive patients without angiographic evidence of CAD, concentric remodeling has also been associated with coronary ischemia due to the presence of coronary microangiopathy (characterized by functional and structural abnormalities). The role of microcirculation abnormalities has been observed by the close relationship between RWT and structural alterations in small resistance arteries with a reduction in coronary flow reserve and may not be due exclusively to coronary atherosclerosis [35]. Thus, in addition to CAD burden, the role of structural changes and remodeling of small vessels on the reduced coronary flow reserve in patients with hypertension may be as important a process in the ischemic pathway [36], as evident by enhanced myocardial perfusion with vasodilatory therapy [37]. Lastly, the radiation exposure [38] inherent in the acquisition of CT images should preclude cardiac CT from being performed solely for the evaluation of LV function, morphology, or mass. However, we were able to perform our analysis as our CT acquisitions were performed for coronary analysis and were acquired using retrospective gating, providing us with data from both end-systole and end-diastole. Dose-saving algorithms, such as ECG tube modulation as described in our study and use of lower tube current and voltage, could still allow assessment of the LV mass measurements at end-diastole, though our analysis and results may not be applicable should prospective triggering scans were employed.
CONCLUSION
Cardiac CT allows for simultaneous assessment of LV mass measurements and coronary artery disease. Both LVM and LVMi are independent predictors of coronary artery plaque burden even in patients without LVH. Concentric remodeling is associated with a greater degree of coronary plaque burden. These findings may be used to identify patients who may benefit from more aggressive medical therapy for both subclinical CAD and hypertension.
Acknowledgments
We gratefully acknowledge the enthusiastic support in patient enrollment of the team of faculty, residents, nursing and administrative staff of the Emergency Department Services of the Massachusetts General Hospital.
Sources of Funding: This work was supported by the NIH (R01 HL080053), and in part supported by Siemens Medical Solutions and General Electrics Healthcare. Drs. Blankstein, Rogers, and Truong received support from NIH grant T32HL076136. Dr. Truong also received support from NIH grant L30HL093896. Dr. Toepker was supported by the Erwin Schroedinger fellowship abroard. Amir A. Mahabadi was supported by a grant from the German National Academic Foundation.
Footnotes
Potential Conflict of Interests: No conflicts of interest to be disclosed.
References
- 1.Bluemke DA, Kronmal RA, Lima JA, Liu K, Olson J, Burke GL, et al. The relationship of left ventricular mass and geometry to incident cardiovascular events: the MESA (Multi-Ethnic Study of Atherosclerosis) study. J Am Coll Cardiol. 2008;52:2148–2155. doi: 10.1016/j.jacc.2008.09.014. [DOI] [PMC free article] [PubMed] [Google Scholar]
- 2.Verma A, Meris A, Hicham S, Ghali JK, Arnold JMO, Bourgoun M, et al. Prognostic Implications of Left Ventricular Mass and Geometry Following Myocardial Infarction. J Am Coll Cardiol Img. 2008;1:582–591. doi: 10.1016/j.jcmg.2008.05.012. [DOI] [PubMed] [Google Scholar]
- 3.Gottdiener JS, Arnold AM, Aurigemma GP, Polak JF, Tracy RP, Kitzman DW, et al. Predictors of congestive heart failure in the elderly: the Cardiovascular Health Study. J Am Coll Cardiol. 2000;35:1628–1637. doi: 10.1016/s0735-1097(00)00582-9. [DOI] [PubMed] [Google Scholar]
- 4.Drazner MH, Rame JE, Marino EK, Gottdiener JS, Kitzman DW, Gardin JM, et al. Increased left ventricular mass is a risk factor for the development of a depressed left ventricular ejection fraction within five years: the Cardiovascular Health Study. J Am Coll Cardiol. 2004;43:2207–2215. doi: 10.1016/j.jacc.2003.11.064. [DOI] [PubMed] [Google Scholar]
- 5.Turakhia MP, Schiller NB, Whooley MA. Prognostic significance of increased left ventricular mass index to mortality and sudden death in patients with stable coronary heart disease (from the Heart and Soul Study) Am J Cardiol. 2008;102:1131–1135. doi: 10.1016/j.amjcard.2008.06.036. [DOI] [PMC free article] [PubMed] [Google Scholar]
- 6.Liao Y, Cooper RS, Durazo-Arvizu R, Mensah GA, Ghali JK. Prediction of mortality risk by different methods of indexation for left ventricular mass. J Am Coll Cardiol. 1997;29:641–647. doi: 10.1016/s0735-1097(96)00552-9. [DOI] [PubMed] [Google Scholar]
- 7.Ghali JK, Liao Y, Cooper RS. Influence of left ventricular geometric patterns on prognosis in patients with or without coronary artery disease. J Am Coll Cardiol. 1998;31:1635–1640. doi: 10.1016/s0735-1097(98)00131-4. [DOI] [PubMed] [Google Scholar]
- 8.Lang RM, Bierig M, Devereux RB, Flachskampf FA, Foster E, Pellikka PA, et al. Recommendations for chamber quantification. Eur J Echocardiogr. 2006;7:79–108. doi: 10.1016/j.euje.2005.12.014. [DOI] [PubMed] [Google Scholar]
- 9.de Simone G, Daniels SR, Devereux RB, Meyer RA, Roman MJ, de Divitiis O, et al. Left ventricular mass and body size in normotensive children and adults: assessment of allometric relations and impact of overweight. J Am Coll Cardiol. 1992;20:1251–1260. doi: 10.1016/0735-1097(92)90385-z. [DOI] [PubMed] [Google Scholar]
- 10.Tang W, Arnett DK, Province MA, Lewis CE, North K, Carr JJ, et al. Racial differences in the association of coronary calcified plaque with left ventricular hypertrophy: the National Heart, Lung, and Blood Institute Family Heart Study and Hypertension Genetic Epidemiology Network. Am J Cardiol. 2006;97:1441–1448. doi: 10.1016/j.amjcard.2005.11.076. [DOI] [PubMed] [Google Scholar]
- 11.Liao Y, Cooper RS, McGee DL, Mensah GA, Ghali JK. The relative effects of left ventricular hypertrophy, coronary artery disease, and ventricular dysfunction on survival among black adults. JAMA. 1995;273:1592–1597. [PubMed] [Google Scholar]
- 12.Zabalgoitia M, Berning J, Koren MJ, Stoylen A, Nieminen MS, Dahlof B, et al. Impact of coronary artery disease on left ventricular systolic function and geometry in hypertensive patients with left ventricular hypertrophy (the LIFE study) Am J Cardiol. 2001;88:646–650. doi: 10.1016/s0002-9149(01)01807-0. [DOI] [PubMed] [Google Scholar]
- 13.Gatzka CD, Cameron JD, Kingwell BA, Dart AM. Relation between coronary artery disease, aortic stiffness, and left ventricular structure in a population sample. Hypertension. 1998;32:575–578. doi: 10.1161/01.hyp.32.3.575. [DOI] [PubMed] [Google Scholar]
- 14.Stolzmann P, Scheffel H, Leschka S, Schertler T, Frauenfelder T, Kaufmann PA, et al. Reference values for quantitative left ventricular and left atrial measurements in cardiac computed tomography. Eur Radiol. 2008;18:1625–1634. doi: 10.1007/s00330-008-0939-4. [DOI] [PubMed] [Google Scholar]
- 15.Hoffmann U, Bamberg F, Chae CU, Nichols JH, Rogers IS, Seneviratne SK, et al. Coronary computed tomography angiography for early triage of patients with acute chest pain: the ROMICAT (Rule Out Myocardial Infarction using Computer Assisted Tomography) trial. J Am Coll Cardiol. 2009;53:1642–1650. doi: 10.1016/j.jacc.2009.01.052. [DOI] [PMC free article] [PubMed] [Google Scholar]
- 16.Budoff MJ, Ahmadi N, Sarraf G, Gao Y, Chow D, Flores F, et al. Determination of left ventricular mass on cardiac computed tomographic angiography. Acad Radiol. 2009;16:726–732. doi: 10.1016/j.acra.2008.12.022. [DOI] [PubMed] [Google Scholar]
- 17.Austen WG, Edwards JE, Frye RL, Gensini GG, Gott VL, Griffith LS, et al. A reporting system on patients evaluated for coronary artery disease. Report of the Ad Hoc Committee for Grading of Coronary Artery Disease, Council on Cardiovascular Surgery, American Heart Association. Circulation. 1975;51:5–40. doi: 10.1161/01.cir.51.4.5. [DOI] [PubMed] [Google Scholar]
- 18.Bamberg F, Dannemann N, Shapiro MD, Seneviratne SK, Ferencik M, Butler J, et al. Association between cardiovascular risk profiles and the presence and extent of different types of coronary atherosclerotic plaque as detected by multidetector computed tomography. Arterioscler Thromb Vasc Biol. 2008;28:568–574. doi: 10.1161/ATVBAHA.107.155010. [DOI] [PubMed] [Google Scholar]
- 19.DuBois EF. A formula to estimate the approximate surface area if height and weight be known. Archives of Internal Medicine. 1916;17:865–871. [Google Scholar]
- 20.Levey AS, Bosch JP, Lewis JB, Greene T, Rogers N, Roth D. A more accurate method to estimate glomerular filtration rate from serum creatinine: a new prediction equation. Modification of Diet in Renal Disease Study Group. Ann Intern Med. 1999;130:461–470. doi: 10.7326/0003-4819-130-6-199903160-00002. [DOI] [PubMed] [Google Scholar]
- 21.Stolzmann P, Scheffel H, Trindade PT, Plass AR, Husmann L, Leschka S, et al. Left ventricular and left atrial dimensions and volumes: comparison between dual-source CT and echocardiography. Invest Radiol. 2008;43:284–289. doi: 10.1097/RLI.0b013e3181626853. [DOI] [PubMed] [Google Scholar]
- 22.Guo YK, Yang ZG, Ning G, Rao L, Dong L, Pen Y, et al. Sixty-four-slice multidetector computed tomography for preoperative evaluation of left ventricular function and mass in patients with mitral regurgitation: comparison with magnetic resonance imaging and echocardiography. Eur Radiol. 2009 doi: 10.1007/s00330-009-1392-8. [DOI] [PubMed] [Google Scholar]
- 23.Schlosser T, Mohrs OK, Magedanz A, Voigtlander T, Schmermund A, Barkhausen J. Assessment of left ventricular function and mass in patients undergoing computed tomography (CT) coronary angiography using 64-detector-row CT: comparison to magnetic resonance imaging. Acta Radiol. 2007;48:30–35. doi: 10.1080/02841850601067611. [DOI] [PubMed] [Google Scholar]
- 24.Devereux RB, Alonso DR, Lutas EM, Gottlieb GJ, Campo E, Sachs I, et al. Echocardiographic assessment of left ventricular hypertrophy: comparison to necropsy findings. Am J Cardiol. 1986;57:450–458. doi: 10.1016/0002-9149(86)90771-x. [DOI] [PubMed] [Google Scholar]
- 25.Gardin JM, Iribarren C, Detrano RC, Liu K, Schreiner PJ, Loria CM, et al. Relation of echocardiographic left ventricular mass, geometry and wall stress, and left atrial dimension to coronary calcium in young adults (the CARDIA study) Am J Cardiol. 2005;95:626–629. doi: 10.1016/j.amjcard.2004.11.010. [DOI] [PubMed] [Google Scholar]
- 26.Tong W, Lima JA, Lai H, Celentano DD, Dai S, Lai S. Relation of coronary artery calcium to left ventricular mass in African-Americans. Am J Cardiol. 2004;93:490–492. doi: 10.1016/j.amjcard.2003.10.053. [DOI] [PubMed] [Google Scholar]
- 27.Koren MJ, Devereux RB, Casale PN, Savage DD, Laragh JH. Relation of left ventricular mass and geometry to morbidity and mortality in uncomplicated essential hypertension. Ann Intern Med. 1991;114:345–352. doi: 10.7326/0003-4819-114-5-345. [DOI] [PubMed] [Google Scholar]
- 28.Verdecchia P, Schillaci G, Borgioni C, Ciucci A, Gattobigio R, Zampi I, et al. Prognostic value of left ventricular mass and geometry in systemic hypertension with left ventricular hypertrophy. Am J Cardiol. 1996;78:197–202. doi: 10.1016/s0002-9149(96)90395-1. [DOI] [PubMed] [Google Scholar]
- 29.Krumholz HM, Larson M, Levy D. Prognosis of left ventricular geometric patterns in the Framingham Heart Study. J Am Coll Cardiol. 1995;25:879–884. doi: 10.1016/0735-1097(94)00473-4. [DOI] [PubMed] [Google Scholar]
- 30.Fox ER, Taylor J, Taylor H, Han H, Samdarshi T, Arnett D, et al. Left ventricular geometric patterns in the Jackson cohort of the Atherosclerotic Risk in Communities (ARIC) Study: clinical correlates and influences on systolic and diastolic dysfunction. Am Heart J. 2007;153:238–244. doi: 10.1016/j.ahj.2006.09.013. [DOI] [PubMed] [Google Scholar]
- 31.Pierdomenico SD, Lapenna D, Bucci A, Manente BM, Cuccurullo F, Mezzetti A. Prognostic value of left ventricular concentric remodeling in uncomplicated mild hypertension. Am J Hypertens. 2004;17:1035–1039. doi: 10.1016/j.amjhyper.2004.06.016. [DOI] [PubMed] [Google Scholar]
- 32.Verdecchia P, Schillaci G, Borgioni C, Ciucci A, Battistelli M, Bartoccini C, et al. Adverse prognostic significance of concentric remodeling of the left ventricle in hypertensive patients with normal left ventricular mass. J Am Coll Cardiol. 1995;25:871–878. doi: 10.1016/0735-1097(94)00424-O. [DOI] [PubMed] [Google Scholar]
- 33.Milani RV, Lavie CJ, Mehra MR, Ventura HO, Kurtz JD, Messerli FH. Left ventricular geometry and survival in patients with normal left ventricular ejection fraction. Am J Cardiol. 2006;97:959–963. doi: 10.1016/j.amjcard.2005.10.030. [DOI] [PubMed] [Google Scholar]
- 34.Rosen BD, Edvardsen T, Lai S, Castillo E, Pan L, Jerosch-Herold M, et al. Left ventricular concentric remodeling is associated with decreased global and regional systolic function: the Multi-Ethnic Study of Atherosclerosis. Circulation. 2005;112:984–991. doi: 10.1161/CIRCULATIONAHA104.500488. [DOI] [PubMed] [Google Scholar]
- 35.Schafer S, Kelm M, Mingers S, Strauer BE. Left ventricular remodeling impairs coronary flow reserve in hypertensive patients. J Hypertens. 2002;20:1431–1437. doi: 10.1097/00004872-200207000-00031. [DOI] [PubMed] [Google Scholar]
- 36.Rizzoni D, Palombo C, Porteri E, Muiesan ML, Kozakova M, La Canna G, et al. Relationships between coronary flow vasodilator capacity and small artery remodelling in hypertensive patients. J Hypertens. 2003;21:625–631. doi: 10.1097/00004872-200303000-00030. [DOI] [PubMed] [Google Scholar]
- 37.Buus NH, Bottcher M, Jorgensen CG, Christensen KL, Thygesen K, Nielsen TT, et al. Myocardial perfusion during long-term angiotensin-converting enzyme inhibition or beta-blockade in patients with essential hypertension. Hypertension. 2004;44:465–470. doi: 10.1161/01.HYP.0000141273.72768.b7. [DOI] [PubMed] [Google Scholar]
- 38.Einstein AJ, Henzlova MJ, Rajagopalan S. Estimating risk of cancer associated with radiation exposure from 64-slice computed tomography coronary angiography. JAMA. 2007;298:317–323. doi: 10.1001/jama.298.3.317. [DOI] [PubMed] [Google Scholar]