Abstract
Glucose regulates programs of gene expression that orchestrate changes in cellular phenotype in several metabolically active tissues. Carbohydrate response element-binding protein (ChREBP) and its binding partner, Mlx, mediate glucose-regulated gene expression by binding to carbohydrate response elements on target genes, such as the prototypical glucose-responsive gene, liver-type pyruvate kinase (Pklr). c-Myc is also required for the glucose response of the Pklr gene, although the relationship between c-Myc and ChREBP has not been defined. Here we describe the molecular events of the glucose-mediated activation of Pklr and determine the effects of decreasing the activity or abundance of c-Myc on this process. Time-course chromatin immunoprecipitation revealed a set of transcription factors [hepatocyte nuclear factor (HNF)1α, HNF4α, and RNA polymerase II (Pol II)] constitutively resident on the Pklr promoter, with a relative enrichment of acetylated histones 3 and 4 in the same region of the gene. Glucose did not affect HNF1α binding or the acetylation of histones H3 or H4. By contrast, glucose promoted the recruitment of ChREBP and c-Myc and increased the occupancy of HNF4α and RNA Pol II, which were coincident with the glucose-mediated increase in transcription as determined by a nuclear run-on assay. Depletion of c-Myc activity using a small molecule inhibitor (10058-F4/1RH) abolished the glucose-mediated recruitment of HNF4α, ChREBP, and RNA Pol II, without affecting basal gene expression, histone acetylation, and HNF1α or basal HNF4α occupancy. The activation and recruitment of ChREBP to several glucose-responsive genes were blocked by 1RH, indicating a general necessity for c-Myc in this process.
Inhibitors of c-Myc block the recruitment of ChREBP to the carbohydrate response elements of glucose-responsive genes without affecting basal transcription.
Cells must adapt to changes in metabolic fuel availability by altering their phenotype in a physiologically appropriate manner. Thus, many tissues perceive and respond to changes in blood glucose levels by altering the expression of sets of genes the function of which is to cope with the changing metabolic environment. Failure to do so leads to metabolic disorders such as the metabolic syndrome and diabetes (1). One way that cells perceive changes in glucose is through activation of the glucose-sensing transcription factor, carbohydrate response element binding protein (ChREBP), a basic/helix-loop-helix/leucine zipper protein expressed in many metabolically important tissues such as liver, pancreatic β-cells, adipose tissue, skeletal muscle, intestine, and brain (2).
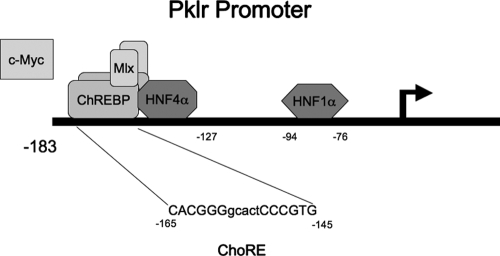
The liver-type pyruvate kinase gene (Pklr) encodes an enzyme that catalyzes the conversion of phosphoenolpyruvate to pyruvate, the last step of glycolysis, and is a glucose-responsive ChREBP target gene in hepatocytes and pancreatic β-cells (3,4). Pklr is the prototypical gene for studying the molecular mechanisms for the regulation of gene expression by glucose, in part because it has no insulin response elements and responds exclusively to glucose in both liver and β-cell models (5,6). The Pklr promoter has been studied in detail, and the transcription factors responsible for both basal and carbohydrate-dependent transcription have been described (7) (see Fig. 1).
Figure 1.
The Pklr promoter. The glucose-responsive promoter of Pklr is characterized by two heterodimer pairs of ChREBP and Mlx bound to a carbohydrate response element (ChoRE, located from −165 to −145 bp with respect to the transcription start site) located immediately adjacent to an obligate HNF4α-binding site (also known as the L3 element; located from −145 to −127 bp). Downstream is an element important for basal expression that binds HNF1α, located from −94 to −76 bp relative to the transcription start site. The ChoRE is composed of two E-box-like elements separated by 5 bp. c-Myc is required for the glucose response and is recruited to the promoter, but the exact binding sites have not been described.
The glucose response of Pklr is mediated by ChREBP, a member of the c-Myc gene family (8). Under low-glucose conditions ChREBP remains in the cytoplasm due to cAMP-dependent protein kinase-mediated phosphorylation, and an increase in glucose metabolism promotes dephosphorylation and entry of ChREBP into the nucleus (4). Additional mechanisms are required for glucose-mediated transcription because mutations of the cAMP-dependent protein kinase phosphoacceptor sites fail to confer dominant positive activity, and several highly conserved domains in the amino terminus (Mondo Conserved Regions 1–5) confer inhibitory and stimulatory functions (9,10,11,12,13). Furthermore, glucose is required for the transactivation of DNA-bound ChREBP, because Gal4/ChREBP chimeras cannot drive transcription in the absence of glucose (10,12).
Once in the nucleus, ChREBP binds to carbohydrate response elements (ChoREs), along with its heterodimer partner, Mlx. ChoREs are composed of two E-box-like elements separated by 5 bp (see Fig. 1). Hepatocyte nuclear factor (HNF)4α, mutations of which are responsible for maturation onset diabetes of the young 1 (14), acts as an obligate accessory factor for the glucose response of Pklr (Ref15 and see Fig. 1). The binding of HNF4α is required for the glucose response (9,15), and the integrity of the ChoRE (located from −165 to −145 bp with respect to the transcription start site); the HNF4α-binding site (also known as the L3 element; located from −145 to −127 bp), and the HNF1α-binding site (located from −94 to −76 bp) are required for normal basal expression of Pklr (9,16).
c-Myc, a basic/helix-loop-helix/leucine zipper transcription factor that binds DNA with its heterodimer partner, Max, is best known for its role as an oncogene. Overexpression of c-Myc, common in human cancers, affects proliferation, apoptosis, and numerous other cellular processes, including the regulation of glucose metabolism (17). Indeed, the process by which tumor cells increase glucose metabolism to provide ATP by glycolysis, the Warburg effect, generally requires c-Myc, and several classic c-Myc target genes encode glycolytic enzymes (18). Thus, it is perhaps not surprising that c-Myc plays a significant role in glucose homeostasis. Evidence for this is provided by experiments wherein a modest 3-fold overexpression of c-Myc in the liver of transgenic animals is protective against the metabolic perturbations of streptozotocin-induced diabetes, without causing liver carcinoma (19). In addition, endogenous c-Myc is required for glucose-regulated gene expression; attenuation of c-Myc abundance or activity diminishes the glucose response of Pklr in both liver and pancreatic β-cells (10,20). Furthermore, c-Myc, along with ChREBP, is actively recruited to the Pklr promoter in response to glucose (10). What is not known is the relationship between the necessity for c-Myc and ChREBP for a glucose response.
In the present study, we investigated the molecular details of Pklr activation immediately after exposure to glucose, with a particular focus on the relationship between the requirements for c-Myc and ChREBP. Using a quantitative chromatin immunoprecipitation (ChIP) assay, we measured how glucose affected the acetylated state of histones and the dynamic binding of ChREBP, HNF4α, HNF1α, c-Myc, and RNA polymerase II (Pol II) to the Pklr gene. The binding of these factors was compared with the rate of Pklr transcription by nuclear run-on assay. Whereas ChREBP was recruited to a single element (the ChoRE), c-Myc was recruited to a broad region of the Pklr gene, both upstream and downstream of the transcription start site. Using a small molecule inhibitor of c-Myc activity (21,22), we found that c-Myc is required for the recruitment of HNF4α, ChREBP, and RNA Pol II to the Pklr promoter by glucose but has no effect on basal transcription. We also found that several other ChREBP-dependent glucose-responsive genes require c-Myc for glucose-mediated gene expression without affecting basal expression, while simultaneously classic E-box-containing c-Myc target genes require c-Myc for complete basal expression.
Results
Pklr promoter architecture under basal (low glucose) conditions, and after the glucose-stimulated recruitment of several transcription factors that activate Pklr transcription
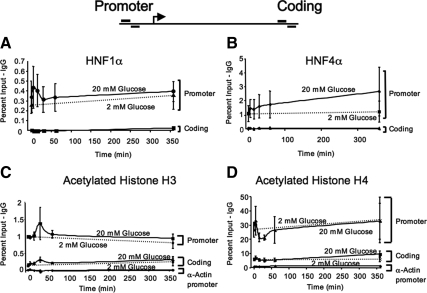
ChIP experiments were performed to characterize the dynamic interactions of various transcription factors and chromatin marks on the Pklr gene at times ranging from 5 min to 6 h after exposure to 20 mm glucose. We found that HNF1α was associated with the Pklr promoter in both low and high glucose using primers that flank the Pklr ChoRE (from −165 to −149 bp with respect to the transcription start site). HNF1α occupied the ChoRE region of Pklr, but not a control, coding region located approximately 6000 bp downstream of the transcription start site. The binding of HNF1α did not significantly change between low and high glucose over the course of the experiment (Fig. 2A). This finding is consistent with the fact that HNF1α binds the L1 element of the Pklr promoter (between −94 to −76 bp relative to the transcription start site) and is required for basal, but not glucose-mediated, transcription of Pklr (23,24). NF1 family members, which bind adjacent to HNF1α (between −116 to −99), and which interact synergistically with HNF1α to promote basal transcription to Pklr (25), were also not responsive to glucose (data not shown). The glucose response of Pklr requires the binding of HNF4α to a defined element (−131 to −143 bp with respect to the transcription start site) that acts as an accessory factor to the ChoRE (15). HNF4α was bound to the promoter region of Pklr with high specificity (10-fold over the IgG control) and significantly more than in the coding region (Fig. 1B). However, in this particular experiment glucose had no significant effect on HNF4α binding, although it trended upward over the 6-h course of the experiment, and statistical significance was obtained in other experimental contexts (see Fig. 7 and Ref. 9).
Figure 2.
The Pklr promoter is hyperacetylated independent of glucose concentration. 832/13 cells were pretreated for 16 h with 2 mm glucose, after which 18 mm glucose was added to the high-glucose treatment group, whereas the control group was left untreated. A quantitative ChIP assay was performed at different time points, from 0–360 min, using antibodies directed against HNF1α (A), HNF4α (B), acetylated histone H3 (C), acetylated histone H4 (D), or an IgG control. Purified DNA was analyzed by quantitative real-time PCR using primers that either flanked the ChoRE of the Pklr promoter or that amplified a coding region approximately 6000 bp downstream of the transcription start site (see diagram above the panels). The graphs represent the average of the percent of input from at least three independent experiments ±se after the background IgG values were subtracted. The dashed line represents the 2 mm glucose treatment sampled at the 0- and 360-min time points.
Figure 7.
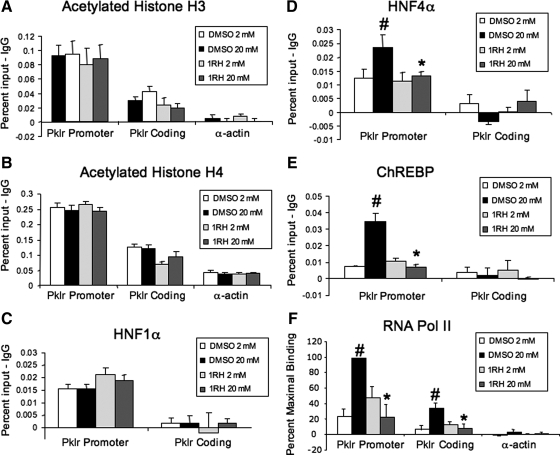
1RH blocks the glucose-mediated recruitment of activating transcription factors to the Pklr gene. INS-1-derived 832/13 cells were treated for 16 h with 40 μm 1RH or vehicle control, followed by 6 h with 2 or 20 mm glucose as in Fig. 2. Cells were fixed with formaldehyde, chromatin was isolated and sheared, and protein-DNA complexes were immunoprecipitated with antibodies directed against acetylated histone H3 (A), acetylated histone H4 (B), HNF1α (C), HNF4α (D), ChREBP (E), or RNA Pol II (F). DNA was purified and used as template for PCR using primers specific for the promoter region of the Pklr gene or, as negative controls the coding region of Pklr, or α-actin. Shown are the means of three independent experiments after subtracting the IgG background (±se). #, P < 0.05 for 2 mm glucose vs. 20 mm glucose; *, P < 0.05 for 20 mm glucose vehicle vs. 20 mm glucose 1RH.
The activation of a gene is often accompanied by an increase in the acetylation of histones 3 and 4 (H3, and H4, respectively) in regions surrounding the transcription start site. This allows transcription factors and components of the initiation complex greater access to specific DNA-binding sites (26). Binding of both HNF1α and HNF4α leads to acetylation through the recruitment of coactivators, such as cAMP response element-binding protein-binding protein (CBP) or p300, which contain histone acetyltransferase activity (27,28). Therefore we tested whether glucose affected the acetylation status of histones H3 or H4 associated with the Pklr gene promoter. Both species of histones were highly acetylated independent of glucose as compared with the transcriptionally inactive α-actin gene promoter (Fig. 2, C and D). Further, the levels of acetylation on histones H3 and H4 were 5-fold higher in the promoter region than in the coding region of the Pklr gene. We observed a dip in histone H4 acetylation on the promoter during the early time points (15 and 30 min) with corresponding increases in the coding region (significant) and promoter region (trend) of histone H3 acetylation after 30 min exposure to 20 mm glucose. Together, the findings that HNF1α and HNF4α are constitutively bound with high levels of histone H3 and H4 acetylation in both low and high glucose, and that the C-terminal domain of RNA Pol II is phosphorylated on serine 5 at low glucose concentrations (29,30) demonstrate that the Pklr promoter exists in a conformation consistent with low-level basal transcriptional activity, with RNA Pol II bound and paused, before stimulation by increased glucose metabolism.
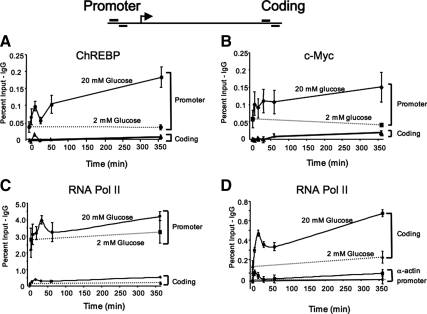
Using the ChIP assay, Fig. 3A shows that a small amount of ChREBP was bound to the region of the Pklr promoter containing the ChoRE at 2 mm glucose when compared with the IgG control, or to the coding region of the gene. ChREBP was actively recruited to the Pklr gene promoter by 20 mm glucose, which was biphasic over the course of the experiment, with peaks at 15 min and 6 h. We have previously shown that c-Myc is necessary for a complete glucose response, and that glucose metabolism results in the recruitment of c-Myc to the Pklr promoter (10,20). In the present study, glucose increased the amount of c-Myc bound to the Pklr promoter from 5 min after exposure, with sustained interaction for at least 6 h (Fig. 3B). Using the same assay, we found that RNA Pol II was loaded on the Pklr gene promoter before exposure to high glucose (Fig. 3C). Glucose increased the recruitment of RNA Pol II in a biphasic pattern with peaks at 30 min and 6 h. Notably, glucose promoted an increase in the binding of RNA Pol II in the coding region of the Pklr gene that mimicked the pattern seen in the promoter region, but on a smaller scale, and was most likely reflective of the procession of RNA Pol II through the gene (Fig. 3D).
Figure 3.
Glucose recruits activating transcription factors to the Pklr promoter. The 832/13 cells were pretreated with 2 mm glucose for 16 h and then were treated as in Fig. 2 with 20 mm glucose for various lengths of time. At the indicated times, cells were fixed with formaldehyde, chromatin was sheared, and protein-DNA complexes were immunoprecipitated using an antibody directed against ChREBP (A), c-Myc (B), RNA Pol II (C and D), or normal rabbit IgG. The DNA was purified and used as template in PCRs using primers flanking the ChoRE of the Pklr gene promoter, or primers specific for the coding region of the Pklr gene (see diagram above panels). Shown are the means from five independent experiments (±se), after subtracting the IgG background. The dashed lines represent the 2 mm glucose treatment.
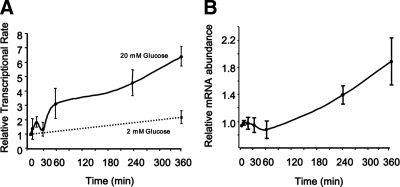
A nuclear run-on assay was used to correlate the rate of transcription of the Pklr gene with the binding of the factors to the gene promoter in response to glucose (Fig. 4A). Exposure to high concentrations of glucose resulted in a biphasic increase of Pklr gene transcription, with peak rates seen at 15 min and 6 h, coinciding with the recruitment of ChREBP, c-Myc, and RNA Pol II. Cytoplasmic RNA was collected from the same cells used in the nuclear run-on assay to measure Pklr mRNA abundance simultaneously (Fig. 4B). Accumulation of mature Pklr mRNA appeared to follow the transcriptional rate; however, significant increases of Pklr mRNA only occurred in the second of the two phases of increased transcription after treatment with high glucose. Careful alignment of the recruitment of ChREBP, c-Myc, HNF4α, and RNA Pol II demonstrated that all of these factors arrived simultaneously after glucose treatment (see Supplemental Fig. 1 published on The Endocrine Society's Journals Online web site at http://mend.endojournals.org).
Figure 4.
Glucose increases the rate of Pklr gene transcription. 832/13 cells were treated with 20 mm glucose, as in Figs. 2 and 3, for times ranging from 5 min to 6 h. A, Nuclei were isolated, and transcription was allowed to proceed by incubation with rGTP, rCTP, rATP, and biotin-16-UTP. Nuclear RNA was extracted, and the nascent pre-mRNA was separated using streptavidin magnetic beads. The relative abundance of Pklr pre-mRNA was determined by quantitative real-time PCR, normalized to β-actin pre-mRNA. Primers overlapping the second exon and second intron were designed to avoid measuring mature mRNA. B, Total RNA was isolated from the cytoplasmic extracts from the same cells used to isolate nuclear RNA for A. RT-PCR was performed using primers for mature, exon-spanning mRNA for Pklr and β-actin. The means of four independent experiments are shown (±se), and the dashed line represents the 2 mm glucose treatment.
ChREBP and c-Myc bind to different sites along the Pklr gene promoter
To better understand the relationship between ChREBP and c-Myc binding in response to glucose, the ChIP assay was expanded to include several primer pairs specific to a variety of regions upstream, downstream, and including the transcription start site of Pklr. As shown in Fig. 5A, ChREBP was recruited after a 6-h exposure to 20 mm glucose to a single element on Pklr, corresponding to the ChoRE located between −149 and −165 bp with respect to the transcription start site. By contrast, using the same chromatin input, c-Myc was recruited by glucose to a broad area of the Pklr gene, including the regions between the ChoRE, the start site, and +500 bp with respect to the start site (Fig. 5B), as well as two regions located at −2000 and −4000 bp upstream of the transcription start site (data not shown). No perfect consensus c-Myc E-box sequences [CACGTG, (31)] were found in the Pklr gene from −1000 bp to + 1000 bp with respect to the start site using a web-based DNA pattern recognition program http://www.bioinformatics.org/sms2/dna_pattern.html suggesting c-Myc bound to nonconsensus DNA sites or to non-DNA components of the chromatin associated with the Pklr gene, common characteristics of c-Myc according to recent genome-wide screens of c-Myc-binding sites (32,33).
Figure 5.
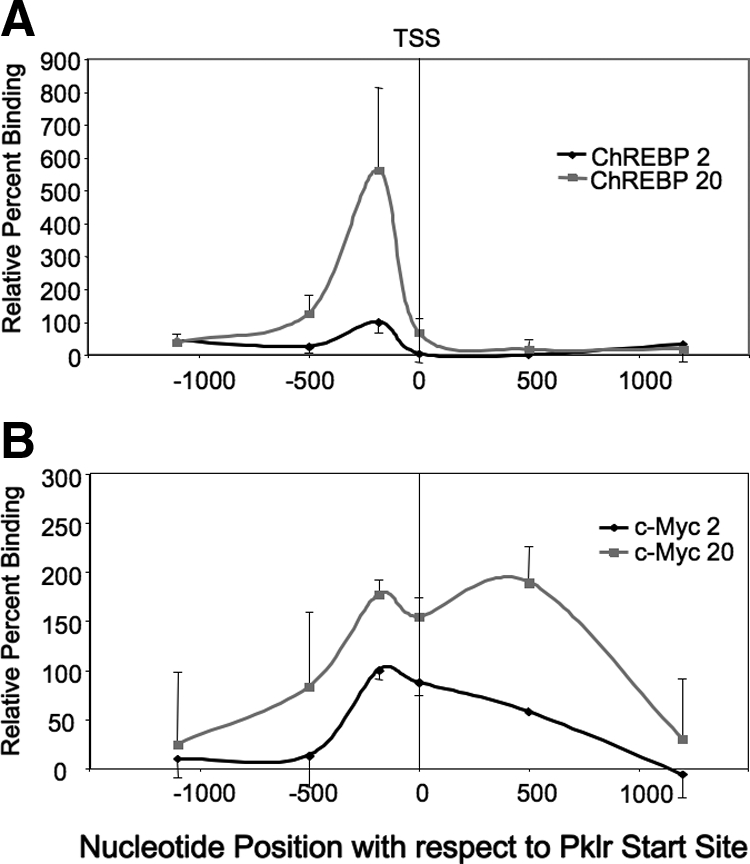
c-Myc and ChREBP are recruited to different locations of the Pklr gene in response to glucose. The 832/13 cells were cultured in 2 mm glucose for 16 h and then were treated with 2 or 20 mm glucose for 6 h, as in Fig. 2. The cells were fixed with formaldehyde, and chromatin was prepared for ChIP assays using an antibody directed against ChREBP (A), c-Myc (B), or normal rabbit IgG. Note that the immunoprecipitations in panels A and B were performed with the same chromatin input. The DNA was purified and used as template in PCRs using primer pairs specific for various regions of the Pklr gene. The results shown are the average of the means from four experiments ± se, wherein the IgG values were subtracted as background. The relative percent binding was normalized (100%) to the signal at 2 mm glucose at the ChoRE (centered at ∼ −157 bp) and presented as a function of the position relative to the transcription start site (TSS) in base pairs.
1RH specifically interferes with c-Myc/Max interaction and blocks the glucose response, but not basal expression, of Pklr
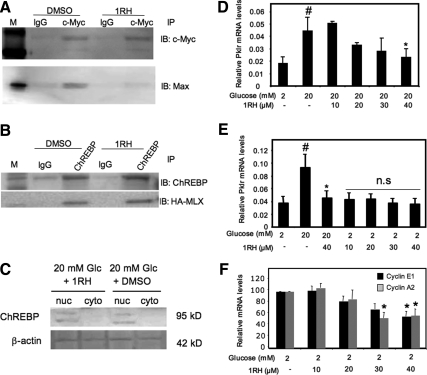
A small molecule inhibitor of c-Myc, 1RH (10058-F4), was used to interrupt the binding of c-Myc with its partner, Max, to determine how diminishing c-Myc activity affected the glucose response of the Pklr gene (21,22). Figure 6A shows a coimmunoprecipitation experiment wherein 40 μm 1RH blocked the interaction between c-Myc and Max in INS-1-derived 832/13 cells. Because ChREBP and Mlx are in the same superfamily of basic helix loop helix leucine zipper transcription factors (8), it was critical to demonstrate that any effect of 1RH was not due to interference with ChREBP/Mlx interaction. Because it was difficult to detect Mlx in 832/13 cells with antibodies available at the time, human embryonic kidney 293 cells were transfected with plasmids bearing cDNAs expressing ChREBP and hemagglutinin (HA)-tagged Mlx. Coimmunoprecipitation of ChREBP and Mlx was unaffected by 1RH (Fig. 6B). Thus, 1RH blocked the interaction of c-Myc with its binding partner Max but did not affect ChREBP/Mlx dimerization. As a control, Western blots were performed to determine whether 1RH had any affect on the cellular localization or abundance of ChREBP in 832/13 cells. After a 16-h treatment with 20 mm glucose, ChREBP was entirely nuclear in agreement with previous results (34), and its abundance was unaltered in the presence of 40 μm 1RH (Fig. 6C). Having determined that 1RH affects c-Myc/Max interaction without affecting ChREBP/Mlx, we next determined the effect of 1RH on the Pklr glucose response. Treatment with 1RH blunted the glucose-mediated increase in Pklr mRNA in a dose-dependent manner but had no effect on basal gene expression (Fig. 6, D and E). These results are consistent with previous results demonstrating the necessity of c-Myc activity for the glucose response of the Pklr gene (10,20). By contrast, treatment with 1RH diminished the basal expression of the classic c-Myc target genes, cyclin A2 and cyclin E1, which contain E-boxes but no known ChoREs (35) (Fig. 6F).
Figure 6.
Small molecule inhibitor of c-Myc, 1RH, blocks glucose-mediated induction of the Pklr gene without altering basal expression. A, INS-1-derived 832/13 cells were treated with 2 mm glucose for 16 h followed by 6 h with a vehicle control (DMSO) or 40 μm 1RH in 20 mm glucose. Nuclear lysates were used for coimmunoprecipitation using an antibody directed against c-Myc. Western blots were performed using antibodies against c-Myc or Max. The results are representative of three independent experiments. B, Human embryonic kidney 293 cells were transfected with plasmids expressing ChREBP or HA-Mlx. The cells were treated 24 h later with 40 μm 1RH for 16 h, and nuclear lysates were used for coimmunoprecipitation using an antibody directed against ChREBP, and immunoblots were performed using antibodies against ChREBP or the HA epitope. The results are representative of two independent experiments. C, Western blot of ChREBP from nuclear or cytoplasmic extracts of 832/13 cells treated with 20 mm glucose and either vehicle (DMSO) or 40 μm 1RH for 16 h. The result is representative of two experiments. D–F, INS-1-derived 832/13 cells were treated for 16 h with the indicated concentrations of 1RH and either 2 or 20 mm glucose. Total RNA was isolated, and RT-PCR was performed using primers specific for the indicated genes or β-actin. Results are expressed as the means ± se, after normalization to β-actin (n = 3; #, P < 0.05 for 2 mm glucose vs. 20 mm glucose; *, P < 0.05 for 20 mm glucose vehicle vs. 20 mm glucose 1RH). IB, Immunoblotting; IP, immunoprecipitation.
1RH blocks the glucose-mediated recruitment of activating transcription factors to the Pklr promoter
Having shown that 1RH inhibits the glucose response of Pklr, we determined the effects of 1RH treatment on the dynamic interactions of transcription factors associated with the Pklr gene after glucose treatment using the ChIP assay. As shown in Fig. 7, A–C, treatment with 1RH neither had any effect on HNF1α binding, nor did it have any effect on the acetylated status of histones H3 and H4. These results were consistent with the observation that 1RH had no affect on basal expression of the Pklr gene (Fig. 6D). By contrast, 1RH prevented the recruitment of the factors that correlated with the glucose-mediated activation of Pklr (Fig. 7, D–F). Thus, 1RH treatment blocked the glucose-mediated recruitment of HNF4α, ChREBP, and RNA Pol II. To confirm these results, siRNA was used to decrease c-Myc, which resulted in a significant decrease in the glucose response of Pklr and inhibited the glucose-mediated recruitment of ChREBP to the ChoRE region of the Pklr gene (Fig. 8). We conclude that c-Myc is required for the glucose-mediated recruitment of ChREBP, HNF4α, and RNA Pol II.
Figure 8.
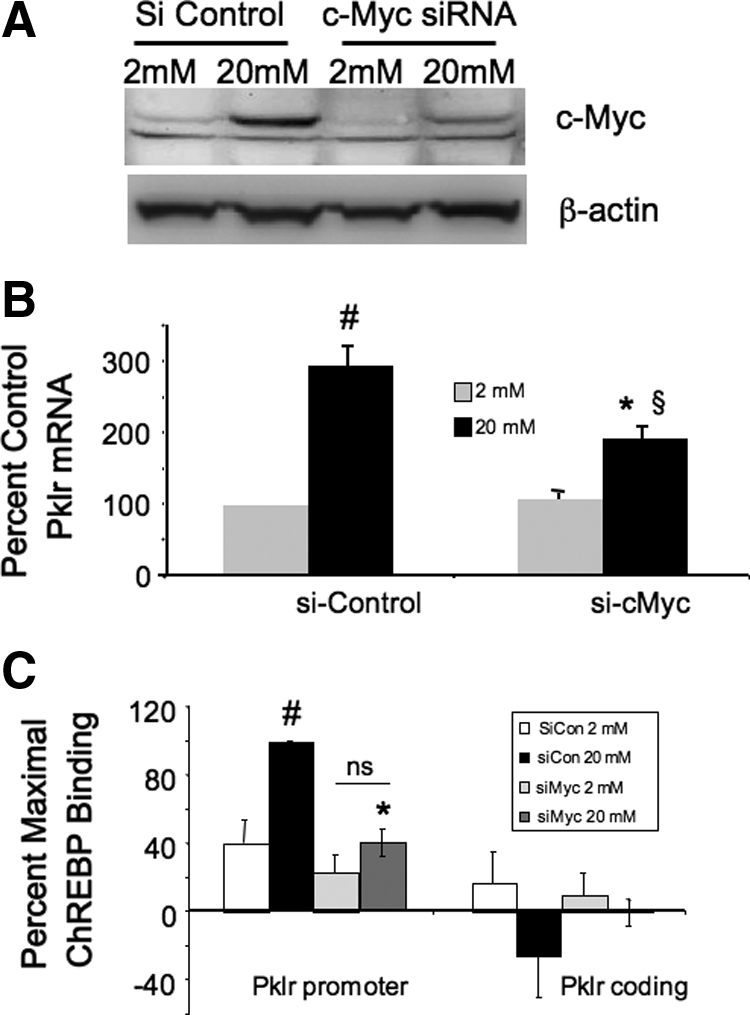
siRNA directed against c-Myc blocks the glucose-mediated recruitment of ChREBP to the Pklr gene. INS-1-derived 832/13 cells were transfected with siRNA specific for c-Myc or a control siRNA and were cultured for 48 h. Cells were then treated for 16 h with either 2 or 20 mm glucose as in Fig. 2. A, Nuclear extracts were subjected to immunoblotting with an antibody directed against c-Myc or β-actin. The result is representative of two independent experiments. B, Total RNA was isolated and subjected to RT-PCR using primers specific for Pklr and β-actin. C, Alternatively, cells were fixed with formaldehyde, chromatin was isolated and sheared, and protein-DNA complexes were immunoprecipitated with antibodies directed against ChREBP; the DNA was purified and amplified by PCR using the indicated primer pairs. The results from panels B and C are expressed as the mean of four experiments, ± se. #, P < 0.05 for 2 mm glucose vs. 20 mm glucose; *, P < 0.05 for 20 mm glucose siRNA control vs. 20 mm glucose and siRNA specific for c-Myc; §, P < 0.05 for 2 mm glucose c-Myc siRNA vs. 20 mm glucose c-Myc siRNA; ns, not significant. Si Control, Small interfering control; si-c Myc, small interfering Myc.
c-Myc is required for the glucose response and the recruitment of ChREBP to the gene promoters of several glucose-responsive genes
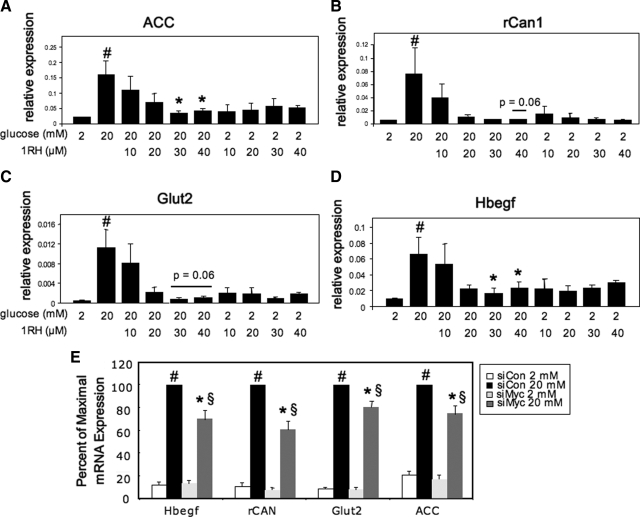
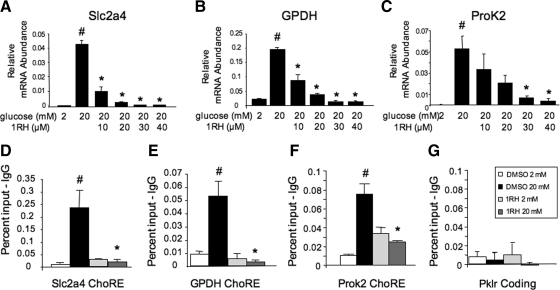
We tested whether the effects of diminishing c-Myc activity were restricted to the Pklr gene, or whether the necessity for c-Myc is a general requirement for glucose responsiveness. As shown in Fig. 9, 1RH treatment decreased the glucose response of the following glucose-responsive genes in a dose-dependent manner: acetyl coenzyme A carboxylase, heparin-binding epidermal growth factor-like (Hbegf), regulator of calcineurin 1 (rCan1), and glucose transporter 2 (slc2a2), although the latter two did not quite reach statistical significance (P = 0.06). In addition, the basal expression of these genes was not affected by 1RH. As a further control, siRNA directed against c-Myc also significantly diminished the glucose response of the same genes, although to a lesser degree than by 1RH (Fig. 9E). In addition, to test whether the requirement for c-Myc was based on the ability to recruit ChREBP to glucose-responsive genes, several genes with well-characterized ChoREs (Ref. 36 and our unpublished data) were chosen to determine whether 1RH blocked ChREBP recruitment using the ChIP assay. As shown in Fig. 10, glucose transporter 4 (Slc2a4), glycerol 3 phosphate dehydrogenase, and prokineticin 2 (ProK2), all had glucose responses that were blocked by treatment with 1RH, indicating that c-Myc is required for these responses. In addition, glucose-mediated recruitment of ChREBP to the respective ChoREs of the same genes was blocked by 1RH, as determined by the ChIP assay. Further, 1RH blocked the glucose response of Pklr in primary isolated pancreatic islets, demonstrating that the requirement for c-Myc is not restricted to cell lines (Fig. 11). Together, these observations support the hypothesis that c-Myc is generally required for ChREBP-dependent glucose responsiveness.
Figure 9.
c-Myc is required for the glucose response of several glucose-responsive genes. A–D, INS-1-derived 832/13 cells were treated for 16 h with various concentrations of 1RH in 2 or 20 mm glucose. Total RNA was isolated and subjected to RT-PCR using primers specific for acetyl-coenzyme A carboxylase (ACC) (A), rCan1 (B), Glut2 (C), or Hbegf (D). E, Cells were transfected with siRNA specific for c-Myc or a control siRNA and were cultured for 48 h. Cells were then treated for 16 h with either 2 or 20 mm glucose, and total RNA was subjected to RT-PCR using primers specific for the indicated genes. Results are the means of three to five independent experiments ± se; #, P < 0.05 for 2 mm glucose vs. 20 mm glucose; *, P < 0.05 for 20 mm glucose vehicle control vs. 20 mm glucose and 1RH, or for 20 mm glucose siRNA control vs. 20 mm glucose and siRNA directed against c-Myc; §, P ≤ 0.001 for 2 mm glucose c-Myc siRNA vs. 20 mm glucose c-Myc siRNA. siCon, Small interfering control; siMyc, small interfering Myc.
Figure 10.
c-Myc is required for the glucose-mediated recruitment of ChREBP to ChoREs. INS-1-derived 832/13 cells were treated for 16 h with a vehicle control (DMSO) or the indicated concentrations of 1RH in either 2 or 20 mm glucose as in Fig. 2. Total RNA was isolated and subjected to RT-PCR using primers specific for Slc2a4 (A), glycerol 3 phosphate dehydrogenase (GPDH) (B), Prok2 (C), and β-actin. Results are the mean ± se (n = 3). D–G, Cells were pretreated for 16 h with 40 μm 1RH or vehicle control and then treated for 6 h with either 2 or 20 mm glucose as in Fig. 2. A ChIP assay was performed with antibodies directed against ChREBP or an IgG control. PCR was performed using primers specific for the regions flanking the ChoREs of the indicated genes. The results are expressed as the mean of three independent experiments ± se. #, P < 0.05 for 2 mm glucose vs. 20 mm glucose; *, P < 0.05 for 20 mm glucose vehicle control vs. 20 mm glucose and 1RH.
Figure 11.
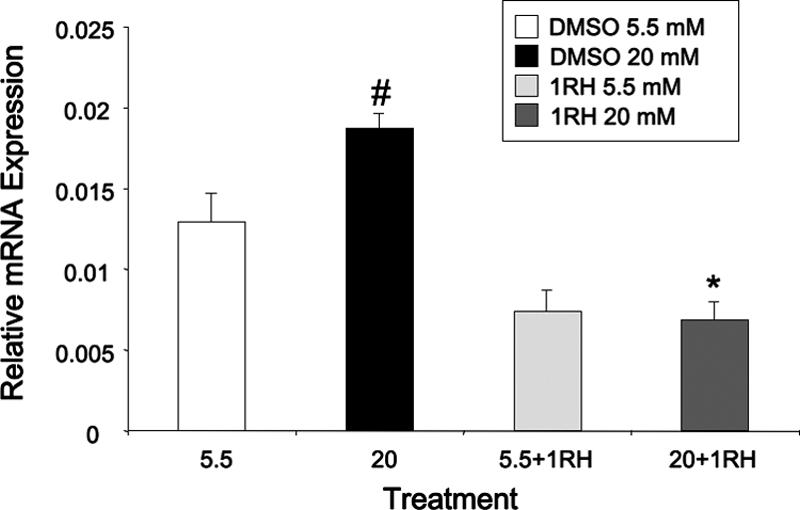
c-Myc is required for the glucose-mediated expression of Pklr in isolated rat pancreatic islets. Primary rat islets were harvested and cultured for 24 h. Rat islets were pretreated for 2 h with 1RH (40 μm) or DMSO in RPMI media and then induced with high glucose (20 mm) for 6 h. RNA was isolated, and quantitative RT-PCR analysis was performed using primers specific for rat Pklr mRNA. Data are normalized to β-actin and are expressed as means ± se for three independent experiments. #, P < 0.05 for 2 mm glucose vs. 20 mm glucose; *, P < 0.05 for 20 mm glucose vehicle control vs. 20 mm glucose and 1RH.
Discussion
Until very recently, transcriptional regulation was thought to be primarily at the level of the recruitment and assembly of the preinitiation complex (37,38). By this view, transcription of a target gene is dependent on the arrival of RNA Pol II, which occurs only after the assembly of sequence-specific transcription factors, coactivators, general transcription factors, and bridging molecules such as mediator (39). In the last few years whole-genome ChIP-on-chip and ChIP-seq studies have demonstrated that RNA Pol II is often located on quiescent or lightly transcribing genes, having bound and escaped the promoter only to pause 40 or 50 bp downstream from the transcription start site (37,38,40,41,42). Genes with paused RNA Pol II are often involved in development or respond to environmental stimuli such as changes in nutritional availability. This arrangement allows a very rapid response to stimuli by release of negative regulators of transcriptional elongation (40,43). Here we have described the molecular events surrounding the transcriptional control of the Pklr gene that fits this profile, with a clear delineation between basal and glucose-simulated expression. Pklr is transcribed at a slow, basal rate, accompanied by constitutive occupation by the tissue-specific transcription factors HNF1α and HNF4α (Fig. 2 and Refs. 14,15,16 and 23). A consequence of this occupation is the acetylation of histones H3 and H4 under basal (low glucose) conditions (Fig. 2 and Refs. 10 and 20). Further, under basal conditions we found that RNA Pol II was present near the promoter at very high levels compared with the coding region or to a nontranscribed gene (Fig. 3 and Refs. 29 and 30). This is consistent with paused RNA Pol II, further supported by the presence of abundant serine 5 phosphorylation of the C-terminal domain of RNA Pol II under basal conditions near the transcription start site, but not downstream in the coding region of the gene (29,30).
Glucose promoted the recruitment of a second tier of transcription factors to the Pklr gene that ultimately led to the procession of RNA Pol II through the gene and increased rates of transcription. This is accompanied by increased serine 2 phosphorylation of the C-terminal domain of RNA Pol II associated with the coding region of the gene (29,30). ChREBP was recruited to the carbohydrate response element with biphasic peaks at 15 min and 6 h that were reflected in a similarly patterned increase in the rate of transcription as measured by nuclear run-on assay (Figs. 3 and 4). c-Myc was also recruited to the Pklr gene by glucose, but over a much broader region of the gene, spanning from −155 to +500 bp with respect to the transcription start site (Figs. 3 and 5, and see below). HNF4α and RNA Pol II, which were already present at significant amounts in 2 mm glucose, displayed increased occupation of the promoter with 20 mm glucose, with the additional recruitment mirroring the biphasic nature of the transcriptional activation by glucose (Figs. 2–4). Further, RNA Pol II was observed in the coding region of the gene after glucose treatment, reflecting procession, also biphasic, of the Pol through the gene (Fig. 3D). The biphasic pattern of recruitment and transcription is reminiscent of the pS2 gene regulated by ligand-activated estrogen receptor (44). In this case, α-amanatin was used to synchronize the loading of RNA Pol II in response to estrogen. Time course ChIP experiments revealed an oscillatory pattern of loading and unloading of the activating factors, coactivators, and polymerase in response to the stimulus (44). This arrangement may allow for a continual evaluation of the presence or absence of the stimulatory signal and is thus a mechanism to shut down transcription once the signal dissipates. Oscillations of transcription factor recruitment have been observed in many systems, and a new computational model predicts that oscillations are a consequence of the stochastic availability of necessary factors coupled with the ordered sequential events required for regulated transcription and is thus a very general phenomenon (45,46).
The speed of recruitment of ChREBP and the other factors involved in the activation of Pklr by glucose deserves comment. The initial model of ChREBP activation by glucose assumed that nuclear transport is a prerequisite for transcriptional activation (47). Indeed, most ChREBP is found in the cytoplasm in low glucose and, by 12 h after high-glucose treatment, becomes almost entirely nuclear (34). Recently Towle and associates (11) demonstrated that ChREBP shuttles actively from the nucleus to the cytoplasm, and that glucose increases the rate of nuclear entry. A consequence of this is that there is always some ChREBP in the nucleus available for rapid recruitment to glucose-responsive genes, and the recruitment of ChREBP within a few minutes of exposure to glucose is consistent with this (Fig. 3). To determine whether the factors recruited by glucose were temporally ordered, data from the time course ChIP assays of the different factors, as well as nuclear run-on data, were carefully aligned (Supplemental Fig. 1). Within the resolution of the assay, all the factors appear to arrive simultaneously on the promoter, coincident with the increased rate of transcription.
We have now seen that c-Myc is required for ChREBP-dependent glucose-stimulated transcription in several systems using several different approaches. Antisense c-Myc and dominant-negative Max block the glucose response of Pklr in glucokinase-expressing HL1C hepatoma cells and in primary hepatocytes (20). Further, antisense c-Myc, and overexpression of the c-Myc antagonist, Mad, block the glucose response in INS-1-derived 832/13 cells (10); and here we show the small molecule inhibitor, 1RH, blocked the glucose response in these cells and in isolated rat islets (Figs. 6 and 11). That c-Myc is required for the glucose response should not be surprising. c-Myc, as an overexpressed oncogene in cancer cells, increases glycolytic gene expression contributing to the Warburg effect, and several glycolytic enzyme genes are direct targets of c-Myc (18). A modest overexpression of c-Myc protects transgenic mice from streptozocin-induced diabetes and from diet-induced diabetes (19,48), with an apparent switch in transcription factor expression and activity consistent with a fed phenotype, even in the absence of insulin (49,50).
The specific molecular function of c-Myc, both in normal cells and in transformed cells, and the mechanism by which it acts, have been somewhat of an enigma, although recent evidence has provided some clarification. First, c-Myc does not always work as a classical cis-trans transcription factor (32,51). A recent genome-wide ChIP-on-chip scan found that at least half of all c-Myc-binding sites are not high-affinity consensus E-box sequences, and that chromatin context was critical for c-Myc binding (33). Further, Cowling and Cole (52) showed that mutation of the DNA-binding domain of c-Myc did not prevent all the transforming activities of c-Myc. They found that c-Myc was required for transcription factor II H activity and was responsible for the phosphorylation of the C-terminal domain of RNA Pol II and for 5' cap formation of the nascent mRNA. Further, c-Myc may recognize chromatin through histone epigenetic marks, such as trimethylation of lysine 4 on histone 3 (53). We found that c-Myc bound to a broad region along the Pklr gene, and most of the glucose-stimulated binding occurred downstream of the transcription start site of the gene (Fig. 5B). In addition, no consensus binding sites for c-Myc exist in the Pklr gene, making it likely that c-Myc is acting not as a classical transcription factor in this context. Further, the classic c-Myc target genes, cyclin A2 and cyclin E1 (35), displayed diminished basal gene expression with 1RH treatment, in contrast to ChREBP-dependent glucose-responsive genes the dependence of which on c-Myc was at the level of glucose stimulation rather than basal expression. We note that pretreatment with 1RH was required for the most efficient inhibition of the glucose response, suggesting preexisting c-Myc was required for glucose competency.
How does c-Myc regulate glucose-stimulated gene expression? c-Myc was required for the recruitment of ChREBP, HNF4α, and RNA Pol II, which may arrive on the Pklr gene promoter, along with the coactivator, cAMP response element-binding protein-binding protein (CBP), as a preassembled complex (9). Thus, c-Myc may prepare the chromatin so that ChREBP and other functional members of the transcriptional activation complex are able to interact. That c-Myc is required for the recruitment of ChREBP to numerous carbohydrate response elements suggests that it plays an important general role in glucose-regulated gene expression and glucose homeostasis. A future challenge will be to determine how c-Myc, in the specific physiological context of increased glucose metabolism, provides competency to glucose-responsive genes.
Materials and Methods
Cell culture
The 832/13 rat insulinoma cell line, which was isolated from the original INS-1 insulinoma, was cultured as previously described (54,55). Human embryonic kidney 293 cells were cultured in DMEM and 10% FBS. 1RH (10058-F4) was purchased from Calbiochem (La Jolla, CA; catalog no. 475956). 832/13 cells were transfected with siRNA [c-Myc siRNA (catalog no. 189043) or negative control (catalog no. AM4611)] from Applied Biosystems (Foster City, CA). Details were described previously (10).
Quantitative RT-PCR
Total RNA was isolated from 832/13 cells and primary hepatocytes using TRI Reagent (Molecular Research Center, Cincinnati, OH) according to the manufacturer's instructions. Quantities of mRNA were assayed by real-time quantitative RT-PCR on an ABI Prism 7300 Sequence Detection System (Applied Biosystems). The conditions for the reverse transcriptase reaction and PCR have been described (10,39). Of the total reverse transcriptase reaction volume 2.5% was used as input for PCR using SYBR green master mix (Applied Biosystems) or Bio-Rad's iTaq SYBR green supermix with carboxy-X-rhodamine (Bio-Rad Laboratories, Hercules, CA). The primers used are listed in Supplemental Table 1. The relative abundance of mRNA was determined by comparative cycle threshold analysis according to Applied Biosystems (User Bulletin 2).
ChIP
ChIP assays were performed as previously described (9,10,29,55) by following a slight modification of the Upstate Biotechnology, Inc. (Lake Placid, NY)/Millipore Corp. (Milford, MA) ChIP assay kit protocol (catalog no. 17-295). Cells were treated for 16 h in 2 mm glucose before treatment with 20 mm glucose, wherein 18 mm glucose was added to reach 20 mm. We found this careful approach was necessary to differentiate glucose effects from effects of media replacement on the Pklr gene promoter at early time points. The chromatin was sonicated using a Diagenode Bioruptor (Liege, Belgium) for 15 min, resulting in reproducible fragments ranging in size from 250–900 bp (Supplemental Fig. 2). The antibodies used in ChIP experiments were as follows: ChREBP (Novus Biologicals, Littleton, CO; catalog no. NB 400-135); c-Myc [c-Myc (N-262): Santa Cruz Biotechnology, Inc. (Santa Cruz, CA) catalog no. sc-764]; HNF1α [HNF1α:(H-205): Santa Cruz Biotechnology, catalog no. sc-8986]; HNF4α [HNF4α:(H-171) Santa Cruz Biotechnology, catalog no. sc-8987]; acetylated histone H3 (Millipore Corp.; catalog no. 06-599); acetylated histone H4 (Millipore; catalog no. 06-866); RNA Pol II (Millipore; catalog no. 05-623). The sequences of the primers used are shown in Supplemental Table 2.
Nuclear run-on assay
A nuclear run-on assay was developed as a modification of a method reported previously (56). Confluent 832/13 cells were incubated for 6 h in 2 or 20 mm glucose. Cells were washed with cold PBS and 5 ml lysis buffer (10 mm Tris-HCl, pH 7.4; 3 mm MgCl2; 10 mm NaCl; and 0.5% Nonidet P-40) was added, and the mixture was incubated 5 min at room temperature. After centrifugation for 5 min at 4 C at 270 × g, the supernatant was taken for mRNA analysis, and the nuclear pellet was washed once with lysis buffer without Nonidet P-40 and resuspended in freezing buffer (50 mm Tris-HCl, pH 8.3; 40% glycerol; 5 mm MgCl2; and 0.1 mm EDTA) at −80 C until use. One volume of 2× transcription buffer (200 mm KCl, 20 mm Tris-HCl, pH 8.0; 5 mm MgCl2; 4 mm dithiothreitol; 4 mm each of rATP, rGTP, and rCTP, in a final concentration of 20% glycerol) was added to the nuclei in ice along with 8 μl biotin-16-UTP (Roche, Indianapolis, IN) per 50 μl of nuclei. The mixture was incubated for 30 min at 29 C. In vitro RNA synthesis was stopped by adding 6 μl 250 mm CaCl2, 6 μl ribonuclease-free deoxyribonuclease I (10 U/μl, Roche) and incubated for 20 min at 29 C. RNA was extracted with TRI Reagent (Molecular Research Center) and resuspended in 50 μl H2O. Dynabeads (M-280 streptavidin; Invitrogen, Carlsbad, CA) were washed twice in solution A (0.1 mm NaOH, 0.5 m NaCl) for 5 min and once in solution B (0.1 m NaCl) for 5 min and then were resuspended in binding/wash buffer [10 mm Tris-HCl, pH 7.5; 1 mm EDTA; and 2 m NaCl plus 1 μl (40 U) RNAsin per 100 μl of beads]. Prepared Dynabeads (50 μl) were added to the RNA preparation, and the mixture was incubated for 20 min at 42 C, followed by gentle shaking at room temperature for 2 h. The beads were washed once with 15% formamide and 2× saline-sodium citrate buffer for 15 min, twice with 2× saline-sodium citrate buffer for 5 min and then were resuspended in 30 μl H2O. Beads (5 μl) were added directly to the RT reaction described above. Quantitative PCR was performed using a SYBR green master mix (Bio-Rad) in an Applied Biosystems Prism 7300 Real-Time PCR System as previously described (9,30). The sequence of the oligonucleotides used, which spanned intron and exon boundaries of the Pklr and β-actin genes are shown in Supplemental Table 3.
Coimmunoprecipitation
After 832/13 cells were cultured with 2 mm glucose for 16 h, cells were treated with 20 mm glucose and 40 μm 1RH or dimethylsulfoxide (DMSO) for 6 h. Nuclear lysate was extracted using Nuclear extract kit (Pierce Chemical Co., Rockford, IL; NE-PER Nuclear and Cytoplasmic Extraction Reagents; catalog no. 78833). Nuclear extract (500 μg) was immunoprecipitated with c-Myc antibody (Cell Signaling Technology, Danvers, MA; catalog no. 9402). Western blotting was performed using anti-Max (Santa Cruz; catalog no. sc-765) or anti-c-Myc antibody. The second antibody for the c-Myc coimmunoprecipitation was a light chain-specific peroxidase-conjugated IgG fraction monoclonal mouse antirabbit IgG from Jackson ImmunoResearch Laboratories, Inc. (West Grove, PA; catalog no. 211-032-171). For the coimmunoprecipitation of ChREBP and Mlx, human embryonic kidney 293 cells were transfected with plasmids expressing ChREBP and HA-tagged Mlx. After 48 h, 40 μmol of 1RH were added in the culture medium, and cells were incubated for another 16 h. The cells were harvested and the nuclear lysates were extracted. Immunoprecipitation was performed overnight using anti-ChREBP antibody, after which anti-HA antibody was used to detect HA-Mlx signal for Western blotting.
Isolation of rat islets
Animal studies were performed in compliance with and with approval of the University of Pittsburgh Institutional Care and Use Committee; all animal experimentation described was conducted in accord with accepted standards of humane animal care, as outlined in the Ethical Guidelines. Islets were isolated from 8- to 10-wk-old Wistar rats (Charles River Laboratories, Wilmington, MA) as previously described (57). Isolated rat islets were cultured in RPMI medium supplemented with 10% fetal calf serum, 5.5 mmol/liter glucose, and penicillin-streptomycin for 24 h before 1RH treatment. Islets were preincubated with 1RH (40 μm) or an equal volume of DMSO (vehicle control) in RPMI medium for 2 h at 37 C. Then, glucose (20 mm) was added for an additional 6 h, and total RNA was isolated using the RNeasy microkit from QIAGEN (Chatsworth, CA) following manufacturer's guidelines.
Statistical analyses
A two-tailed Students t test was used to test for statistical significance, assumed at P < 0.05. Alternatively, for experiments with multiple comparisons, a one-way ANOVA was performed to detect significant differences (assumed at P < 0.05). A Tukey's post hoc test was used to determine statistical differences within the ANOVA. All data were reported as means ± se.
Supplementary Material
Acknowledgments
We thank Dr. George Harb and Dr. Andrew Stewart of the University of Pittsburgh School of Medicine for help learning to isolate primary rat islets.
Footnotes
This work was supported by National Institute of Diabetes and Digestive and Kidney Diseases Grant DK-065149 (to D.K.S.).
Disclosure Summary: The authors have nothing to disclose.
First Published Online April 9, 2010
Abbreviations: ChIP, Chromatin immunoprecipitation; ChoRE, carbohydrate response element; ChREBP, carbohydrate response element-binding protein; DMSO, dimethylsulfoxide; HA, hemagglutinin; HNF, hepatocyte nuclear factor; Pol II, polymerase II.
References
- Towle HC 2005 Glucose as a regulator of eukaryotic gene transcription. Trends Endocrinol Metab 16:489–494 [DOI] [PubMed] [Google Scholar]
- Postic C, Dentin R, Denechaud PD, Girard J 2007 ChREBP, a transcriptional regulator of glucose and lipid metabolism. Annu Rev Nutr 27:179–192 [DOI] [PubMed] [Google Scholar]
- Wang H, Wollheim CB 2002 ChREBP rather than USF2 regulates glucose stimulation of endogenous l-pyruvate kinase expression in insulin-secreting cells. J Biol Chem 277:32746–32752 [DOI] [PubMed] [Google Scholar]
- Yamashita H, Takenoshita M, Sakurai M, Bruick RK, Henzel WJ, Shillinglaw W, Arnot D, Uyeda K 2001 A glucose-responsive transcription factor that regulates carbohydrate metabolism in the liver. Proc Natl Acad Sci USA 98:9116–9121 [DOI] [PMC free article] [PubMed] [Google Scholar]
- Koo SH, Dutcher AK, Towle HC 2001 Glucose and insulin function through two distinct transcription factors to stimulate expression of lipogenic enzyme genes in liver. J Biol Chem 276:9437–9445 [DOI] [PubMed] [Google Scholar]
- Marie S, Diaz-Guerra MJ, Miquerol L, Kahn A, Iynedjian PB 1993 The pyruvate kinase gene as a model for studies of glucose-dependent regulation of gene expression in the endocrine pancreatic β-cell type. J Biol Chem 268:23881–23890 [PubMed] [Google Scholar]
- Yamada K, Noguchi T 1999 Nutrient and hormonal regulation of pyruvate kinase gene expression. Biochem J 337:1–11 [PMC free article] [PubMed] [Google Scholar]
- Cairo S, Merla G, Urbinati F, Ballabio A, Reymond A 2001 WBSCR14, a gene mapping to the Williams-Beuren syndrome deleted region, is a new member of the Mlx transcription factor network. Hum Mol Genet 10:617–627 [DOI] [PubMed] [Google Scholar]
- Burke SJ, Collier JJ, Scott DK 2009 cAMP opposes the glucose-mediated induction of the L-PK gene by preventing the recruitment of a complex containing ChREBP, HNF4α, and CBP. FASEB J 23:2855–2865 [DOI] [PubMed] [Google Scholar]
- Collier JJ, Zhang P, Pedersen KB, Burke SJ, Haycock JW, Scott DK 2007 c-Myc and ChREBP regulate glucose-mediated expression of the L-type pyruvate kinase gene in INS-1-derived 832/13 cells. Am J Physiol Endocrinol Metab 293:E48–E56 [DOI] [PubMed] [Google Scholar]
- Davies MN, O'Callaghan BL, Towle HC 2008 Glucose activates ChREBP by increasing its rate of nuclear entry and relieving repression of its transcriptional activity. J Biol Chem 283:24029–24038 [DOI] [PMC free article] [PubMed] [Google Scholar]
- Li MV, Chang B, Imamura M, Poungvarin N, Chan L 2006 Glucose-dependent transcriptional regulation by an evolutionarily conserved glucose-sensing module. Diabetes 55:1179–1189 [DOI] [PubMed] [Google Scholar]
- Tsatsos NG, Towle HC 2006 Glucose activation of ChREBP in hepatocytes occurs via a two-step mechanism. Biochem Biophys Res Commun 340:449–456 [DOI] [PubMed] [Google Scholar]
- Yamagata K, Oda N, Kaisaki PJ, Menzel S, Furuta H, Vaxillaire M, Southam L, Cox RD, Lathrop GM, Boriraj VV, Chen X, Cox NJ, Oda Y, Yano H, Le Beau MM, Yamada S, Nishigori H, Takeda J, Fajans SS, Hattersley AT, Iwasaki N, Hansen T, Pedersen O, Polonsky KS, Turner RC, Velho G, Chevre J-C, Froguel P, Bell GI 1996 Mutations in the hepatocyte nuclear factor-1α gene in maturity-onset diabetes of the young (MODY3). Nature 384:455–458 [DOI] [PubMed] [Google Scholar]
- Liu Z, Towle HC 1995 Functional synergism in the carbohydrate-induced activation of liver-type pyruvate kinase gene expression. Biochem J 308:105–111 [DOI] [PMC free article] [PubMed] [Google Scholar]
- Liu Z, Thompson KS, Towle HC 1993 Carbohydrate regulation of the rat L-type pyruvate kinase gene requires two nuclear factors: LF-A1 and a member of the c-myc family. J Biol Chem 268:12787–12795 [PubMed] [Google Scholar]
- Meyer N, Penn LZ 2008 Reflecting on 25 years with MYC. Nat Rev Cancer 8:976–990 [DOI] [PubMed] [Google Scholar]
- Kim JW, Dang CV 2006 Cancer's molecular sweet tooth and the Warburg effect. Cancer Res 66:8927–8930 [DOI] [PubMed] [Google Scholar]
- Riu E, Bosch F, Valera A 1996 Prevention of diabetic alterations in transgenic mice overexpressing Myc in the liver. Proc Natl Acad Sci USA 93:2198–2202 [DOI] [PMC free article] [PubMed] [Google Scholar]
- Collier JJ, Doan TT, Daniels MC, Schurr JR, Kolls JK, Scott DK 2003 c-Myc is required for the glucose-mediated induction of metabolic enzyme genes. J Biol Chem 278:6588–6595 [DOI] [PubMed] [Google Scholar]
- Hammoudeh DI, Follis AV, Prochownik EV, Metallo SJ 2009 Multiple independent binding sites for small-molecule inhibitors on the oncoprotein c-Myc. J Am Chem Soc 131:7390–7401 [DOI] [PubMed] [Google Scholar]
- Wang H, Hammoudeh DI, Follis AV, Reese BE, Lazo JS, Metallo SJ, Prochownik EV 2007 Improved low molecular weight Myc-Max inhibitors. Mol Cancer Ther 6:2399–2408 [DOI] [PubMed] [Google Scholar]
- Wang H, Antinozzi PA, Hagenfeldt KA, Maechler P, Wollheim CB 2000 Molecular targets of a human HNF1α mutation responsible for pancreatic β-cell dysfunction. EMBO J 19:4257–4264 [DOI] [PMC free article] [PubMed] [Google Scholar]
- Yamagata K, Yang Q, Yamamoto K, Iwahashi H, Miyagawa J, Okita K, Yoshiuchi I, Miyazaki J, Noguchi T, Nakajima H, Namba M, Hanafusa T, Matsuzawa Y 1998 Mutation P291fsinsC in the transcription factor hepatocyte nuclear factor-1α is dominant negative. Diabetes 47:1231–1235 [DOI] [PubMed] [Google Scholar]
- Satoh S, Noaki T, Ishigure T, Osada S, Imagawa M, Miura N, Yamada K, Noguchi T 2005 Nuclear factor 1 family members interact with hepatocyte nuclear factor 1α to synergistically activate L-type pyruvate kinase gene transcription. J Biol Chem 280:39827–39834 [DOI] [PubMed] [Google Scholar]
- Shahbazian MD, Grunstein M 2007 Functions of site-specific histone acetylation and deacetylation. Annu Rev Biochem 76:75–100 [DOI] [PubMed] [Google Scholar]
- Barrero MJ, Malik S 2006 Two functional modes of a nuclear receptor-recruited arginine methyltransferase in transcriptional activation. Mol Cell 24:233–243 [DOI] [PMC free article] [PubMed] [Google Scholar]
- Soutoglou E, Papafotiou G, Katrakili N, Talianidis I 2000 Transcriptional activation by hepatocyte nuclear factor-1 requires synergism between multiple coactivator proteins. J Biol Chem 275:12515–12520 [DOI] [PubMed] [Google Scholar]
- Burke SJ, Collier JJ, Scott DK 2009 cAMP prevents glucose-mediated modifications of histone H3 and recruitment of the RNA polymerase II holoenzyme to the L-PK gene promoter. J Mol Biol 392:578–588 [DOI] [PMC free article] [PubMed] [Google Scholar]
- Eckert DT, Zhang P, Collier JJ, O'Doherty RM, Scott DK 2008 Detailed molecular analysis of the induction of the L-PK gene by glucose. Biochem Biophys Res Commun 372:131–136 [DOI] [PMC free article] [PubMed] [Google Scholar]
- Blackwell TK, Huang J, Ma A, Kretzner L, Alt FW, Eisenman RN, Weintraub H 1993 Binding of myc proteins to canonical and noncanonical DNA sequences. Mol Cell Biol 13:5216–5224 [DOI] [PMC free article] [PubMed] [Google Scholar]
- Cotterman R, Jin VX, Krig SR, Lemen JM, Wey A, Farnham PJ, Knoepfler PS 2008 N-Myc regulates a widespread euchromatic program in the human genome partially independent of its role as a classical transcription factor. Cancer Res 68:9654–9662 [DOI] [PMC free article] [PubMed] [Google Scholar]
- Guccione E, Martinato F, Finocchiaro G, Luzi L, Tizzoni L, Dall' Olio V, Zardo G, Nervi C, Bernard L, Amati B 2006 Myc-binding-site recognition in the human genome is determined by chromatin context. Nat Cell Biol 8:764–770 [DOI] [PubMed] [Google Scholar]
- Kawaguchi T, Osatomi K, Yamashita H, Kabashima T, Uyeda K 2002 Mechanism for fatty acid “sparing” effect on glucose-induced transcription: regulation of carbohydrate-responsive element-binding protein by AMP-activated protein kinase. J Biol Chem 277:3829–3835 [DOI] [PubMed] [Google Scholar]
- Jansen-Dürr P, Meichle A, Steiner P, Pagano M, Finke K, Botz J, Wessbecher J, Draetta G, Eilers M 1993 Differential modulation of cyclin gene expression by MYC. Proc Natl Acad Sci USA 90:3685–3689 [DOI] [PMC free article] [PubMed] [Google Scholar]
- Ma L, Robinson LN, Towle HC 2006 ChREBP*Mlx is the principal mediator of glucose-induced gene expression in the liver. J Biol Chem 281:28721–28730 [DOI] [PubMed] [Google Scholar]
- Hargreaves DC, Horng T, Medzhitov R 2009 Control of inducible gene expression by signal-dependent transcriptional elongation. Cell 138:129–145 [DOI] [PMC free article] [PubMed] [Google Scholar]
- Koch F, Jourquin F, Ferrier P, Andrau JC 2008 Genome-wide RNA polymerase II: not genes only! Trends Biochem Sci 33:265–273 [DOI] [PubMed] [Google Scholar]
- Smale ST, Kadonaga JT 2003 The RNA polymerase II core promoter. Annu Rev Biochem 72:449–479 [DOI] [PubMed] [Google Scholar]
- Baugh LR, Demodena J, Sternberg PW 2009 RNA Pol II accumulates at promoters of growth genes during developmental arrest. Science 324:92–94 [DOI] [PubMed] [Google Scholar]
- Guenther MG, Levine SS, Boyer LA, Jaenisch R, Young RA 2007 A chromatin landmark and transcription initiation at most promoters in human cells. Cell 130:77–88 [DOI] [PMC free article] [PubMed] [Google Scholar]
- Wade JT, Struhl K 2008 The transition from transcriptional initiation to elongation. Curr Opin Genet Dev 18:130–136 [DOI] [PMC free article] [PubMed] [Google Scholar]
- Brès V, Yoh SM, Jones KA 2008 The multi-tasking P-TEFb complex. Curr Opin Cell Biol 20:334–340 [DOI] [PMC free article] [PubMed] [Google Scholar]
- Métivier R, Penot G, Hübner MR, Reid G, Brand H, Kos M, Gannon F 2003 Estrogen receptor-α directs ordered, cyclical, and combinatorial recruitment of cofactors on a natural target promoter. Cell 115:751–763 [DOI] [PubMed] [Google Scholar]
- Degenhardt T, Rybakova KN, Tomaszewska A, Moné MJ, Westerhoff HV, Bruggeman FJ, Carlberg C 2009 Population-level transcription cycles derive from stochastic timing of single-cell transcription. Cell 138:489–501 [DOI] [PubMed] [Google Scholar]
- Ford E, Thanos D 2009 Time's up: bursting out of transcription. Cell 138:430–432 [DOI] [PubMed] [Google Scholar]
- Kawaguchi T, Takenoshita M, Kabashima T, Uyeda K 2001 Glucose and cAMP regulate the L-type pyruvate kinase gene by phosphorylation/dephosphorylation of the carbohydrate response element binding protein. Proc Natl Acad Sci USA 98:13710- 13715 [DOI] [PMC free article] [PubMed] [Google Scholar]
- Riu E, Ferre T, Hidalgo A, Mas A, Franckhauser S, Otaegui P, Bosch F 2003 Overexpression of c-myc in the liver prevents obesity and insulin resistance. FASEB J 17:1715–1717 [DOI] [PubMed] [Google Scholar]
- Collier JJ, Scott DK 2004 Sweet changes: glucose homeostasis can be altered by manipulating genes controlling hepatic glucose metabolism. Mol Endocrinol 18:1051–1063 [DOI] [PubMed] [Google Scholar]
- Riu E, Ferre T, Mas A, Hidalgo A, Franckhauser S, Bosch F 2002 Overexpression of c-myc in diabetic mice restores altered expression of the transcription factor genes that regulate liver metabolism. Biochem J 368:931–937 [DOI] [PMC free article] [PubMed] [Google Scholar]
- Knoepfler PS 2007 Myc goes global: new tricks for an old oncogene. Cancer Res 67:5061–5063 [DOI] [PubMed] [Google Scholar]
- Cowling VH, Cole MD 2007 The Myc transactivation domain promotes global phosphorylation of the RNA polymerase II carboxy-terminal domain independently of direct DNA binding. Mol Cell Biol 27:2059–2073 [DOI] [PMC free article] [PubMed] [Google Scholar]
- Eilers M, Eisenman RN 2008 Myc's broad reach. Genes Dev 22:2755–2766 [DOI] [PMC free article] [PubMed] [Google Scholar]
- Hohmeier HE, Mulder H, Chen G, Henkel-Rieger R, Prentki M, Newgard CB 2000 Isolation of INS-1-derived cell lines with robust ATP-sensitive K+ channel-dependent and -independent glucose-stimulated insulin secretion. Diabetes 49:424–430 [DOI] [PubMed] [Google Scholar]
- Pedersen KB, Zhang P, Doumen C, Charbonnet M, Lu D, Newgard CB, Haycock JW, Lange AJ, Scott DK 2007 The promoter for the gene encoding the catalytic subunit of rat glucose-6-phosphatase contains two distinct glucose-responsive regions. Am J Physiol Endocrinol Metab 292:E788–E801 [DOI] [PubMed] [Google Scholar]
- Patrone G, Puppo F, Cusano R, Scaranari M, Ceccherini I, Puliti A, Ravazzolo R 2000 Nuclear run-on assay using biotin labeling, magnetic bead capture and analysis by fluorescence-based RT-PCR. Biotechniques 29:1012–1014; 1016–1017 [DOI] [PubMed] [Google Scholar]
- Cozar-Castellano I, Takane KK, Bottino R, Balamurugan AN, Stewart AF 2004 Induction of β-cell proliferation and retinoblastoma protein phosphorylation in rat and human islets using adenovirus-mediated transfer of cyclin-dependent kinase-4 and cyclin D1. Diabetes 53:149–159 [DOI] [PubMed] [Google Scholar]
Associated Data
This section collects any data citations, data availability statements, or supplementary materials included in this article.


