Abstract
Ecological speciation occurs when ecologically-based divergent selection causes the evolution of reproductive isolation. While there are many empirical examples of this process, there exists a poorly characterized stage during which the traits that distinguish species ecologically and reproductively segregate in a single population. Using a combination of genetic mapping, mate choice experiments, field observations, and population genetics, we studied a butterfly population with a mimetic wing color polymorphism and found that they exhibited partial color-based assortative mate preference. These traits represent the divergent, ecologically-based signal and preference components of sexual isolation that usually distinguish incipient and sibling species. The association between behavior and recognition trait in a single population may enhance the probability of speciation and provides an example for the missing link between an interbreeding population and isolated species.
Research focused on a variety of biological systems has yielded compelling examples of ecological speciation (1, Table S1). Some of the specific traits that have diverged due to natural selection and cause reproductive isolation as a result include host choice in phytophagous insects such as Rhagoletis flies (2) and Timema walking-sticks (3), body size in stickleback fish (4), coloration in cichlid fish (5) and poison-dart frogs (6, 7), and flowering time (8) and pollinator (9) in plants. While previous work on ecological speciation has been instrumental in characterizing the direct link between natural selection and speciation (10, 11), it has largely focused on systems in which populations are highly differentiated (Table S1). However, the means by which interbreeding populations transition to assortative mating on the basis of a trait under divergent natural selection are generally unknown.
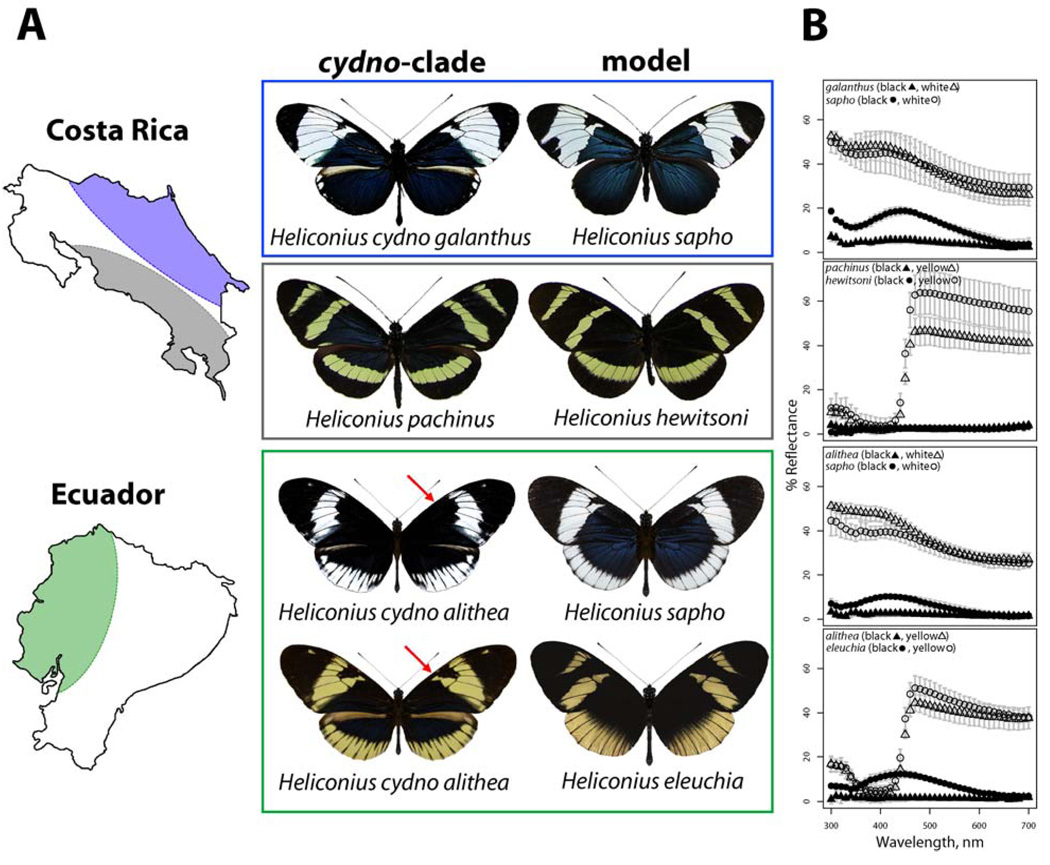
Mimetic wing patterns in Heliconius butterflies provide a clear example of a trait involved in ecological speciation (12). Heliconius butterflies are chemically defended and warningly-colored. Their evolutionary history has been marked by widespread color pattern divergence among closely-related species and geographic subpopulations (13). This is combined with convergence among distantly-related species as a result of natural selection for Müllerian mimicry (13), or mimicry among mutually protected species. Furthermore, closely-related species and geographic subpopulations that differ in mimetic wing pattern generally exhibit color pattern-based assortative mate preference whereby males preferentially approach and court females that share their color pattern (14, 15). Hence, selection for mimicry may generate premating reproductive isolation and precipitate speciation. For example, H. cydno galanthus and H. pachinus in Costa Rica are closely-related and interfertile species that have different wing color patterns as a result of divergent natural selection to match different mimicry models, H. sapho and H. hewitsoni (Fig. 1A). DNA sequence data support the relative order of diversification with the models being five times more divergent at mtDNA (16). The shift in mimicry between H. cydno and H. pachinus involves both color and pattern (Fig. 1B) and is accompanied by assortative mating (Fig. S1) which is mediated by male preference for white versus yellow wing color (14, 17). This assortative mate preference appears to prevent substantial hybridization where the two species meet (Fig. 1A), as hybrids have rarely been collected (18, 19).
Fig. 1.
Parallel divergence and Müllerian mimicry in Heliconius butterflies. (A) In Costa Rica, co-mimetic species pairs are restricted to opposite drainages. In western Ecuador H. eleuchia, H. sapho, and polymorphic H. cydno alithea (red arrows point to alternate Ac phenotypes) co-occur. (B) Spectral reflectance measurements of light (white or yellow) and dark (black or irridescent blue) wing patches show concordance between co-mimics and parallel divergence in Costa Rica and Ecuador (averaged across 10 nm intervals, error bars are standard deviation).
In western Ecuador, H. cydno alithea is locally polymorphic for the same white/yellow shift that generates premating isolation between H. cydno galanthus and H. pachinus in Costa Rica. As in Costa Rica, the color shift in H. cydno alithea appears to be due to selection for mimicry with the yellow morph matching H. eleuchia and the white morph matching H. sapho (Fig. 1A). Again, DNA sequence data support the relative order of diversification (16). Furthermore, field observations have demonstrated that alithea morph frequencies track those of H. sapho and H. eleuchia over time and space (20), and transplant experiments have demonstrated that the fitness of alithea morphs is determined by the local abundance of the models (20).
Heliconius cydno alithea is polymorphic for both color (white vs. yellow) and pattern (presence vs. absence of melanin patch, Fig. 1A). The genetic basis of this color and pattern variation was determined by crosses (16), which revealed that color is controlled by a single Mendelian locus with a dominant white allele and a recessive yellow allele. Pattern is controlled by a second, unlinked Mendelian locus with the presence of melanin dominant to absence. Heliconius cydno galanthus and H. pachinus from Costa Rica differ at five major color patterning loci, two of which have virtually identical phenotypes to those seen segregating in alithea; the K locus, which is tightly linked to the gene wingless (14), controls white vs. yellow whereas the unlinked Ac locus (21) controls presence vs. absence of melanin in the same region of the forewing. Backcrosses between yellow alithea and white galanthus showed tight linkage between color and wingless (LOD = 11.0), just as in crosses between galanthus and pachinus (LOD = 18.2).
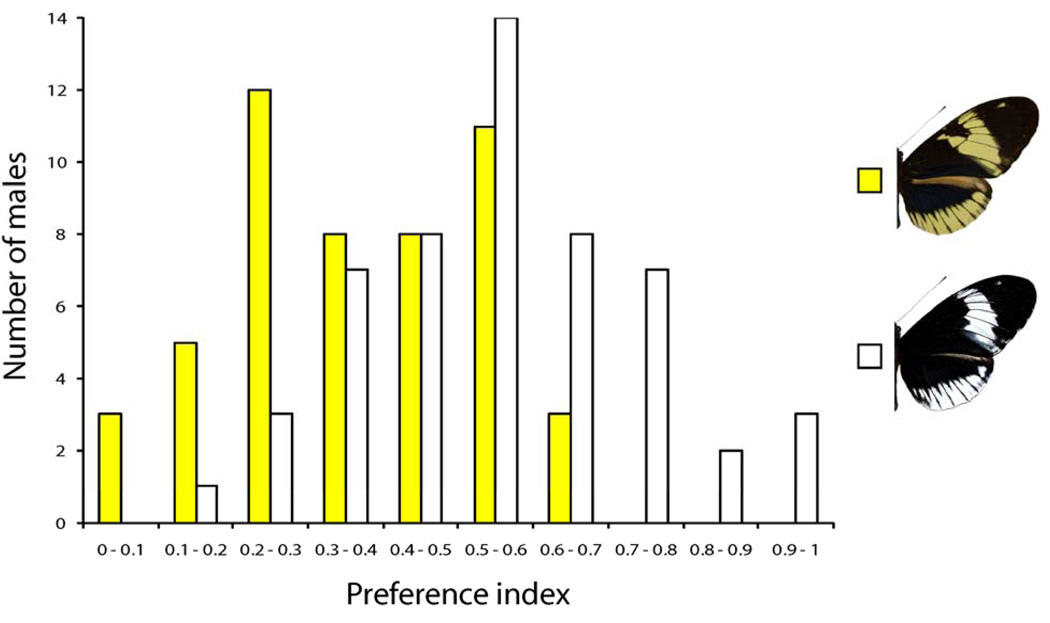
Assortative mate preference between H. cydno galanthus and H. pachinus is mediated by the K locus in that males recognize conspecific females based on color (14, 17). Furthermore, male preference for white vs. yellow is physically linked to the K locus (14). To determine whether there is color-based mate preference in H. cydno alithea, we tested 36 wild-caught and 139 captive-reared males for their preference of white or yellow alithea females (16). In total, we observed 1644 courtships by 115 males (Fig. 2). White and yellow males had divergent courtship preferences (G11 = 35.18, P = 2.32 ×10⁻⁴) with yellow males exhibiting a pronounced preference for yellow females (Z = 6.143, P < 10−9). White males had no significant preference (Z = 1.142, P = 0.254). Male preference was also affected by pattern differences, where yellow females with the melanic Ac patch were more attractive than yellow females without it (G12 = 27.24, P = 7.14 ×10⁻³). Male Ac phenotype and status (wild vs. captive) had no effect on preference. Field observations were also consistent with our experimental results, showing no color bias in white male chasing/mating behavior (G1 = 0.97, P = 0.33) but significant bias in yellow males towards yellow females (G1 = 10.98, P = 9×10⁻⁴).
Fig. 2.
Distribution of H. cydno alithea mate preference indices for yellow (yellow bars, maximum likelihood estimate = 0.36 [0.423 − 0.299]) and white (white bars, maximum likelihood estimate = 0.54 [0.604 − 0.475]) males. The preference index (x-axis) is the proportion of courtship and attempted mating events that were directed toward white females; a preference index of 1 indicates complete preference for white whereas 0 indicates complete preference for yellow. All males with two or more courtship events are shown.
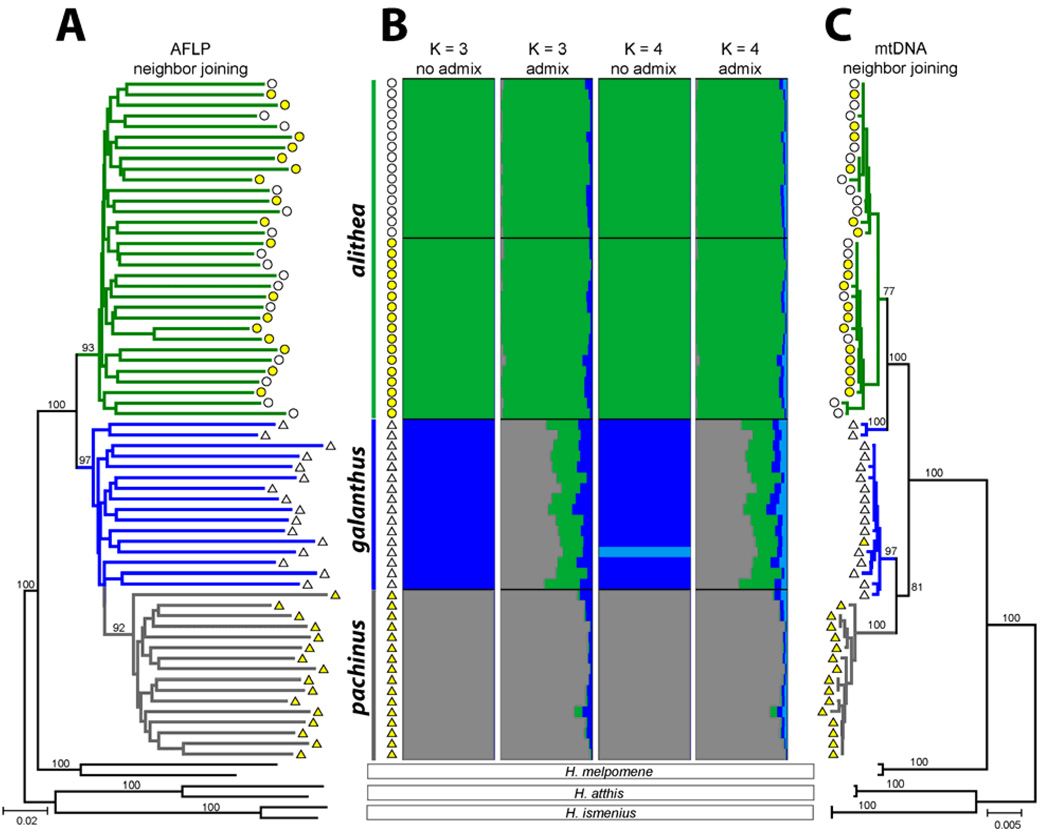
The difference in mate preference between the H. cydno alithea morphs may be explained if the color forms actually represent partially-isolated subspecies with overlapping distributions, much like sympatric host races in phytophagous insects. Thus, we genotyped white and yellow alithea specimens at over 800 AFLP loci and sequenced 1600 bp of mtDNA and generated comparative data for H. cydno galanthus, H. pachinus, and three outgroup species, H. melpomene, H. atthis, and H. ismenius. Phylogenetic and population genetic analyses showed that closely-related alithea, galanthus, and pachinus were differentiated (Fig. 3) but there was no genetic differentiation between white and yellow alithea; AMOVA-based FST = 0.001 (P = 0.35) for AFLPs and FST = 0.057 (P = 0.10) for mtDNA. Furthermore, STRUCTURE-based clustering (22) of the AFLP data failed to detect color associated subdivision in alithea (Fig. 3B) and constraining the morphs to form separate clusters resulted in a very poor fit to the data (Δ lnL = − 319). We also tested this hypothesis by examining patterns of linkage disequilibrium (LD) between the unlinked color patterning loci K and Ac (16). Strong assortative mating between the morphs should generate LD among unlinked markers yet we found no association between K and Ac in 68 wild-caught butterflies (P = 1.00). These results, combined with frequent observations of mixed mating in greenhouse cultures, indicate that the alithea morphs are not reproductively isolated and hence, appear to represent a single, polymorphic interbreeding population.
Fig. 3.
Population genetics of H. cydno alithea, H. cydno galanthus, and H. pachinus. (A) Bootstrap neighbor-joining tree of polymorphic AFLP markers (bootstrap values > 50% are shown). (B) STRUCTURE clustering (no-admixture and admixture) on AFLP data correctly identified the three populations at K=3 but clustering at K=4 resulted in a reduced likelihood and did not subdivide alithea by color. (C) Bootstrap neighbor-joining tree of mtDNA sequences (bootstrap values > 50% are shown). In each panel, individuals are designated by colored symbols (triangles for the Costa Rican taxa H. cydno galanthus and H. pachinus, circles for H. cydno alithea; white/yellow indicates wing color).
Another mechanism that could explain mimicry-based mate preference in alithea is genetic linkage between color and preference. Male color preference co-segregates with alleles at the color locus K in crosses between H. cydno galanthus and H. pachinus, and first generation hybrids have intermediate preference (14). Our alithea data support this hypothesis because yellow males (KyKy) exhibited yellow preference but white males, the majority (≈ 83%) of which was likely to be heterozygous at K (KWKy), did not. We hypothesize that this genetic association involves a mechanism preventing recombination, such as a single-locus controlling both traits or an inversion, because interbreeding between the morphs would disassociate them over time otherwise. Single locus control of signal and preference is unlikely generally (23) but may be facilitated in this case because ommochrome pigments color nymphalid butterfly wings (24) and serve as lateral filtering pigments in insect eyes (25). Lastly, the color/preference association in alithea is not likely due to self-referent phenotype matching, whereby males recognize their own color and preferentially court females which display the same color, because this would result in a white-biased preference among white males, similar to the yellow-bias observed in yellow males.
Heliconius cydno alithea may represent a very early stage in the evolution of reproductive isolation, when the same traits that distinguish sister species, in this case mimicry and color-based mate preference, segregate in a single population (supporting online text). To examine the relationship between alithea and other examples of ecological speciation, we reviewed the literature and scored 20 relevant biological systems for criteria that define the progression of speciation (table S1). A total of 10 criteria were summarized as five categorical variables (table S2); number of divergent phenotypic traits, genetic basis of these traits, presence vs. absence of postzygotic reproductive isolation, degree of spatial segregation, and strength of genetic differentiation. Multiple correspondence analysis of these variables revealed that H. cydno alithea differed from other examples of ecological speciation in that divergence is based on a single-locus trait and is not accompanied by postzygotic isolation or background genetic differentiation (Fig. S2). Interestingly, research on other examples of ecological speciation has revealed populations that may also be in an early stage of divergence (26–28) suggesting that continued examination of these and other systems will reveal a continuum in the trajectory of ecological speciation, as is evident in Heliconius butterflies.
Supplementary Material
Footnotes
References
- 1.Rundle HD, Nosil P. Ecol. Lett. 2005;8:336. [Google Scholar]
- 2.Feder JL, et al. Proc. Natl. Acad. Sci. USA. 1994;91:7990. doi: 10.1073/pnas.91.17.7990. [DOI] [PMC free article] [PubMed] [Google Scholar]
- 3.Nosil P, Crespi BJ, Sandoval CP. Nature. 2002;417:440. doi: 10.1038/417440a. [DOI] [PubMed] [Google Scholar]
- 4.McKinnon JS, et al. Nature. 2004;429:294. doi: 10.1038/nature02556. [DOI] [PubMed] [Google Scholar]
- 5.Seehausen O, et al. Nature. 2008;455:620. doi: 10.1038/nature07285. [DOI] [PubMed] [Google Scholar]
- 6.Summers K, Symula R, Clough M, Cronin T. Proc. R. Soc. Lond. B. 1999;266:2141. doi: 10.1098/rspb.1999.0900. [DOI] [PMC free article] [PubMed] [Google Scholar]
- 7.Reynolds RG, Fitzpatrick BM. Evolution. 2007;61:2253. doi: 10.1111/j.1558-5646.2007.00174.x. [DOI] [PubMed] [Google Scholar]
- 8.Snaydon RW, Davies MS. Heredity. 1976;39:9. [Google Scholar]
- 9.Bradshaw HD, Schemske DW. Nature. 2003;426:176. doi: 10.1038/nature02106. [DOI] [PubMed] [Google Scholar]
- 10.Schluter D. Science. 2009;323:737. doi: 10.1126/science.1160006. [DOI] [PubMed] [Google Scholar]
- 11.Rundle HD, Nosil P. Ecol. Lett. 2005;8:336. [Google Scholar]
- 12.Jiggins CD. Bioscience. 2008;58:541. [Google Scholar]
- 13.Brown KS. Annu. Rev. Entomol. 1981;26:427. [Google Scholar]
- 14.Kronforst MR, et al. Proc. Natl. Acad. Sci. USA. 2006;103:6575. doi: 10.1073/pnas.0509685103. [DOI] [PMC free article] [PubMed] [Google Scholar]
- 15.Jiggins CD, Naisbit RE, Coe RL, Mallet J. Nature. 2001;411:302. doi: 10.1038/35077075. [DOI] [PubMed] [Google Scholar]
- 16.See supporting material on Science Online for methods and additional text and data.
- 17.Kronforst MR, Young LG, Gilbert LE. J. Evol. Biol. 2007;20:278. doi: 10.1111/j.1420-9101.2006.01198.x. [DOI] [PubMed] [Google Scholar]
- 18.Kronforst MR, Young LG, Blume LM, Gilbert LE. Evolution. 2006;60:1254. [PubMed] [Google Scholar]
- 19.Gilbert LE. In: Ecology and Evolution Taking Flight: Butterflies as Model Systems. Boggs CL, Watt WB, Ehrlich PR, editors. Chicago, IL: University of Chicago Press; 2003. pp. 281–318. [Google Scholar]
- 20.Kapan DD. Nature. 2001;409:338. doi: 10.1038/35053066. [DOI] [PubMed] [Google Scholar]
- 21.Kronforst MR, Kapan DD, Gilbert LE. Genetics. 2006;174:535. doi: 10.1534/genetics.106.059527. [DOI] [PMC free article] [PubMed] [Google Scholar]
- 22.Pritchard JK, Stephens M, Donnelly P. Genetics. 2000;155:945. doi: 10.1093/genetics/155.2.945. [DOI] [PMC free article] [PubMed] [Google Scholar]
- 23.Butlin RK, Ritchie MG. Biol. J. Linn. Soc. 1989;37:237. [Google Scholar]
- 24.Gilbert LE, Forrest HS, Schultz TD, Harvey DJ. J. Res. Lep. 1988;26:141. [Google Scholar]
- 25.Linzen B. Adv. Insect Physiol. 1974;10:117. [Google Scholar]
- 26.Snowberg LK, Bolnick DI. Am. Nat. 2008;172:733. doi: 10.1086/591692. [DOI] [PubMed] [Google Scholar]
- 27.van der Sluijs I, van Alphen JJM, Seehausen O. Behav. Ecol. 2008;19:177. [Google Scholar]
- 28.Nosil P, Harmon LJ, Seehausen O. Trends Ecol. Evol. 2008;24:145. doi: 10.1016/j.tree.2008.10.011. [DOI] [PubMed] [Google Scholar]
- 29.We thank J. Olander and the staff of Heliconius Butterfly Works, T. and M. Quesenberry, S. Villamarín, K. Kronforst, A. Gonzalez-Karlsson, I. Pagano, Ecuador’s Ministerio del Ambiente, and the Museo Ecuatoriano de Ciencias Naturales for facilitating this work. Supported by NSF grant DEB0640512 and NIH NIGMS grant GM068763. DNA sequences deposited in GenBank, accessions GQ398158 - GQ398227.
Associated Data
This section collects any data citations, data availability statements, or supplementary materials included in this article.


