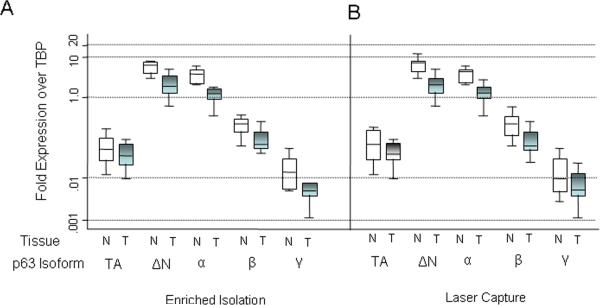
Figure 1. Relative levels of TP63 mRNA isoforms in primary prostate cancer and matched benign tissues.
A) Tissue obtained by macrodissection (Enriched Isolation) of frozen normal and tumor pairs. Box represents distribution of data from n = 12 patients each. N = normal tissue. T = tumor tissue. B) Relative levels of TP63 mRNA isoforms obtained after laser capture microdissection (n = 9).

