Abstract
Cannulation is necessary when blood is removed from the body, for example in hemodialysis, cardiopulmonary bypass, blood oxygenators, and ventricular assist devices. Artificial blood contacting surfaces are prone to thrombosis, especially in the presence of stagnant or recirculating flow. In this work, computational fluid dynamics was used to investigate the blood flow fields in three clinically available cannulae (Medtronic DLP 12, 16 and 24 F), used as drainage for pediatric circulatory support, and to calculate parameters which may be indicative of thrombosis potential. The results show that using the 24 F cannula below flow rates of about 0.75 l/min produces hemodynamic conditions which may increase the risk of blood clotting within the cannula. No reasons are indicated for not using the 12 or 16 F cannulae with flow rates between 0.25 and 3.0 l/min.
Keywords: computational fluid dynamics, cannula, thrombus, shear stress, hemodynamics, ventricular assist device, blood, flow
Introduction
Cardiovascular disease is the leading cause of mortality globally 1 and among the various forms, heart failure (HF) affects 5.7 million patients in the United States.2 The fatality rate for HF is high, with one in five people dying within 1 year.2 Thousands of HF patients would benefit from a heart transplant, however, only approximately 2300 donor hearts become available each year 3 resulting in only about 6 % of the estimated 35,0004 US patients who would benefit from a heart actually receiving a transplant. To address the need to support the circulation in patients with end-stage HF, a wide variety of ventricular assist devices (VADs) has been developed over the past four decades.
Almost all VADs require a cannula to take blood from the ventricle to the device.5–7 An exception is the Jarvik Heart which is located within the ventricle alleviating the need for an inflow cannula.8 Different VADs require different connections and cannula uses. In one example of LVAD support, the inflow cannula is inserted into the apex of the left ventricle (LV) and an outflow cannula is required to feed blood from the VAD to the aorta. A wide range of inflow cannulae exists, varying in geometric design, size, and materials.9 The tips of some cannulae are rounded with several inlet holes,10 or conical basket shaped,11 while others are straight tubes,12 “beak” shaped12 or four pronged. The cannula bodies may be flexible, possibly made from wire reinforced tubing, or rigid with an angle, possibly made from titanium.
The cannula is the junction between the native heart and the artificial organ and, as such, is a problematic area. In a retrospective analysis of 141 preclinical animal experiments,131 performed with a range of devices and at various stages of the development process, adverse events related to the cannula made up the largest fraction, 56 %, of the total number of adverse events. Despite this large number of problems, there are far fewer studies of cannula design or testing in the literature than studies of VAD design and testing.13
The cannula may suffer from several different types of problems including: kinks, suction leading to obstruction, and thrombosis. There are a number of reports of thrombus being formed in the LV14 which can block the cannula and obstruct flow to the pump,15 either temporarily16 or completely. A serious consequence of thrombosis is the formation of emboli and microemboli. in the heart, or artificial organ, which may spread to the brain leading to potentially fatal transitory ischemic attacks, reversible ischemic neurologic deficits, strokes, and intracranial bleeding.17 While the origins of these emboli may be in the device, or elsewhere in the artificial system, some evidence indicates they are formed either in the ventricle or in the cannula (Figure 1). In patients implanted with the INCOR LVAD significant levels of cerebrovascular thromboembolic events occurred and from the nature of the alarms which sounded, the emboli responsible were thought to originate inside the native ventricle, rather than in the pump itself.17
Figure 1.
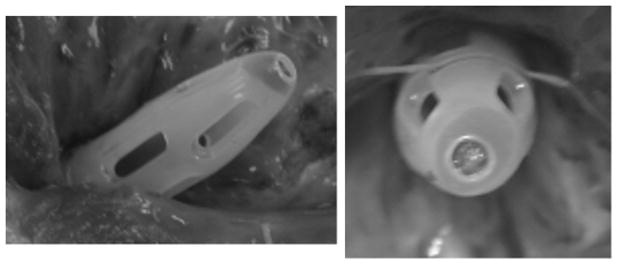
Example of thrombosis inside a 24F Medtronic DLP venous drainage cannula which was used in an animal implant. Similar clots have been found in other cannulae with similar designs.
Hemostasis and blood coagulation have, for a long time, been known to involve three aspects: the nature of the surface, the condition of the blood, and the local flow conditions. The local flow conditions influence blood clotting, with the presence of stagnant, slow or recirculating flows and low shear stresses18 increasing the thrombogenicity. Additionally, platelet activation is related to high shear stresses19 and platelet adhesion requires transport of platelets from the bulk flow to the surface, and is therefore associated with regions of disturbed flow.20
In the past, cannulae have been studied experimentally, to determine pressure drops and hemodynamic energy 21 and in vivo, to investigate biocompatibility and blood damage.12,13 There have also been several numerical studies: parameterized models have been used to investigate the influence of side holes on peak shear rates and flow distribution 22,23; models of specific hemodialysis cannulae have been used to validate hemolysis calculations 24 and study flow fields in a more complicated cannula design 25; a study on a new design for a cardiopulmonary bypass cannula predicted higher flow rates and exit velocities compared with a control cannula 26; and, in a new design for an artificial lung access cannula 27, the influence of the novel geometry on shear stress distribution and hemolysis production was assessed 28.
The above studies are focused mainly on hemolysis, or hemolysis potential, and thus report either calculations of hemolysis index, or maximum shear rates and locations. Despite the obvious clinical significance 29,30 there do not appear to have been any numerical studies of clotting, or thrombosis potential, in LVAD cannulae. Therefore, since thrombosis in blood wetted devices depends on the presence of stagnant, recirculating flow and low shear stresses, the aim of this work was to numerically investigate the flow fields in cannulae of varying sizes, and at varying flow rates, and calculate parameters related to clotting potential and thus determine the range of flow rates in which the cannulae can be used with only a low thrombosis potential.
Methods
Geometry
The circumference of the LV cavity was manually segmented from a set of magnetic resonance images (MRI) of a healthy heart. The segmented contours were imported into the CAD software SolidWorks (SolidWorks Corp. Concord, MA) and the volume of the LV was reconstructed.
The geometries of the commercially available, Medtronic DLP 12 F, 16 F and 24 F cannulae, which are being considered for use with pediatric VADs, were obtained from their computer aided design (CAD) files. Sizes of medical cannulae are measured in units of French (F) where the F value is three times the external diameter of the cannula. A schematic diagram of the cannulae is shown in Figure 2 and dimensions for the three cannulae are given in Table 1. The length of the cannula was extended so that the positioning of the constant pressure outlet boundary condition would not affect the solution. This extension was 100 D for 12 F, 40 D for 16 F and 20 D for 24 F cannula, where D is the diameter at the outlet.
Figure 2.

Schematic diagram of cannulae showing dimensions given in Table 1
Table 1.
Important dimensions of cannulae
| Cannula | Internal diameters (mm) | Side holes (mm) | |||
|---|---|---|---|---|---|
| Central hole (D1) | Main length (D2) | Outlet section (D3) | Length (L) | Width (W) | |
| 12 F | 1.016 | 2.540 | 6.096 | 2.03 | 0.76 |
| 16 F | 1.016 | 4.572 | 6.096 | 3.76 | 1.22 |
| 24 F | 2.032 | 6.604 | 9.652 | 7.17 | 1.83 |
Meshing
Gambit 2.4.6 (Ansys, Canonsburg, PA) was used to mesh the fluid volume in the combined LV and cannula geometry. The cannula was inserted half way into the LV (3 cm from cannula tip to LV apex). Boundary layers and size functions were used to increase the mesh density in areas where the velocity gradients were expected to be large. The regions within and around the cannula tip were meshed with tetrahedral elements, and size functions were implemented so the density was highest around the central cannula hole. The remaining cannula sections were meshed using structured hexahedral elements with a boundary layer of growing cells attached to the wall. Important mesh parameters are given in Table 2. These mesh sizes were chosen based on a mesh refinement study on the 16 F cannula with a flow rate of 1.0 l/min. Three meshes were used in this refinement study: coarse, medium and fine. Based on the results of this study the fine mesh was chosen and the parameters for this mesh are the ones in Table 2. The sizes of the cells in the medium (1.51 M cells) and coarse (0.39 M cells) meshes were 1.5 and 1.52 times these values respectively, to give a mesh refinement ratio of 1.5.
Table 2.
Mesh sizes
| Cannula | LV (tet) | Cannula tip (tet) | Cannula (hex) | Total (M) | |||||||
|---|---|---|---|---|---|---|---|---|---|---|---|
| Cell sizes (mm) | Cell number (M) | Cell sizes (mm) | Cell number (M) | Radial size (mm) | Axial size | Cell number (M) | |||||
| Smallest cells | Largest cells | Smallest cells | Largest cells | Cell closest to wall | Core cells | ||||||
| 12 F | 0.2 | 2.0 | 0.76 | 0.02 | 0.2 | 3.87 | 0.02 | 0.2 | 1.0 | 0.47 | 5.11 |
| 16 F | 0.2 | 2.0 | 0.76 | 0.015 | 0.2 | 3.66 | 0.015 | 0.15 | 1.0 | 0.36 | 4.79 |
| 24 F | 0.2 | 2.0 | 0.59 | 0.011 | 0.2 | 2.50 | 0.011 | 0.11 | 1.0 | 0.38 | 3.47 |
Calculations
The finite volume CFD software Fluent 6.3.26 (Ansys) was used to calculate flow through the combined LV-cannula geometries. Flow rates between 0.25 and 3 l/min were used (0.25, 0.50, 0.75, 1.00, 2.00 and 3.00 l/min). A constant uniform velocity was assumed at the entrance to the LV and the pressure at the cannula outlet was set to 0 Pa. The velocity was set to zero at the wall (no slip conditions). Discretization was second order. The SIMPLE scheme for pressure-velocity coupling was used, except in the 12 F cannula calculations which converged more easily using the coupled solver. The coupled solver is more robust as it solves the momentum and pressure equations together. Blood was assumed to be a Newtonian fluid with a density of 1050 kg/m3 and a viscosity of 0.0039 kg/m-s and the impact of the Newtonian assumption is discussed later. The Reynolds numbers (Re = νD/v, calculated based on the mean velocity in the main section of the cannula) were between 217 and 2600. Therefore the higher flow rates are likely to involve transitional turbulence. However, since the accuracy of turbulence modeling for transitional flow is dubious, a laminar model was used for all calculations. Convergence was assessed using scaled residuals and calculations were considered converged when all four (continuity and three velocity components) scaled residuals were below 1×10⁻⁴.
Results
Meshing
Mesh convergence was assessed in the 16 F cannula, with a flow rate of 1 l/min, according to the quantification of uncertainty principles outlined by Roache.31,32 The order of the convergence was calculated as:
where Pcoarse, Pmedium, Pfine are the pressure drops across the cannula using the coarse, medium and fine meshes respectively, and r is the mesh refinement ratio (1.5). p was 2.6, showing that the solution was at least second order. The following ordered error estimates, based on the speed, c, were used to calculate the mean percentage errors for each mesh (Figure 3):
Figure 3.
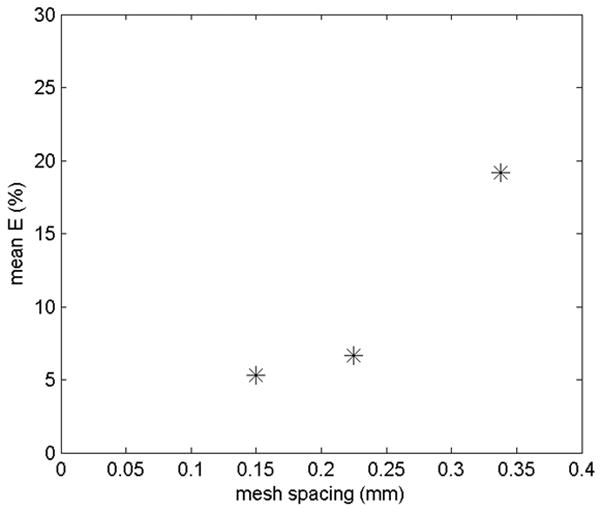
Mean percentage errors for the three meshes from the ordered error estimators
The fine mesh was chosen since the mean error of 5 % was within acceptable limits.
Validation
The pressure drop across the cannula was compared with experimentally measured pressure drops for each cannula (Figure 4). The mean percentage error in the calculated pressure drops, as compared to the experimentally measured pressure drops, was 7 %. The largest contributions to this difference come from the discretization error and experimental uncertainty.
Figure 4.
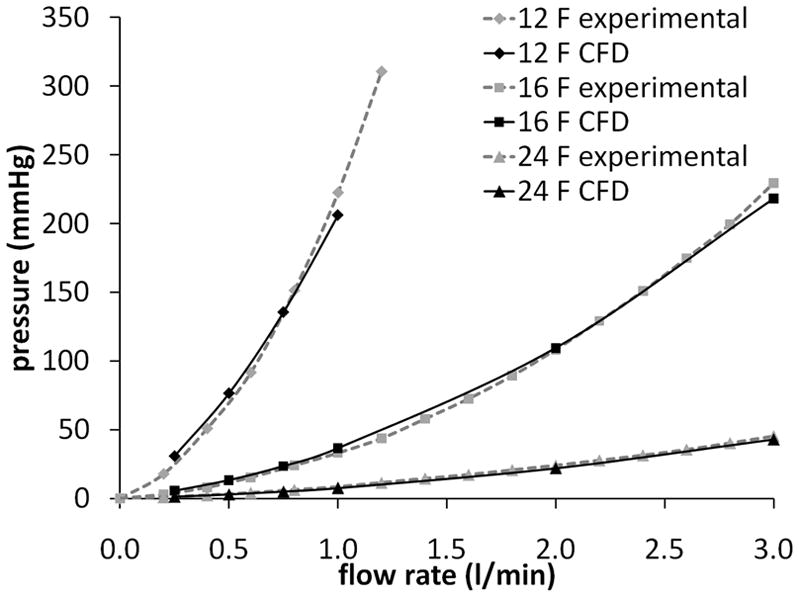
Comparison of calculated and experimentally measured pressure drops for the three cannulae
Stagnated flow
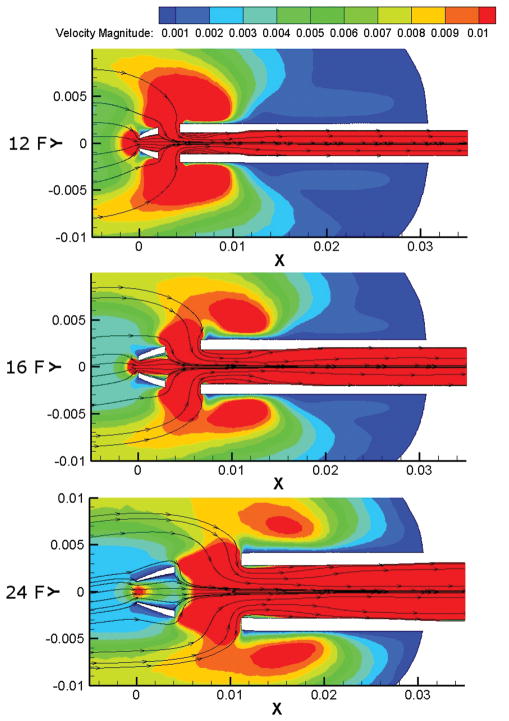
An overview of the regions with flow stagnation was obtained by finding the total volume, within the combined LV-cannula flow domain, but excluding the extended outlet length, in which the velocity magnitude was less than 1 mm/s (Figure 5a). As expected the stagnant volume increased as the flow rate decreased, with a rapid increase below about 0.75 l/min. Unexpectedly, the overall stagnant volume increased as the size of the cannula decreased. Plots of the velocity magnitude show that this was because the stagnation volume was dominated by stagnant flow within the LV (Figure 6). Since the cannulae were all positioned such that the tip was inserted the same distance into the LV, this resulted in a decrease in the distance of the most distal end of the side holes from the LV apex. This had the effect of creating a stagnant region at the apex of the LV with the smaller cannulae. These stagnant regions show the importance of cannula positioning and are in agreement with anecdotal evidence that positioning cannulae too deeply can result in blood clotting in the VAD.33
Figure 5.
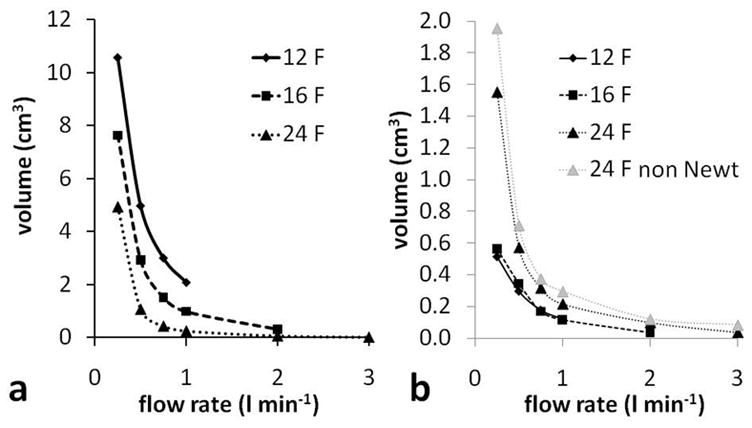
a - Volume with velocity magnitude < 1 mm/s (total LV-cannula volume, excluding outlet length), and b - volume, within just the cannula, with velocity magnitude < 1 mm/s (excluding outlet length). 24 F cannula results are also shown for a non Newtonian blood viscosity model and these results are explained in the Discussion.
Figure 6.
Velocity magnitude in 12, 16 and 24 F cannulae with flow rate 0.25 l/min. Only speeds between 0.001 and 0.01 m/s (1 and 10 mm/s) are shown.
Examining the flow field within the cannulae only, showed that the largest cannula (24 F) had the largest stagnant flow volumes (Figure 5b) and a rapid increase in stagnant flow within the cannula occurred when the flow rate was below 0.75 l/min. This increase in the stagnant flow volume was due mainly to slow flow in the cannula tip, just downstream of the central hole, with some contribution from slow flow in the diffuser part of the cannula at the downstream end. There was negligible stagnant flow in the 16 F cannula at 2.00 l/min. Below 2.00 l/min the stagnant flow volume in the 16 F cannula increased gradually as the flow rate decreased. Stagnant flow volumes were very similar for the 12 and 16 F cannulae. This is firstly because there is little stagnant flow in either cannula, and, secondly, due to recirculation zones and stagnant flow in the diffuser of the 12 F cannula. Stagnant flow volumes in the tip of the 16 F cannula (Figure 6) had a similar volume to stagnant flow volumes in the diffuser section of the 12 F cannula. The 12 F cannula has a larger ratio of outlet to main section diameters (Table 1) which increases recirculation.
Low shear rates
In their study of clot deposition in a pulsatile blood pump, Hochareon et al 18 found an area of clot formation in a region of the pump chamber in which the wall shear rate did not exceed 250/s. In the present work, the volume of blood in which the magnitude of the shear rate tensor was less than 250/s is used as an indication of thrombosis potential. The volume with shear rate below 250/s was found to increase as the flow rate decreased (Figure 7a). This increase was most prominent for the 24 F cannula; in the 12 and 16 F cannula there was only a significant increase in the low shear rate volume below 0.5 l/min. There is little difference in the volumes for 12 and 16 F cannulae, and the 12 F volumes are even a little larger than the 16 F ones. With the 12 F cannula the LV has a larger volume, therefore any reduction in the low shear rate volume within the cannula is compensated by an increase in the low shear rate volume outside the cannula (Figure 8).
Figure 7.
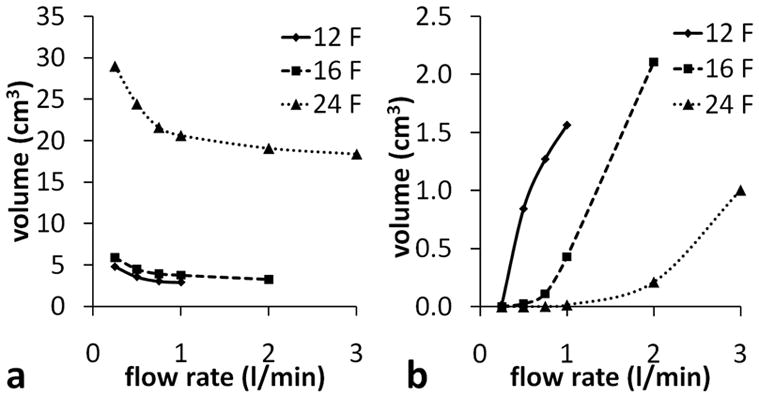
a - Volume with shear rate magnitude < 250/s and, b - volume with shear rate magnitude > 2564/s (within cannula, excluding outlet length).
Figure 8.
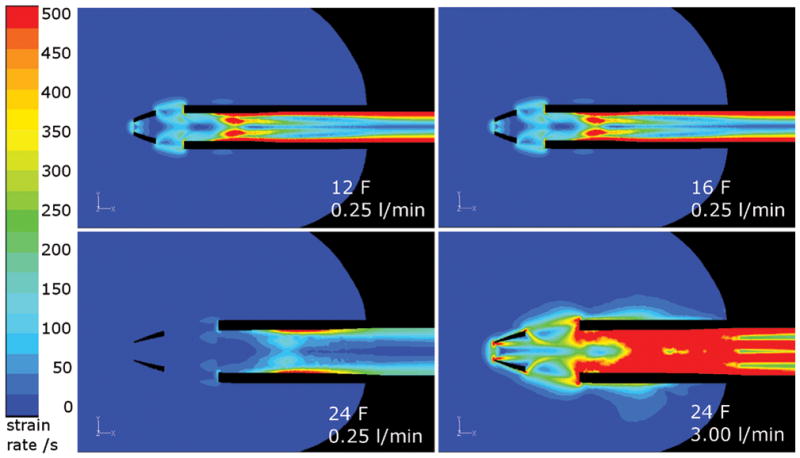
Top: Low shear rate volumes in 12 and 16 F cannulae at 0.25 l/min are similar. Bottom: Decrease in low shear rate volume with increasing flow rate in the 24 F cannula. Shear rates between 0 and 500/s are shown.
Recirculating flow
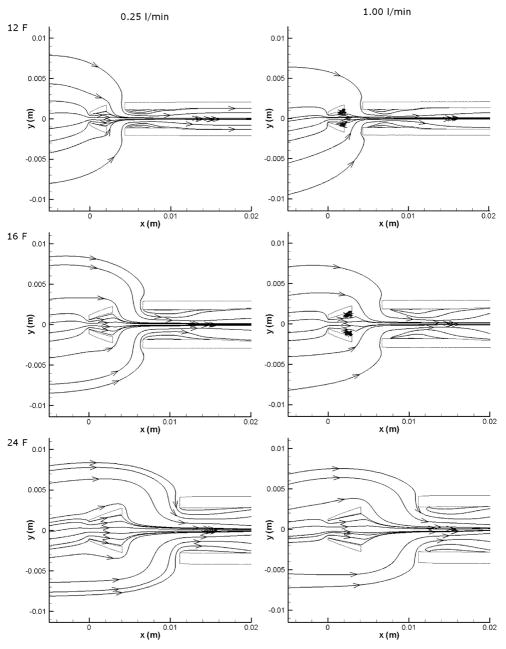
At low flow rates, flow remained attached at the cannula walls; however, as the flow rate was increased, small recirculation regions developed downstream of the central hole (Figure 9). At a flow rate of 1.00 l/min, recirculation regions were clearly visible in the 12 and 16 F cannulae, while similar regions only appeared in the 24 F cannula at the 3.00 l/min flow rate (the associated separation can be seen in Figure 8). To compare the amount of recirculation at different flow rates, the volume in which the x-component of the velocity (vx) was negative was used as an indicator of recirculation (not shown). In the 24 F cannula the total volume with a negative vx increased with flow rate from 2.4 cm3 at 0.25 l/min to 3.1 cm3 at 1.00 l/min.
Figure 9.
Recirculation regions in the tips of the cannulae
High shear rates
While low shear rates are associated with platelet adhesion and blood clotting, higher shear rates are associated with platelet activation, and even higher shear rates are associated with hemolysis. Hemolysis requires shear stresses of at least 150 Pa,34 which corresponds to a shear rate of 38462/s in this study with a viscosity of 3.9 cP. Platelets are activated at much lower shear stresses of about 10 Pa34 or shear rates above 2564/s.
Very small volumes (<1 mm3) with shear rates greater than 38462/s were found in the 12 F cannula with flow rates above 0.75 l/min, and in the 16 F cannula above 2.00 l/min. Volumes with shear rates greater than 2564/swere found in all three cannulae at high enough flow rates (Figure 7b). However, this analysis does not take account of the exposure time, which is likely to be below the time required for both platelet activation and hemolysis.
Discussion
The flow fields in three different LVAD drainage cannulae were calculated using CFD and parameters associated with thrombosis were investigated. Calculations of the pressure drop were in good agreement with experimental values and the mesh convergence study gave discretization errors of around 5 %, showing that the calculations are acceptable for the proposed analysis given the limitations which are outlined below. The low shear rate volume increased steadily as the flow rate was reduced in the 24 F cannula, however there were only small increases in the volumes in the 12 and 16 F cannulae. The stagnant flow volume also increased as the flow rate decreased, with a particularly rapid increase in the 24 F cannula below 0.75 l/min.
While comparison with clinical results is beyond the scope of this paper, it is interesting to notice the comparison with the clot shown in Figure 1. The main regions experiencing all of the factors (low shear, slow flow and recirculation) are located between the central and first side hole; the location of the clot in Figure 1.
Limitations
For comparison with the experimental pressure drop validation results, this study assumed a Newtonian viscosity for blood, which is only valid if the shear rates are above 100/s. In reality blood is a shear thinning fluid with a viscosity that can be described with, for example, a modified Casson35,36 type model. In considering thrombosis, the shear rates are necessarily low so the Newtonian assumption may have limited validity. To assess the range of the validity the simulations were repeated in the 24 F cannula using the non-Newtonian viscosity, μ:
where τ0 is the yield stress taken to be 0.005 Pa, ϕ is the magnitude of the shear rate and μC is the Casson viscosity, taken to be the high shear limit, 3.5 cP. This gives a viscosity of 0.0039 kg/m-s at 461/s. The stagnant flow volumes were found to be slightly larger with the non-Newtonian fluid (Figure 5b), particularly at the lowest flow rate of 0.25 l/min where the difference was 26 %. The reason for this is that the shear rate is different near the different cannula holes, with the lowest shear rate near the central hole and the highest near the second set of side holes. Then, when the shear thinning blood model was introduced the viscosity was higher in the vicinity of the central hole compared with the side holes. This increased the resistance to flow though the central hole, shifting the balance of flow to the side holes, and resulting in slower flow in the cannula tip.
Other limitations in this study include the pulsatility of the blood flow and the motion of the heart. Even with a continuous flow VAD the heart is still pumping to some extent, and the motion of the LV walls will significantly influence the flow field in the LV. The stagnant flow and low shear rate volumes in the LV are likely to be reduced by the motion of the heart. The pulsatility of the flow will affect the flow fields within the cannulae; in particular the amount of flow recirculation is likely to be increased as vortices are generated during the flow deceleration phase and this may reduce the stagnant and low shear volumes. The positioning of the smaller cannulae created stagnant flow at the apex and this observation may warrant further study into the effect of insertion depth on thrombosis potential. There is limited experimental data on the conditions required for blood to clot, the thresholds for “stagnant flow” and “low shear” may be refined as more data become available.
Conclusion
Despite limitations, this study is a useful comparison of the fluid dynamic characteristics of commercially available cannulae under controlled conditions, which reveals significant differences in the thrombolytic properties of the flow fields generated within the cannulae. In the future, more sophisticated models of ventricle-cannula flow and thrombosis potential may be used to refine surgical technique and develop improved cannulae.
Acknowledgments
This study was supported in part by the National Institutes of Health (Grant Number: R01HL088100).
References
- 1.WHO. [Accessed 2007];Fact Sheet No. 317. http://www.who.int/mediacentre/factsheets/fs317/en/print.html.
- 2.Lloyd-Jones D, Adams R, Carnethon M, et al. Heart Disease and Stroke Statistics 2009 Update: A Report From the American Heart Association Statistics Committee and Stroke Statistics Subcommittee. Circulation. 2009;119:e21–e181. doi: 10.1161/CIRCULATIONAHA.108.191261. [DOI] [PubMed] [Google Scholar]
- 3.Health Resources and Services Administration, U.S. Department of Health and Human Services. [Accessed May 8, 2009];Organ Procurement and Transplant Network. Available at: http://optn.transplant.hrsa.gov/latestData/rptData.asp.
- 4.Warrell DA, Cox TM, Firth JD, Benz EJ. Oxford Textbook of Medicine. 4. Vol. 2. Oxford: Oxford University Press; 2005. [Google Scholar]
- 5.Tschirkov A, Nikolov D, Papantchev V. New Technique for Implantation of the Inflow Cannula of Berlin Heart INCOR system. Eur J Cardiothorac Surg. 2006;30:678–679. doi: 10.1016/j.ejcts.2006.07.005. [DOI] [PubMed] [Google Scholar]
- 6.Komoda T, Weng Y, Hetzer R. Technique for Insertion of the Inflow Cannula of the INCOR Left Ventricular Assist Device. Ann Thorac Surg. 2008;85:1466–1467. doi: 10.1016/j.athoracsur.2007.10.010. [DOI] [PubMed] [Google Scholar]
- 7.Wieselthaler GM, Schima H, Wolner E. Special Considerations on the Implantation Technique for the MicroMed-DeBakey Ventricular Assist Device Pump. Ann Thorac Surg. 2003;76:2109–2111. doi: 10.1016/s0003-4975(03)00556-3. [DOI] [PubMed] [Google Scholar]
- 8.Westaby S, Frazier OH, Pigott DW, Saito S, Jarvik RK. Implant Technique for the Jarvik 2000 Heart. Ann Thorac Surg. 2002;73:1337–1340. doi: 10.1016/s0003-4975(01)03599-8. [DOI] [PubMed] [Google Scholar]
- 9.Gregoric ID, Cohn WE, Akay MH, Francesca SL, Myers T, Frazier OH. CentriMag Left Ventricular Assist System Cannulation Through Right Minithoracotomy. Tex Heart Inst J. 2008;35:184–185. [PMC free article] [PubMed] [Google Scholar]
- 10.Tuzun E, Harms K, Liu D, et al. Preclinical Testing of the Levitronix Ultramag Pediatric Cardic Assist Device in a Lamb Model. ASAIO J. 2007;53:392–396. doi: 10.1097/MAT.0b013e3180340974. [DOI] [PubMed] [Google Scholar]
- 11.Szymanski P, Religa G, Klisiewicz, Baranska K, Hoffman P. Diagnosis of Biventricular Assist Device Inflow Cannula Obstruction. Echocardiogr - J Card. 2007;24:420–424. doi: 10.1111/j.1540-8175.2006.00409.x. [DOI] [PubMed] [Google Scholar]
- 12.Watanabe K, Asai T, Ichikawa S, et al. Development of a Flexible Inflow Cannula With Titanium Inflow Tip for the NEDO Biventricular Assist Device. ASAIO J. 2004;50:381–386. doi: 10.1097/01.mat.0000132555.85820.8e. [DOI] [PubMed] [Google Scholar]
- 13.Litwak KN, Unger LS, Fukamachi K, Saeed D. Retrospective Analysis of Adverse Events in Preclinical Ventricular Assist Device Experiments. ASAIO J. 2008;54:347–350. doi: 10.1097/MAT.0b013e31817d92a8. [DOI] [PubMed] [Google Scholar]
- 14.Miyake Y, Sugioka K, Bussey CD, Di Tullio M, Homma S. Left Ventricular Mobile Thrombus Associated with Ventricular Assist Device. Circ J. 2004;68:383–384. doi: 10.1253/circj.68.383. [DOI] [PubMed] [Google Scholar]
- 15.Chumnanvej S, Wood MJ, MacGillivray TE, Vidal Melo MF. Perioperative Echocardiographic Examination for Ventricular Assist Device Implantation. Anesth Analg. 2007;105:583–601. doi: 10.1213/01.ane.0000278088.22952.82. [DOI] [PubMed] [Google Scholar]
- 16.Etz C, Welp H, Rothenburger M, et al. Analysis of Platelet Function During Left Ventricular Support with the Incor and Excor System. Heart Surg Forum. 2004;7:e423–e427. doi: 10.1532/HSF98.20041073. [DOI] [PubMed] [Google Scholar]
- 17.Schmid C, Tjan TDT, Etz C, et al. First Clinical Experience With the Incor Left Ventricular Assist Device. J Heart Lung Transplant. 2005;24:1188–1194. doi: 10.1016/j.healun.2004.08.024. [DOI] [PubMed] [Google Scholar]
- 18.Hochareon P, Manning KB, Fontaine AA, Tarbell JM, Deutsch S. Correlation of In Vivo Clot Deposition With the Flow Characteristics in the 50 cc Penn State Artificial Heart: A Preliminary Study. ASAIO J. 2004;50:537–542. doi: 10.1097/01.mat.0000145694.40637.a0. [DOI] [PubMed] [Google Scholar]
- 19.Varga-Szabo D, Pleines I, Nieswandt B. Cell Adhesion Mechanisms In Platelets. Arterioscler Thromb Vasc Biol. 2008;28:403–412. doi: 10.1161/ATVBAHA.107.150474. [DOI] [PubMed] [Google Scholar]
- 20.Zhao R, Marhefka JN, Shu F, Hund SJ, Kameneva MV, Antaki JF. Micro-flow visualization of red blood cell-enhanced platelet concentration at sudden expansion. Ann Biomed Eng. 2008;36:1130–1141. doi: 10.1007/s10439-008-9494-z. [DOI] [PMC free article] [PubMed] [Google Scholar]
- 21.Rider AR, Ji B, Kunselmann AR, Weiss WJ, Myers JL, Undar A. A Performance Evaluation of Eight Geometrically Different 10 Fr Pediatric Arterial Cannulae Under Pulsatile and Nonpulsatile Conditions in an Infant Cardiopulmonary Bypass Model. ASAIO J. 2008;54:306–315. doi: 10.1097/MAT.0b013e3181744071. [DOI] [PubMed] [Google Scholar]
- 22.Grigioni M, Daniele C, Morbiducci U, et al. Computational model of the fluid dynamics of a cannula inserted in a vessel: incidence of the presence of side holes in blood flow. J Biomech. 2002;35:1599–1612. doi: 10.1016/s0021-9290(02)00231-2. [DOI] [PubMed] [Google Scholar]
- 23.Park JY, Park CY, Min BG. A numerical study of the effect of side hole number and arrangement in venous cannulae. J Biomech. 2007;40:1153–1157. doi: 10.1016/j.jbiomech.2006.04.005. [DOI] [PubMed] [Google Scholar]
- 24.De Wachter D, Verdonck P. Numerical Calculation of Hemolysis Levels in Peripheral Hemodialysis Cannulas. Artif Organs. 2002;26:576–582. doi: 10.1046/j.1525-1594.2002.07079.x. [DOI] [PubMed] [Google Scholar]
- 25.Mareels G, De Wachter DS, Verdonck PR. Computational Fluid Dynamics-Analysis of the Niagara Hemodialysis Catheter in a Right Heart Model. Artif Organs. 2004;28:639–648. doi: 10.1111/j.1525-1594.2004.07371.x. [DOI] [PubMed] [Google Scholar]
- 26.Jegger D, Sundaram S, Shah K, Mallabiabarrena I, Mucciolo G, von Segesser LK. Using computational fluid dynamics to evaluate a novel venous cannula (Smart cannula) for use in cardiopulmonary bypass operating procedures. Perfusion. 2007;22:257–265. doi: 10.1177/0267659107083657. [DOI] [PubMed] [Google Scholar]
- 27.Wang D, Zhou LX, Sidor B, Lynch J, Zwischenberger JB. Wang-Zwische Double Lumen Cannula - Toward a Percutaneous and Ambulatory Paracoporeal Artificial Lung. ASAIO J. 2008;54:606–611. doi: 10.1097/MAT.0b013e31818c69ab. [DOI] [PubMed] [Google Scholar]
- 28.Colacino FM, De Bartolo C, Fragomeni G, Wang D, De Napoli L, Zwischenberger J. Numerical and Experimental Flow Analysis of the Wang-Zwische Double-Lumen Cannula. ASAIO J. 2009;55:174. doi: 10.1097/MAT.0b013e31821c08bc. [DOI] [PubMed] [Google Scholar]
- 29.Schmid C, Jurmann M, Birnbaum D, et al. Influence of Inflow Cannula Length in Axial-flow Pumps on Neurologic Adverse Event Rate: Results From a Multi-center Analysis. J Heart Lung Transplant. 2008;27:253–260. doi: 10.1016/j.healun.2007.12.007. [DOI] [PubMed] [Google Scholar]
- 30.Ootaki Y, Saeed D, Ootaki C, Akiyama M, Fumoto H, Horai T. Development of the DexAide right ventricular assist device inflow cannula. ASAIO J. 2008;54:31–36. doi: 10.1097/MAT.0b013e31815b3ea4. [DOI] [PubMed] [Google Scholar]
- 31.Roache PJ. Quantification of Uncertainty in Computational Fluid Dynamics. Annu Rev Fluid Mech. 1997;29:123–160. [Google Scholar]
- 32.Roache PJ. Perspective: A method for uniform reporting of grid refinement studies. J Fluid Eng - T ASME. 1994;116:405–413. [Google Scholar]
- 33.Zhang Y, Hu SSH, Zhou JY, et al. In Vivo Experimental Testing of the FW Axial Blood Pump for Left Ventricular Support In Fu Wai Hospital. ASAIO J. 2009;55:28–32. doi: 10.1097/MAT.0b013e31818f592f. [DOI] [PubMed] [Google Scholar]
- 34.Alemu Y, Bluestein D. Flow Induced Platelet Activation and Damage Accumulation in a Mechanical Heart Valve: Numerical Studies. Artif Organs. 2007;31:677–688. doi: 10.1111/j.1525-1594.2007.00446.x. [DOI] [PubMed] [Google Scholar]
- 35.Gonzalez HA, Moraga NO. On predicting unsteady non-Newtonian Blood flow. App Math Comput. 2005;170:909–923. [Google Scholar]
- 36.Fung YC. Biomechanics: Mechanical Properties of Living Tissues. 2. Berlin: Springer; 1993. [Google Scholar]


