

Abstract
Aims
Risk stratification of patients presenting to the emergency department (ED) with suspected cardiac chest pain (CP) and an undifferentiated electrocardiogram (ECG) is difficult. We hypothesized that in these patients a risk score incorporating clinical, ECG, and myocardial contrast echocardiography (MCE) variables would accurately predict adverse events occurring within the next 48 hours.
Methods and Results
Patients with CP lasting for ≥30 min who did not have ST segment elevation on the ECG, were enrolled. Regional function (RF) and myocardial perfusion (MP) were assessed by MCE. A risk model was developed in the initial 1166 patients (cohort 1), and validated in subsequent 720 patients (cohort 2). Any abnormality or ST changes on ECG (OR 2.5, 95% CI:1.4–4.5, p=0.002, and OR 2.9, 95% CI:1.7–4.8, p<0.001, respectively), abnormal RF with normal MP (OR 3.5, 95% CI:1.8–6.5, p<0.001), and abnormal RF with abnormal MP (OR 9.6, 95% CI:5.8–16.0, p<0.001) were found to be significant multivariate predictors of non-fatal myocardial infarction or cardiac death. The estimate of the probability of concordance for the risk model was 0.82 for cohort 1 and 0.83 for cohort 2. The risk score in both cohorts stratified patients into 5 distinct risk groups with event rates ranging from 0.3% to 58%.
Conclusions
A simple predictive instrument has been developed from clinical, ECG, and MCE findings obtained at the bedside that can accurately predict events occurring within 48 hours in patients presenting to the ED with suspected cardiac CP and an ECG that is not diagnostic for acute ischemic injury. Its application could enhance care of CP patients in the ED. For instance, patients with a risk score of 0 could be discharged from the ED without further work-up. However, this needs to be validated in a multi-center study.
Keywords: chest pain, emergency department, myocardial contrast echocardiography
Introduction
Despite technological advances over the past few decades, patients who present to the emergency department (ED) with chest pain (CP) and an electrocardiogram (ECG) non-diagnostic for acute ischemic injury, continue to remain a diagnostic challenge1,2. Because of anti-platelet and other therapy, even patients even who are experiencing an acute myocardial infarction (AMI) are now less likely to present to the ED with a diagnostic ECG3. Moreover, CP patients today are more likely to have unstable angina pectoris (UAP) rather than an AMI.
Current management of such patients involves either admission to the hospital or observation in a CP unit in the ED, where the ECG is periodically repeated and blood samples are acquired to measure biomarkers that indicate myocardial injury4. In the United States the majority of these 5 million or so patients seen in the ED annually are discharged after myocardial injury is ruled out, which costs the nation approximately $10 billion annually.
We and others have previously demonstrated the value of echocardiography (without and with contrast) in the detection of AMI and other acute coronary syndromes (ACS) in the ED as well as the prognostic utility of this tool to predict long-term outcome5–9. In this study we hypothesized that a predictive instrument could be developed from clinical, ECG, and myocardial contrast echocardiography (MCE) findings obtained at the bedside that would accurately predict events occurring within 48 hours in patients presenting to the ED with suspected cardiac CP and a non-diagnostic ECG. We developed the instrument from variables derived from a cohort of patients undergoing these tests and then tested its accuracy in a subsequent cohort who also underwent the same tests in the same ED.
Methods
Study Sample and protocol
This prospective study was approved by the Human Investigation Committee. Patients presenting to the ED with a complaint of CP not easily attributable to a non-cardiac cause (such as chest wall pain or pulmonary pathology), and who did not have ST segment elevation on the ECG, were approached for enrollment. The inclusion criteria were age >30 yr and CP lasting for at least 30 min and occurring within 12 h of ED admission. Patients with a history of prior MI were not excluded from the study. All patients provided written informed consent. After the history was obtained and physical examination was performed by a cardiologist, ECG, blood samples, and MCE were obtained sequentially. ECG and blood samples were repeated every 6 h as needed. MCE results (RF or MP) were not shared with the ED physician, who admitted or discharged the patient based on routine criteria (clinical, ECG and cardiac serum biomarkers).
The predictive instrument was developed in an initial cohort (cohort 1), and prospectively tested in a subsequent cohort (cohort 2) that was sequentially recruited. A different contrast agent (Definity) was used in cohort 2 because the agent used in cohort 1 (Optison) was no longer available at that time.
Electrocardiography
The initial 12-lead ECG was interpreted by an observer blinded to all other information. It was either classified as normal or abnormal. For the latter it was further characterized as having: ST segment abnormality or T-wave inversion, left ventricular hypertrophy (with or without strain), conduction abnormality, and arrhythmia. Pathological Q waves in 2 or more contiguous leads indicated prior MI.
Echocardiography
Echocardiography was performed using a Sonos 5500 system (Philips Ultrasound). In cohort 1, 3 mL of Optison (GE Healthcare) was diluted in 60 mL of normal saline and infused intravenously at a rate of 3 mL·min−1 using a model AS40A pump (Baxter Healthcare). In cohort 2, 1.5 mL of Definity (Lantheus Imaging) was diluted in 28.5 mL of normal saline and infused at a rate of 1.5 mL·min−1 using the same pump.
The infusion rate was adjusted so as to obtain homogeneous left ventricular cavity opacification with shadowing limited only to the left atrium in the apical views. Images were first acquired for regional function (RF) analysis in the apical and parasternal views using low (<0.3) mechanical index (MI). Myocardial perfusion (MP) images were then obtained using high (1.0) MI intermittent imaging (ultrasound transmission gated to end-systole) with transmit/receive frequencies of 1.3/3.6 MHz. Ultrasound compression was set at 75%. If tissue signal was seen despite optimization of imaging settings, high MI intermittent power Doppler imaging was performed to eliminate the tissue signal. All settings were optimized at the beginning of the study and then held constant. Image acquisition was completed in <10 min.
MP images were acquired in apical 2-, 3-, and 4-chamber views at pulsing intervals (PI’s) of 1,2,3,4, and 5 cardiac cycles. The transmit focus was initially set at the level of the mitral valve, but was adjusted to the apex if an apical defect was seen in order to discriminate between a true defect and an artifact. RF and MP data were stored separately on magneto-optical disk.
Image interpretation
For cohort 1, RF and MP images were read separately by experienced observers blinded to all other information. These were scored as normal or abnormal using a 14-segment model covering the 3 coronary territories (Figure 1)10. MP was scored as abnormal if maximal myocardial opacification was not seen within a segment by 5 cardiac cycles. RF was scored as either 0=normal, 1=hypokinesia, 2=akinesia, or 3=dyskinesia. Studies were classified as normal if RF or MP in the visualized segments within every perfusion territory were normal. Studies were called abnormal if RF or MP was abnormal in 1 or more territories (usually multiple segments), even if all segments were not visualized. If a study could not be classified as above, it was deemed not assessable. For cohort 2, the MP study was evaluated immediately following interpretation of RF, and each of the 14 myocardial segments was scored as either normal or abnormal based on the combination of RF and MP results.
Figure 1.
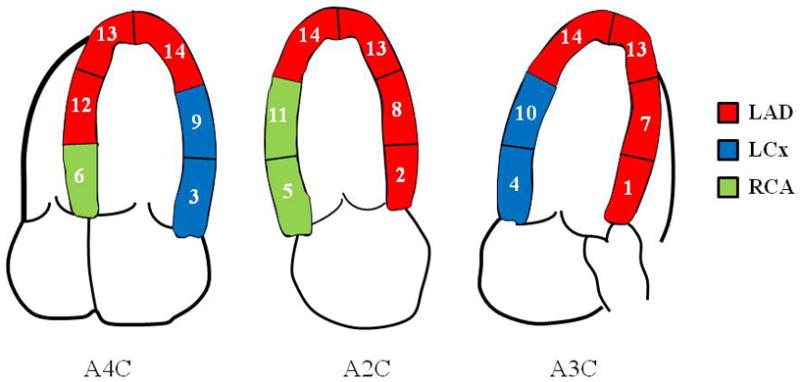
The 14-segment myocardial model for regional function and myocardial perfusion analyses. Individual segments were grouped into 3 coronary territories. See text for details.
Statistical Methods
We used the ‘hard’ events of nonfatal AMI and cardiac-related death occurring within 48 h of ED admission for analysis. AMI was defined by an abnormal Troponin I level (≥0.6 ng·mL−1). All patients who were admitted to hospital after enrollment were followed up in person prior to discharge, and their medical records were reviewed. Follow-up of discharged patients was obtained with a direct telephone call to each patient, or the patient’s primary physician. All reported events were confirmed by review of medical records or death certificate.
Logistic regression was used to model the relationship between events and predictor variables in cohort 1. We first found the best model excluding MCE and then examined the added contribution made by MCE. To define the best model excluding MCE, all variables that had p-values <0.20 on univariate analyses were entered in a backward selection routine. Variables sequentially selected for removal were based on a significance level of 0.05. Following this initial selection of variables, original variables not selected were entered one at a time to the backward selection model to determine significance in the presence of the other variables. Any variable significant at p≤0.05 was then included in the final model. We used the same technique to find the best overall model including MCE.
The Pearson goodness-of-fit statistic was obtained to assess the fit of the model. The c-index, a measure of concordance between the predicted probabilities from the final logistic regression model and the observed responses, was calculated as an assessment of the predictive ability of the model11. A bootstrap estimate of the c-index for the final model corrected for over-optimism was obtained using 1000 bootstraps12. A c-index was then obtained for cohort 2 using the final model derived from cohort 1. In addition a simple risk score, created using the logistic regression model from cohort 1, was validated in cohort 2. The contribution of a risk factor to the risk score for an individual was based on the regression coefficient for that risk factor. These coefficients were rounded to the nearest integer, so that a risk factor would contribute 0, 1, or 2 points to the summary score. Risk estimates were obtained as simple proportions and the exact (Clopper-Pearson) confidence intervals were used for binomial data.
Results
Patient Cohorts
A total of 2045 patients were studied. The first 1282 patients receiving Optison were assigned to cohort 1. Of these MP imaging was not performed in 34 due to lack of feasibility (usually a technical problem such as interstitial infiltration of the intravenous fluid) and it was not interpretable in another 78 (80% of cases due to attenuation over the mid and basal lateral segments). Three additional patients had missing ECG’s and 1 was omitted from analysis due to non-cardiac death. Those excluded from analysis were more likely to be male, (67% vs 54%), to smoke (84% vs 66%), and to have hypercholesterolemia (63% vs 52%), diabetes (40% vs 28%) and coronary artery disease (CAD, 41% vs 28%). The latter was based on a patient’s reported history and not on review of coronary angiography. Patients had prior MI confirmed by EKG.
The second 763 patients receiving Definity were assigned to cohort 2. Of these, MP imaging was not performed in 22 due to lack of feasibility and was non-interpretable in 19. Two additional patients had missing ECG’s. There were more males among those with missing data (72% vs 57%). No patient in either cohort had un-interpretable RF studies because of excellent endocardial border delineation.
Thus, 1166 patients from cohort 1 and 720 patients from cohort 2 form the basis of this report and their baseline characteristics are listed in Table 1. The cohort 1 patients had a higher incidence of hypercholesterolemia, family history of CAD, history of smoking, and abnormal RF on MCE, while the cohort 2 patients had a higher incidence of diabetes mellitus and an abnormal ECG.
Table 1.
Baseline Characteristics
| Variables | Cohort 1 (n=1166) | Cohort 2 (n=720) | p-value |
|---|---|---|---|
| Age¶ | 59.8 ±13.6 | 57.9±13.3 | 0.003 |
| Male (%) | 624 (54%) | 409 (57%) | 0.163 |
| African-American (%) | 267 (23%) | 168 (23%) | 0.828 |
| History of Hypertension (%) | 756 (65%) | 437 (61%) | 0.070 |
| History of Hypercholesterolemia¥ | 607(52%) | 290 (40%) | <0.001 |
| History of Diabetes Mellitus | 324 (28%) | 280 (39%) | <0.001 |
| Family History of CAD¥ | 546 (47%) | 290 (40%) | 0.006 |
| History of smoking (%)¥ | 768 (66%) | 327 (45%) | <0.001 |
| Documented CAD | 328(28%) | 233 (32%) | 0.052 |
| Prior Myocardial Infarction | 88 (10%) | 22(7%) | 0.078 |
| Abnormal ECG (%) | 716 (61%) | 501 (70%) | <0.001 |
| ST-T changes on ECG (%) | 99 (8%) | 69 (10%) | 0.420 |
| RF & MP | <.001 | ||
| Abnormal RF & Abnormal MP | 315 (27%) | 128 (18%) | |
| Abnormal RF & Normal MP | 172 (15%) | 57 (8%) | |
| Normal RF & Normal MP | 679 (58%) | 535 (74%) |
Key: CAD = Coronary artery disease, ECG = Electrocardiogram, RF = Regional function, MP = Myocardial perfusion
expressed as mean ± standard deviation
1 missing value for these variables in cohort 2
Patient Outcomes and Development of Risk Model
Of the 1166 cohort 1 patients, 142 (12%) had an event (138 had AMI, 4 had AMI followed by death). In these patients, the initial troponin was 0.8±52 (<0.08–470) and the peak troponin was 34±71 (0.61–470). Univariate predictors that were considered for incorporation into the risk model included age, sex, the presence of cardiac risk factors (hypertension, hypercholesterolemia, diabetes, family history of early CAD, current or history of smoking), race (African American versus all others), ST-T changes on ECG, any abnormality on ECG, abnormal RF and abnormal MP. When excluding MCE, our selection procedure produced a model that included diabetes status (p=.011), sex (p=.004), ST-T changes on ECG (p<.001), and any abnormality on ECG (p<.001). We then included MCE to obtain its incremental utility. The Pearson goodness of fit statistic for this model yielded a p-value of 0.48, suggesting a reasonable fit.
Table 2 shows the odds ratios along with the regression coefficients associated with each variable in this logistic regression model for cohort 1. In particular adding MCE to the model resulted in a significant incremental contribution (p<0.001). Abnormal RF and MP were both significant predictors of outcome. When both were abnormal, the odds of having an event was 9.0 times greater than when both were normal (95% CI:5.4–14.9, p<0.001). Other significant multivariate predictors of events included the presence of ST-T changes on ECG (not ST elevation, since patients with this finding were not included in the study), having any abnormality on the ECG, and the presence of abnormal RF even when MP was normal. The c-index for prediction of adverse outcome based on sex and diabetes was 0.61. When including sex, diabetes, ST-T changes and any abnormality on ECG, the c-index was significantly higher (0.74, p<0.001). With the addition of MCE, the c-index increased further (0.83, p<0.001). The optimism of this estimator based on results from 1000 bootstrap samples using this final model was only 0.006, and hence the bootstrap optimism-corrected estimate of the measure of concordance was also 0.82. When the non-significant variables, diabetes and sex, were removed from this model, the c-index remained at 0.82 and the remaining odds ratios changed only slightly and remained highly significant (Table 3) This simpler model can also be obtained via backward selection with all candidate variables (including MCE) used in the first step. We focused on this more parsimonious model for risk prediction and validation.
Table 2.
Logistic Regression Model to Assess the Incremental Utility of MCE for Event Prediction in Cohort 1.
| Predictors | Odds- Ratio | 95% Confidence Interval | Regression Coefficient | p- value |
|---|---|---|---|---|
| Abnormal ECG relative to Normal ECG | 2.4 | (1.4, 4.3) | 0.9 | 0.003 |
| ST-T changes relative to no ST-T changes | 2.9 | (1.7, 4.8) | 1.1 | <0.001 |
| RF abnormal but MP normal relative to both normal | 3.4 | (1.8, 6.4) | 1.2 | <0.001 |
| RF and MP abnormal relative to both normal | 9.0 | (5.4, 14.9) | 2.2 | <0.001 |
| Diabetic relative to non- diabetic | 1.31 | (0.9,2.0) | 0.1 | 0.190 |
| Females relative to males | 0.72 | (0.5,1.1) | −0.2 | 0.119 |
Key: ECG =Electrocardiogram, ST-T = ST segments or T-wave on ECG. RF = Regional function, MP = Myocardial perfusion
Table 3.
Final Logistic Regression Model for Event Prediction in Cohort 1
| Predictors | Odds- Ratio | 95% Confidence Interval | Regression Coefficient | p- value |
|---|---|---|---|---|
| Abnormal ECG relative to Normal ECG | 2.5 | (1.4, 4.4) | 0.9 | 0.002 |
| ST-T changes relative to no ST-T changes | 2.9 | (1.7, 4.8) | 1.1 | <0.001 |
| RF abnormal but MP normal relative to both normal | 3.5 | (1.8, 6.6) | 1.2 | <0.001 |
| RF and MP abnormal relative to both normal | 9.7 | (5.8, 16.0) | 2.3 | <0.001 |
Key: ECG =Electrocardiogram, ST-T = ST segments or T-wave on ECG. RF = Regional function, MP = Myocardial perfusion
In order to create a simple, clinically useful risk model, a risk score was assigned for each individual based on the logistic regression coefficients given in Table 3. Each of the regression coefficients for these variables was rounded to the nearest integer so that a subject would receive 1 point each for having: non-specific ST-T changes on the ECG, any abnormality on the ECG, abnormal RF, or abnormal MP. The final risk score then counts the number of abnormalities among the four component tests. In particular if both RF and MP were abnormal, then RF and MP would together contribute a score of 2 to the risk score. Each individual would hence receive an integer score ranging from 0, if there were no abnormalities, to 4, when each of any ECG changes, ST-T changes, RF and MP was abnormal. Patients were subdivided into 5 groups based on their risk score (0 to 4). Figure 2 shows the distribution of risk scores for patients in cohort 1, along with their respective event rates and the average of the predicted probabilities from the logistic regression model. A good separation in event rates is shown.
Figure 2.
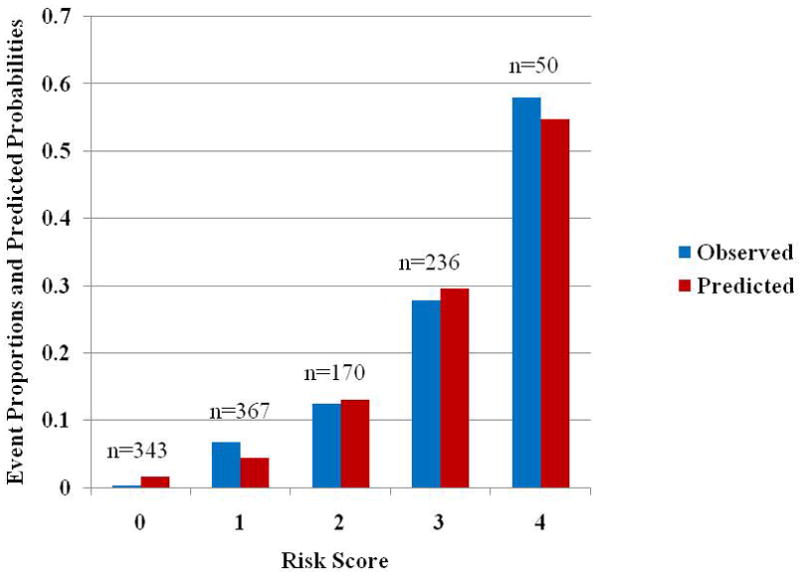
Proportion of cohort 1 patients with a cardiac event and average of predicted probabilities for a cardiac event based on logistic regression model. The numbers above each pair of bars indicate the number of individuals with that risk score. Abbreviations: obs=observed proportion, pre=average of predicted probabilities from model.
Prospective Testing of the Risk Model
In cohort 2, 74 of the 720 (10%) patients had an AMI and no patient died. For these patients, the initial troponin was 0.7±12 (<0.08–97) and the peak troponin was 12 ± 20 (0.64–114). Similar to cohort 1, sex, diabetes, and ST-T changes or any abnormality on ECG was associated with a c-index of 0.73 for the prediction of an adverse cardiac outcome and the model was significantly (p<0.001) improved with the addition of RF and MP data. With the addition of MCE, the regression model constructed from cohort 1 resulted in a c-index of 0.83 when used for prediction in cohort 2 and remained unchanged when sex and diabetes were eliminated from the model, indicating that the simpler model predicted events in cohort 2 equally as well as in cohort 1.
Figure 3 shows the distribution of risk scores for patients in cohort 2, along with their respective event rates and average predicted probabilities using the simple risk model developed from cohort 1. The results are analogous to those found in cohort 1, with a clear separation in event rates between patients in the different risk groups. Patients who had a risk score of 0 had a very low incidence of events (0.5%), which escalated to an event rate of 50% for those with a risk score of 4. Finally, combining both cohorts, estimated risks and associated 95% confidence intervals corresponding to each risk score category are given in Table 4 based on all individuals, and separately based only on individuals without prior MI. Removing patients with prior MI does not substantially change the results.
Figure 3.
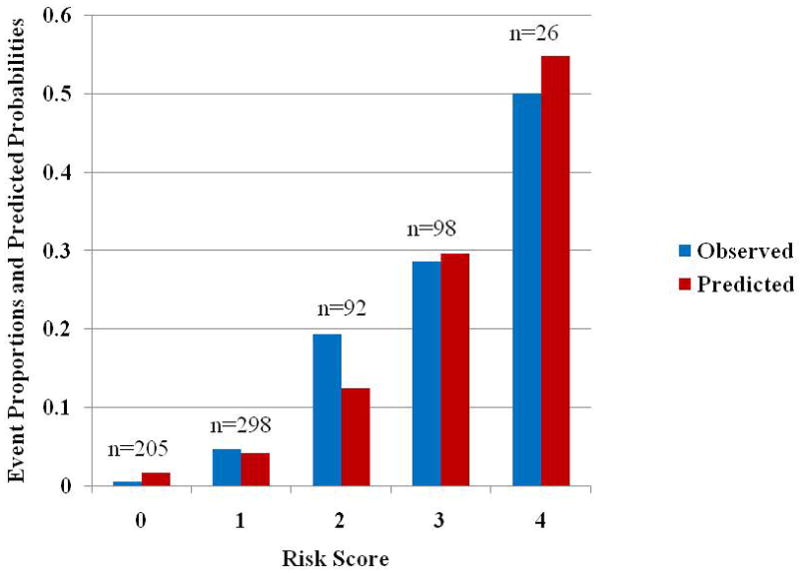
Proportion of cohort 2 patients with a cardiac event and average of predicted probabilities for a cardiac event based on logistic regression model. The numbers above each pair of bars indicate the number of individuals with that risk score. Abbreviations: same as in Figure 2.
Table 4.
Risk scores, Estimated risks and 95% CI Combining Both Cohorts.
| Risk score | Estimated Risk of Cardiac Event Number with Risk Score (95% Confidence Interval) Full cohort | Estimated Risk of Cardiac Event Number with Risk Score (95% Confidence Interval) Without Prior MI |
|---|---|---|
| 0 | 0.4% 546 (0.04%, 1.3%) |
0.4% 545 (0.04%, 1.3%) |
| 1 | 5.8% 667 (4.2%, 7.9%) |
4.8% 291 (2.7%, 7.9%) |
| 2 | 14.9% 262 (10.8%, 19.8%) |
18.1% 138 (12.1%, 25.6%) |
| 3 | 28.1% 335 (23.3%, 33.2%) |
22.5% 120 (15.4%, 31.0%) |
| 4 | 55.3% 76 (43.4%, 66.7%) |
65.5% 29 (45.7%, 82.1%) |
Discussion
Predictive instruments have been described previously for patients presenting to the ED with CP13,14. Most of these have relied solely on clinical and ECG variables. Despite both clinical features and the initial resting ECG not being reliable at identifying patients at risk for adverse events, they remain the mainstay of CP patient triage and management in the ED. Attempts have been made to use cardiac biomarkers to develop risk models, but even if available rapidly, it may take hours for them to become positive. We have previously shown that the assessment of RF and MP by echocardiography can immediately identify patients at different risk levels and that they provide better risk stratification than even biomarkers9. In this study we have shown for the first time that by incorporating MCE with ECG findings in a simple model, we can provide immediate risk stratification at the bedside in CP patients without a an ECG diagnostic for acute myocardial injury. It is reasonable to assume that this early risk stratification will also influence timely therapy as well as ED discharge.
Acute CP is the most common symptom of patients presenting to the ED, and the evaluation of these patients remains a clinical challenge. Due to the high morbidity and mortality associated with cardiovascular causes of CP such as AMI, aortic dissection, and pulmonary embolism, a workup to distinguish and exclude these diagnoses is usually undertaken. Even though cardiac CP is the most common “serious” etiology in these patients, an ACS is diagnosed in only 10–30% of them15–17. In the Acute Cardiac Ischemia Time-Insensitive Predictive Instrument (ACP-TIPI) study that included 10,689 patients presenting with symptoms suggestive of acute ischemia - an ACS was diagnosed in only 17% (AMI in 8% and UAP in 9%). The majority of patients (55%) were diagnosed with non-cardiac problems18. Looking for the “needle in the haystack” is encumbered by the poor sensitivity and specificity of the history, physical exam, and ECG findings for AMI.
The inability to rapidly diagnose and risk stratify patients makes their triage to an adequate location for care difficult (hospital ward versus step-down unit versus coronary care unit versus discharge from the ED), or to determine those who could benefit the most from aggressive therapy. Many reports have focused on only a single variable (such as ECG abnormalities or elevated serum cardiac markers)13,14,19–21, and subsequent reports have found them to be unreliable. Despite major advances in imaging technology and many reports indicating the benefits of MP imaging (whether echocardiography5–9 or single photon emission computed tomography22–24) in such patients, their use is limited only to institutions where there is a strong collaboration between the ED and cardiovascular medicine.
Another easily derived bedside risk score, the TIMI risk score25 that incorporates clinical, ECG and biomarker variables, has been shown to successfully categorize patients with suspected ACS into different risk subsets. We have previously shown that patients with a low modified TIMI score (excluding biomarkers which are not available at time of ED presentation) have a substantial event rate within 24 hours of ED presentation9. Thus, even the TIMI risk score remains inadequate until biomarker data either become available or are conclusive, which could take many hours after a patient’s ED presentation. We also found that the biomarkers did not add any further prognostic information once MCE data were already known9. Furthermore, the negative predictive value of a normal MCE remains extremely high even when MCE is performed up to 12 hours after a patient’s last episode of CP26.
In this study MCE results (both MP and RF) were blinded from the physicians taking care of the patients, and did not affect their disposition. Based on clinical criteria, 67% of patients were admitted to the hospital. Another 28% were kept in the ED chest pain unit for a complete rule out (at least 2 negative cTNI determinations at least 8 hours apart). Thus, only 5% of patients were discharged directly from the ED, usually after a single negative cTNI. This reflects current clinical practice where virtually no patient with suspected cardiac chest pain is discharged prior to a full rule-out, which is precisely the reason why a cost-effective means to rule out ACS could decrease unnecessary hospital admissions or prolonged ED observation.
In this study, we tested the incremental value of variables that are available as soon as a patient presents to the ED to predict events. Patient sex and the history of diabetes were significant demographic predictors of events. ST-T wave changes or any abnormality on ECG added significantly to the predictive ability of demographic variables. When we then examined the incremental value of MCE, both abnormal RF and abnormal MP were identified as significant independent predictors. After adding MCE, sex and history of diabetes no longer remained significant predictors. These findings of incremental value of tests performed in a hierarchical order are similar to our previous observations6,8,9.
Because MCE is portable, and does not require image post-processing, RF and MP results can be made available to the managing physician immediately after data acquisition as long as MCE can be performed expediently. Therefore, all the variables in our risk score can be obtained with little delay allowing complete risk stratification at the bedside and early disposition. But this does entail availability of a person trained to perform MCE and the same or another person trained to interpret it. This investment needs to be made for better managing patients in the ED with CP.
In the current cost-contained healthcare environment, it is important to evaluate the impact of additional imaging for all patients presenting with CP. We have shown that MCE can be cost-effective in these patients because it can be used to decrease down-stream resource utilization. Patients with a normal MCE have a very low risk of adverse outcome, and can be discharged expediently from the ED. By preventing unnecessary admissions to the hospital and stress testing of low-risk patients for ACS, utilization of MCE can decrease cost by approximately $900 per patient27. In the current analysis, patients who had a risk score of “0” (28% of the validation cohort) had an extremely low early event rate (0.5%), so these patients could all potentially have been discharged immediately after their MCE from the ED. This approach will need further study for confirmation.
Study Limitations
The evaluation of RF abnormalities on echocardiography is subjective. It is imperative for studies to be of high quality and all myocardial segments to be well delineated – all RF studies were therefore performed with ultrasound contrast agents. Ultrasound contrast agents have been shown to improve visualization of endocardial borders, image quality, reader confidence, and observer agreement28–30. Although these agents are used in many medical centers for RF assessment, they are not used that frequently for MP assessment. The training of sonographers and echocardiographers would be required to reproduce the results reported here. In the majority of patients in whom MP assessment is not feasible, RF assessment could suffice. Because of the subjective nature of interpretation, mild perfusion/function mismatch could be missed. Further, as stated earlier, a greater commitment of cardiologists would be necessary to take on the responsibility in assisting in patient triage in the ED, something that has been successfully implemented in our institution.
Despite differences between the 2 cohorts the ability of the model to predict events was similar for both cohorts, which attests to its general applicability. Also the use of either Optison or Definity did not seem to affect the results as long as the imaging methodology remained constant.
Conclusions
The management of patients with suspected cardiac CP who do not have ST-segment elevation on the ECG remains suboptimal. Risk stratification of patients with suspected ACS is often delayed pending the results of serial serum cardiac biomarkers. We have developed a model, using variables that can be obtained at the patient’s bedside, with little delay, to assist in rapidly risk stratifying patients presenting with suspected cardiac CP and a non-diagnostic EKG to an ED. The application of this model in the ED could significantly enhance management of CP patients in the ED.
Acknowledgments
Supported in part by grants to Dr. Kaul from the National Institutes of Health, Bethesda, Maryland (R01-HL-65704 and R01 EB-002069) and the American Society of Echocardiography, Raleigh, North Carolina. The ultrasound contrast agents were provided by GE Healthcare, Milwaukee, Wisconsin, and Lantheus Imaging, North Billerica, Massachusetts.
Footnotes
Publisher's Disclaimer: This is a PDF file of an unedited manuscript that has been accepted for publication. As a service to our customers we are providing this early version of the manuscript. The manuscript will undergo copyediting, typesetting, and review of the resulting proof before it is published in its final citable form. Please note that during the production process errors may be discovered which could affect the content, and all legal disclaimers that apply to the journal pertain.
References
- 1.Pope JH, Aufderheide TP, Ruthazer R, Wolard RH, Feldman JA, Beshansky JR, et al. Missed diagnosis of acute cardiac ischemia in the emergency department. N Eng J Med. 2000;342:1163–1170. doi: 10.1056/NEJM200004203421603. [DOI] [PubMed] [Google Scholar]
- 2.McCarthy BD, Beshansky JR, D’Agostino RB, Selker HP. Missed diagnoses of acute myocardial infarction in the emergency department: results from a multicenter study. Ann Emerg Med. 1993;22:579–582. doi: 10.1016/s0196-0644(05)81945-6. [DOI] [PubMed] [Google Scholar]
- 3.Forest RS, Shofer FS, Sease KL, Hollander JE. Assessment of the standardized reporting guidelines ECG classification system: the presenting ECG predicts 30 day outcomes. Ann Emerg Med. 2004;44:206–21. doi: 10.1016/j.annemergmed.2004.02.031. [DOI] [PubMed] [Google Scholar]
- 4.Anderson JL, Adams CD, Antman EM, Bridges CR, Califf RM, Casey DE, Jr, et al. ACC/AHA 2007 guidelines for the management of patients with unstable angina/non-ST-elevation myocardial infarction: a report of the American College of Cardiology/American Heart Association Task Force on practice guidelines (Writing committee to Revise the 2002 Guidelines for the Management of Patients with Unstable Angina/Non-ST-Elevation Myocardial Infarction): developed in collaboration with the American College of Physicians, Society for Academic Emergency Medicine, Society for Cardiovascular Angiography and Interventions, and Society of Thoracic Surgeons. J Am Coll Cardiol. 2007;50:e1–157. doi: 10.1016/j.jacc.2007.02.013. [DOI] [PubMed] [Google Scholar]
- 5.Kontos MC, Arrowood JA, Paulsen WH, Nixon JV. Early echocardiography can predict cardiac events in emergency department patients with chest pain. Ann Emerg Med. 1998;31:550–57. doi: 10.1016/s0196-0644(98)70200-8. [DOI] [PubMed] [Google Scholar]
- 6.Sabia P, Abbott RD, Afrookteh A, Keller MW, Touchstone DA, Kaul S. Importance of two-dimensional echocardiographic assessment of left ventricular systolic function in patients presenting to the emergency room with cardiac-related symptoms. Circulation. 1991;84:1615–24. doi: 10.1161/01.cir.84.4.1615. [DOI] [PubMed] [Google Scholar]
- 7.Kontos MC, Kurdziel K, McQueen R, Arrowood JA, Jesse RL, Ornato JP, et al. Comparison of 2-dimensional echocardiography and myocardial perfusion imaging for diagnosing myocardial infarction in emergency department patients. Am Heart J. 2002;143:659–67. doi: 10.1067/mhj.2002.120777. [DOI] [PubMed] [Google Scholar]
- 8.Rinkevich D, Kaul S, Wang XQ, Tong KL, Belcik T, Kalvaitis S, et al. Regional left ventricular perfusion and function in patients presenting to the emergency department with chest pain and no ST-segment elevation. Eur Heart J. 2005;26:1606–11. doi: 10.1093/eurheartj/ehi335. [DOI] [PubMed] [Google Scholar]
- 9.Tong KL, Kaul S, Wang XQ, Rinkevich D, Kalvaitis S, Belcik T, et al. Myocardial contrast echocardiography versus Thrombolysis In Myocardial Infarction score in patients presenting to the emergency department with chest pain and a nondiagnostic electrocardiogram. J Am Coll Cardiol. 2005;46:920–27. doi: 10.1016/j.jacc.2005.03.076. [DOI] [PubMed] [Google Scholar]
- 10.Dawson D, Rinkevich D, Belcik T, Jayaweera AR, Rafter P, Kaul S, et al. Measurement of Myocardial Blood Flow Velocity Reserve with Myocardial Contrast Echocardiography in Patients with Suspected Coronary Artery Disease: Comparison with Quantitative gated 99mTc Sestamibi SPECT. J Am Soc Echocardiogr. 2003;16:1171–1177. doi: 10.1067/S0894-7317(03)00646-1. [DOI] [PubMed] [Google Scholar]
- 11.Harrell FE, Lee KL, Mark DB. Tutorial in Biostatistics Multivariage Prognostic Models: Issues in Developing Models, Evaluating Assumptions and Adequacy, and Measuring and Reducing Errors. Stat Med. 1996;15:361–383. doi: 10.1002/(SICI)1097-0258(19960229)15:4<361::AID-SIM168>3.0.CO;2-4. [DOI] [PubMed] [Google Scholar]
- 12.Efron B. Estimating the error rate of a prediction rule: Improvement on cross-validation. Improvement on cross-validation. J Am Stat Asso. 1983;78:316–331. [Google Scholar]
- 13.Selker HP, Beshansky JR, Griffith JL, Aufderheide TP, Ballin DS, Bernard SA, et al. Use of the acute cardiac ischemia time-insensitive predictive instrument (ACI-TIPI) to assist with triage of patients with chest pain or other symptoms suggestive of acute cardiac ischemia. A multicenter, controlled clinical trial. Ann Int Med. 1998;129:845–855. doi: 10.7326/0003-4819-129-11_part_1-199812010-00002. [DOI] [PubMed] [Google Scholar]
- 14.Selker HP, Zalenski RJ. An evaluation of technologies for detecting acute cardiac ischemia in the emergency department: a report of the NIH national heart attack alert program. Ann Emerg Med. 1997;29:1–87. doi: 10.1016/s0196-0644(97)70298-1. [DOI] [PubMed] [Google Scholar]
- 15.Strussman BJ. National Hospital Ambulatory Medicine Care Survey: 1995 Emergency Department Summary. Advance data from vital and health statistics of the Center for Disease Control Prevention/National Center for Health Statistics. 1997;285:1–18. [Google Scholar]
- 16.Gilber WB, Lewis LM, Erb RE, Markens PK, Kaplan BC, Vaughn RH, et al. Early detection of acute myocardial infarction in patients presenting with chest pain and non-diagnostic ECGs: serial CK-MB sampling in the emergency department. Ann Emerg Med. 1990;9:1359–1366. doi: 10.1016/s0196-0644(05)82598-3. [DOI] [PubMed] [Google Scholar]
- 17.Gilber WB, Young CP, Hedges JR, Lewis LM, Smith MS, Carleton SC, et al. Acute myocardial infarction in chest pain patients with non-diagnostic ECG’s: serial CK-MB sampling in the emergency department. Ann Emerg Med. 1992;21:504–512. doi: 10.1016/s0196-0644(05)82515-6. [DOI] [PubMed] [Google Scholar]
- 18.Cohen M, Hawkins L, Greenberg S, Fuster V. Usefulness of ST-segment changes in greater than or equal to 2 leads on the emergency room electrocardiogram in either unstable anginal pectoris or non-Q-wave myocardial infarction in predicting outcome. Am J Cardiol. 1991;67:1368–1373. doi: 10.1016/0002-9149(91)90467-y. [DOI] [PubMed] [Google Scholar]
- 19.Nyman I, Areskog M, Areskog NH, Swahn E, Wallentin L. Very early risk stratification by electrocardiogram at rest in men with suspected unstable coronary heart disease. J Intern Med. 1993;234:293–301. doi: 10.1111/j.1365-2796.1993.tb00746.x. [DOI] [PubMed] [Google Scholar]
- 20.Antman EM, Tanasijevic MJ, Thompson B, Schactman M, McCabe CH, Cannon CP, et al. Cardiac-specific troponin I levels to predict the risk of mortality in patients with acute coronary syndromes. N Engl J Med. 1996;335:1342–1349. doi: 10.1056/NEJM199610313351802. [DOI] [PubMed] [Google Scholar]
- 21.Luscher MS, Thygesen K, Ravkilde J, Heickendorff L for the TRIM Study Group. Applicability of cardiac troponoin T and I for early risk stratification in unstable coronary artery disease. Circulation. 1997;96:2578–2585. doi: 10.1161/01.cir.96.8.2578. [DOI] [PubMed] [Google Scholar]
- 22.Kontos MC, Jesse RL, Anderson FP, Schmidt KL, Ornato JP, Tatum JL. Comparison of myocardial perfusion imaging and cardiac troponin I in patients admitted to the emergency department with chest pain. Circulation. 1999;99:2073–2078. doi: 10.1161/01.cir.99.16.2073. [DOI] [PubMed] [Google Scholar]
- 23.Conti A, Gallini C, Costanzo E, Ferri P, Matteini M, Paladini B, et al. Early detection of myocardial ischaemia in the emergency department by rest or exercise 99mTc tracer myocardial SPET in patients with chest pain and non-diagnostic ECG. Eur J Nucl Med. 2001;28:1806–1810. doi: 10.1007/s002590100647. [DOI] [PubMed] [Google Scholar]
- 24.Udelson JE, Beshansky JR, Ballin DS, Feldman JA, Griffith JL, Handler J, et al. Myocardial perfusion imaging for evaluation and triage of patients with suspected acute cardiac ischemia: a randomized controlled trial. JAMA. 2002;288:2693–2700. doi: 10.1001/jama.288.21.2693. [DOI] [PubMed] [Google Scholar]
- 25.Antman E, Cohen M, Bernink PJL, McCabe CH, Horacek T, Papuchis G, et al. The TIMI risk score for unstable angina/non-ST elevation MI. A method for prognostication and therapeutic decision making. JAMA. 2000;284:835–842. doi: 10.1001/jama.284.7.835. [DOI] [PubMed] [Google Scholar]
- 26.Kalvaitis S, Kaul S, Rinkevich D, Tong KL, Belcik T, Wei K. Effect of Time Delay on the Diagnostic and Prognostic Utility of Myocardial Contrast Echocardiography in Patients Presenting with Suspected Cardiac Chest Pain to the Emergency Department. J Am Soc Echocardiogr. 2006;19:1488–1493. doi: 10.1016/j.echo.2006.06.010. [DOI] [PubMed] [Google Scholar]
- 27.Wyrick JJ, Kalvitis S, McConnell J, Rinkevich D, Kaul S, Wei K. Myocardial Contrast Echocardiography is Cost-Efficient in Patients Presenting to the Emergency Department with Suspected Cardiac Chest Pain and a non-diagnostic Electrocardiogram. Am J Cardiol. 2008;102:649–652. doi: 10.1016/j.amjcard.2008.05.008. [DOI] [PMC free article] [PubMed] [Google Scholar]
- 28.Hundley WG, Kizilbash AM, Afridi I, Franco F, Peshock RM, Grayburn PA. Effect of contrast enhancement on transthoracic echocardiographic assessment of left ventricular regional wall motion. Am J Cardiol. 1999;84:1365–1368. doi: 10.1016/s0002-9149(99)00577-9. [DOI] [PubMed] [Google Scholar]
- 29.Malhotra V, Nwogu J, Bondmass MD, Bean M, Bieniarz T, Tertell M, et al. Is the technically limited echocardiographic study an endangered species? Endocardial border delineation with native tissue harmonic imaging and Optison contrast: a review of 200 cases. J Am Soc Echocardiogr. 2000;13:771–773. doi: 10.1067/mje.2000.106078. [DOI] [PubMed] [Google Scholar]
- 30.Thomson HL, Basmadjian AJ, Rainbird AJ, Razavi M, Avierinos JF, Pellikka PA, et al. Contrast echocardiography improves the accuracy and reproducibility of left ventricular remodeling measurements: a prospective, randomly assigned, blinded studym. J Am Coll Cardiol. 2001;38:867–75. doi: 10.1016/s0735-1097(01)01416-4. [DOI] [PubMed] [Google Scholar]