

Abstract
Parkinson's disease (PD) is associated with impairments in facial emotion recognition as well as visual and executive dysfunction. We investigated whether facial emotion categorization impairments in PD are attributable to visual scanning abnormalities by recording the eye movements of 16 non-demented PD and 20 healthy control (HC) participants during an emotion recognition task. We examined the influence of several factors that can affect visual scanning, including oculomotor, basic visual, and cognitive abilities (executive function). Increases in the number and duration of fixations in the top regions of surprise facial expressions were related to increases in recognition accuracy for this emotion in PD participants with left-sided motor symptom onset. Compared to HC men, HC women spent less time fixating on fearful expressions. PD participants displayed oculomotor abnormalities (antisaccades), but these were unrelated to scanning patterns. Performance on visual measures (acuity, contrast sensitivity) correlated with scanning patterns in the PD group only. Poorer executive function was associated with longer fixation times in PD and with a greater number of fixations in HC. Our findings indicate a specific relation between facial emotion categorization impairments and scanning of facial expressions in PD. PD and HC participants' scanning behaviors during an emotion categorization task were driven by different perceptual processes and cognitive strategies. Our results underscore the need to consider differences in perceptual and cognitive abilities in studies of visual scanning, particularly when examining this ability in patient populations for which both vision and cognition are impaired.
Keywords: Parkinson's disease, visual scanning, saccadic eye movements, antisaccades, facial emotion recognition, visuoperception
Introduction
Individuals with Parkinson's disease (PD) display impairments in the ability to recognize emotions from facial expressions (Clark, Neargarder, & Cronin-Golomb, 2008; Dujardin et al., 2004; Jacobs, Shuren, Bowers, & Heilman, 1995; Kan, Kawamura, Hasegawa, Mochizuki, & Nakamura, 2002; Lawrence, Goerendt, & Brooks, 2007; Sprengelmeyer et al., 2003), but the reason for this deficit is as yet unclear. Investigations of visual scanning behaviors in neuropsychiatric patients (Adolphs et al., 2005; Ogrocki, Hills, & Strauss, 2000), and healthy older adults (Wong, Cronin-Golomb, & Neargarder, 2005) suggest that abnormalities in visual scanning of facial images may contribute to impairments in emotion recognition abilities, raising the question of whether emotion recognition impairments in PD may arise from abnormalities in visual scanning.
The neuropathology of PD affects several structures that are implicated in eye movement control. PD is associated with a reduction in dopaminergic neurons in the substantia nigra pars compacta, leading to a dysfunction of fronto-striatal systems (Hornykiewicz & Kish, 1987; Parent, 1990; Taylor, Saint-Cyr, & Lang, 1986). Human and non-human primate research indicates that a specific area within the frontal lobes, the frontal eye fields (FEF), is prominently involved in the larger cortical network that contributes to visual attention and oculomotor functioning (for review see Barton, 2001). The basal ganglia are also noted to play a key role in governing eye movements (for review see Hikosaka, Takikawa, & Kawagoe, 2000). Several studies have shown that abnormalities in visual scanning abilities are present in individuals with PD (Bares et al., 2003; Hood et al., 2007; Rascol et al., 1989; Vidailhet et al., 1994). Compared to healthy adults, individuals with PD display saccades that are slow, hypometric, and have increased response latencies (Hikosaka et al., 2000). PD patients also have difficulty controlling voluntary saccadic (i.e., antisaccades) (Hood et al., 2007) and smooth pursuit movements (Bares et al., 2003; Rascol et al., 1989).
Facial emotion recognition is a highly specific and complex process thought to involve several brain structures, including the amygdala, orbitofrontal cortex, dorsolateral prefrontal cortex, insula, basal ganglia, hippocampus, and the anterior cingulate (Adolphs, 2002; Phillips, Drevets, Rauch, & Lane, 2003). In a previous study (Clark et al., 2008), we found that PD participants displayed specific impairments in facial emotion recognition relative to a non-emotional categorization task. It is generally argued that abnormalities in facial emotion recognition in PD arise from losses of dopaminergic neurons resulting in dysfunction of fronto-subcortical systems (e.g., Dujardin et al., 2004; Lawrence et al., 2007; Sprengelmeyer et al., 2003); however the specific perceptual or cognitive processes underlying facial emotion recognition abnormalities in PD are not fully understood. As suggested above, it is possible that visual scanning abnormalities may contribute to facial emotion categorization impairments observed in this patient population. The current study expands upon our previous research by examining emotion categorization abilities in PD in relation to their visual scanning behaviors. Based on findings that suggest a relation between visual scanning abnormalities and impairments in emotion recognition (Adolphs et al., 2005; Ogrocki et al., 2000; Wong et al., 2005), we reasoned that PD participants would display abnormalities in visual scanning of facial emotions that were related to impairments in emotion recognition abilities.
Reports that the amount and quality of emotion-specific information expressed in facial displays differs across regions of the face led us to examine the topographic location of fixations (top vs. bottom, right vs. left). In regard to top and bottom regions, normal adults show a preference to examine the eyes over other regions of the face (Adolphs et al., 2005; Walker-Smith, Gale, & Findlay, 1977). Expressions of anger, fear, and sadness are reported to be best recognized from the top portions of the face, whereas disgust and happiness are more accurately recognized from the bottom portions; surprise facial expressions appear to be recognized equally well from the top and bottom regions (Calder, Young, Keane, & Dean, 2000). In regard to right and left sides, there is evidence to suggest that facial emotions are expressed more intensely by the left than the right hemiface in both human (Sackeim, Gur, & Saucy, 1978) and non-human primates (Fernandez-Carriba, Loeches, Morcillo, & Hopkins, 2002).
Beyond this regional specificity, researchers examining visual scanning patterns in healthy adults have proposed that scanning behaviors are governed by two general factors, including the cognitive processes of the viewer (top-down processes) and the image properties of the stimuli (e.g., low-level stimulus properties) (for review see Henderson, 2003). Visual scanning is strongly influenced by the nature of the task. For example, scanning patterns can differ substantially depending on whether the viewer is engaged in free viewing, memorizing aspects of the image, or examining the emotional connection between individuals in the image (Henderson, Weeks, & Hollingworth, 1999; Land & Hayhoe, 2001; Yarbus, 1967). Such data have been interpreted to suggest that visual scanning is strongly controlled by top-down cognitive processes. Other studies have shown that visual scanning behaviors are partially controlled by low-level stimulus properties of the image such as spatial frequency content, edge density, line curvature, and local contrast (Krieger, Rentschler, Hauske, Schill, & Zetzsche, 2000; Mannan, Ruddock, & Wooding, 1996, 1997; Parkhurst & Niebur, 2003; Reinagel & Zador, 1999).
Taking these findings into consideration, we investigated visual scanning patterns in relation to facial emotion categorization in PD (Experiment 1). We were particularly interested in examining scanning patterns in relation to the locations of fixations on facial expressions (top vs. bottom, right vs. left). We then assessed visual scanning patterns of emotional facial expressions in relation to three potential contributing factors: basic oculomotor abilities (Experiment 2), visual and visuoperceptual abilities (Experiment 3), and executive functioning abilities (Experiment 4). Because these abilities are known to be disrupted in PD (contrast sensitivity: Amick, Cronin-Golomb, & Gilmore, 2003; oculomotor: Hood et al., 2007; executive function: Zgaljardic, Borod, Foldi, & Mattis, 2003), we considered the possible moderating influences each of these abilities might exert on visual scanning behaviors when viewing emotional facial expressions. This evaluation helped to differentiate between the influences of abnormalities in perceptual and cognitive processes on visual scanning behaviors in PD.
General Method
Participants
Participants included 16 individuals with idiopathic PD without dementia (8 men, 8 women) and 20 healthy control (HC) participants (10 men, 10 women) (Table 1). The groups did not differ with respect to age (t [34] =.46, p=.65; range: PD = 46-72; HC = 45-72) or education (t [34] =.56, p=.58; range: PD = 12-20; HC = 13-19). We recruited PD participants from the Parkinson's Disease Clinic at the Boston Medical Center and through local PD support groups. Participants in the HC group were recruited from the community. All were right-handed except for 1 PD participant. The research was approved by Boston University's Institutional Review Board. All individuals gave their informed consent.
Table 1.
Participant Characteristics
| Variable | HC | PD | RPD | LPD | ||||
|---|---|---|---|---|---|---|---|---|
| (M/F = 10/10) | (M/F = 8/8) | (M/F =3/4) | (M/F =5/4) | |||||
| M | SD | M | SD | M | SD | M | SD | |
| Age (years) | 59.7 | 6.7 | 58.6 | 7.2 | 59.9 | 7.4 | 57.7 | 7.4 |
| Education (years) | 16.7 | 1.5 | 16.3 | 2.6 | 17.0 | 2.8 | 15.8 | 2.4 |
| Disease duration (years) | n/a | n/a | 6.0 | 3.1 | 6.1 | 3.1 | 5.9 | 3.2 |
| Hoehn & Yahr score (median & range) | n/a | n/a | 2.0 | 2.0-3.0 | 2.0 | 2.0-3.0 | 2.0 | 2.0-2.5 |
| Dementia Rating Scale (/144) | n/a | n/a | 142.9 | 1.0 | 143.4 | 0.8 | 142.6 | 1.0 |
| Mini-Mental Status Exam (/30) | 28.9 | 1.0 | 28.5 | 1.4 | 28.6 | 1.0 | 28.4 | 1.7 |
| Beck Depression Inventory (/63) | 4.1a | 4.6 | 9.2a | 5.4 | 9.9 | 4.2 | 8.7 | 6.3 |
| Beck Anxiety Inventory (/63) | 3.6a | 4.5 | 10.9a | 8.4 | 11.0 | 6.2 | 10.8 | 10.1 |
Note: HC = Healthy Control; PD = Parkinson's Disease; RPD = Right body side of motor onset Parkinson's Disease; LPD = Left body side of motor onset Parkinson's Disease; M/F = Male-Female ratio; M = Mean (or Median where noted). Within rows, means with the same superscript are significantly different at p≤.01.
Participants were required to be in good overall health and native speakers of English. They had no history of any of the following: uncorrected abnormal vision or hearing; psychiatric illness (including pre-existing diagnosis of depression or anxiety); use of psychoactive medications besides antidepressants and anxiolytics in the PD group; neurological illness other than PD, intracranial surgery, alcoholism, drug abuse, or eye disease.
PD participants were staged by their neurologist according to a measure of motor disability (Hoehn & Yahr, 2001). All were in stages II–III (mild to moderate bilateral disability) at the time of testing. Seven PD participants reported a right body side onset of motor symptoms (RPD: 3 men, 4 women) and nine reported a left-side symptom onset (LPD: 5 men, 4 women). Neither the RPD and LPD patients nor the male and female PD patients differed in age, education, duration of disease diagnosis, or Hoehn and Yahr scores. All PD participants were receiving daily dopamine replacement therapy and/or dopamine receptor agonists; all were tested while being administered their anti-parkinsonian medications (i.e., during their “on” state).
Procedure
Screening
We administered the Mini-Mental Status Exam (MMSE) (Folstein, Folstein, & McHugh, 1975) in order to assess general mental status. The PD and HC groups did not differ (t [34] =.89, p=.38); all participants obtained a score of 27 or above. PD participants were also administered the Dementia Rating Scale-2 (DRS) (Mattis, 1998) and all attained scores of 136 or above, which is well above the cutoff score of 123 that is suggestive of dementia. Levels of depression and anxiety were estimated using the Beck Depression Inventory, 2nd ed. (BDI) (Beck, Steer, & Brown, 1996) and the Beck Anxiety Inventory (BAI) (Beck, Epstein, Brown, & Steer, 1988), respectively. Relative to HC, the PD group showed more depression (t [34] =3.09, p<.01) and anxiety symptoms (t [34] =3.15, p<.01). No participants scored above the “mild depression” range on the BDI. Three PD and one HC reported symptoms above the “mild anxiety” range. RPD and LPD participants did not differ in their performance on the MMSE or DRS, nor did they differ in their ratings on the BDI or BAI. Male and female participants did not differ on the MMSE, DRS, BDI, or BAI in either the PD or HC group. Each participant's near acuity was assessed using a Snellen chart. None demonstrated binocular acuity worse than 20/40 at a distance of 45.7 cm. PD and HC participants did not differ on the acuity measure as measured in logmar values (t [34] =.45, p=.65). There was no difference in acuity between RPD or LPD groups, nor male-female differences in either the PD or HC group.
Testing sessions
The presentation of tasks in Experiments 1 through 4 was counterbalanced across participants. All tests were administered in a single session or over two sessions separated by one week or less.
Eye movement recordings
In Experiments 1 and 2, eye movements were monitored with the ViewPoint EyeTracker (Version 2.11; Arrington Research, Inc., Scottsdale, AZ), which was run on a Macintosh G4 desktop computer. Software included with the eye tracking system was used to present stimuli and record data. The system has a sampling rate of 30 Hz. Eye movement recordings were captured using a camera (mounted to an adjustable stand) with an attached infrared light source, which allowed eye movement recordings using a pupil location technique. Viewing was binocular, although only the position of the left eye was tracked. A chin rest and padded forehead bar maintained the participant's head position and distance from the computer monitor. Measurements of eye movements were conducted in a darkened room, in which participants were first dark adapted for 10 minutes.
The eye tracker was calibrated for each participant before the experiments began. Calibration consisted of having the participant fixate on nine calibration points (3 points each across the top, middle, and bottom of the screen), one at a time. Accuracy of the calibration was assessed by asking the participant to fixate on several specific points on a pre-test image. Calibration was checked on an additional set of test positions (3 for the saccade measures, and 5 for the facial emotion and landscape viewing tasks) prior to the presentation of each stimulus. The calibration process was repeated as necessary to ensure an accurate mapping of eye position.
Experiment 1: Facial emotion categorization and visual scanning of facial images
Method
Emotion categorization task
Participants viewed 70 black-and-white photographs taken from the Ekman and Friesen Pictures of Facial Affect database (Ekman & Friesen, 1976). Ten (5 male, 5 female) images were selected from each of the six prototypic expression categories: Angry, Disgust, Fear, Happy, Sad, and Surprise, plus Neutral. The images were cropped so that only the facial regions were shown. Stimuli were viewed on a 17-in. (43.2 cm) monitor. These images subtended a vertical visual angle of 19.3 to 25.6° and a horizontal visual angle of 13.0 to18.8°.
Landscape categorization task
We administered a categorization task as a non-emotional control measure. PD and HC participants viewed 70 black-and-white photographs taken from a database of landscape images (Clark et al., 2008), which were matched according to difficulty level to images used in the emotion categorization task. We presented 10 images from each of the following categories: Canyon, City, Forest, Mountain, Shore, Town, and Tropical. These images subtended a vertical visual angle of 17.2 to 25.6° and a horizontal visual angle of 17.2 to 26.1°.
For both tasks, stimuli were presented at 45 cm, in a randomized order. There was no time limit for viewing. Participants were asked to select the emotional or landscape category that best described the image from the list of seven possible categories that was provided on the screen below each image. We calculated the percentage of images correctly identified for each facial emotion and landscape image category. This task, which is discussed further elsewhere (Clark et al., 2008), provided information on emotional processing and categorization abilities in our participants and was used here to assess their relation to visual scanning patterns.
Visual scanning task: facial expressions
Fourteen black-and-white photographs, different from those used in the categorization task, were taken from the Ekman and Friesen Pictures of Facial Affect database (Ekman & Friesen, 1976). Two (1 male, 1 female) images were selected from each of the six prototypic expression categories: Angry, Disgust, Fear, Happy, Sad, and Surprise, plus Neutral. We included images that were reliably recognized images within each emotional category for this task. The images were cropped so that only the facial regions were shown. Facial images ranged between 17.1 and 20.3 cm high and measured between 12.5 and 15.0 cm wide. These images subtended a vertical visual angle of 20.8 to 24.2° and a horizontal visual angle of 15.6 to18.3°.
Visual scanning task: landscape images
This task was included as a control task that allowed us to examine visual scanning in response to non-facial, non-emotional stimuli. Fourteen black-and-white photographs, different from those used in the categorization task, were taken from a database of landscape images. Images from this database were matched on a one-to-one basis, according to recognizability and difficulty levels, to images used in the emotion task above. Two images were selected from each of the following six categories: Canyon, City, Forest, Mountain, Shore, Town, and Tropical. Landscape images ranged between 13.7 and 21.4 cm high and measured between 13.4 and 21.5 cm wide. These images subtended a vertical visual angle of 16.7 to 25.6° and a horizontal visual angle of 16.7 to 25.6°.
Visual scanning tasks: eye movement recordings
Facial and landscape image sets were presented separately and were counterbalanced across participants. Images were presented one at a time, for eight seconds (Wong et al., 2005), at a distance of 45 cm, in one of four randomized orders. Images were preceded by a central cross that participants fixated on to control for initial fixation location. Participants were asked to examine the image, as they would look at any photograph, and to decide which category best described the image. Images were followed by a screen displaying the seven emotion or landscape category labels presented for seven seconds. Participants fixated on the label that they thought best described the image and were verbally queried in cases of ambiguous responses. Eye movement data were recorded during the entire viewing time. To familiarize participants with the task, facial and landscape image sets were preceded by a practice image not included in the set of 14 study images. Completion of the practice trial ensured that participants understood the task requirements and were familiar with the image labels, which, for the trial image, were presented for ten seconds.
For each image, we extracted seven parameters: (1) Total number of fixations, (2) Total fixation duration, (3) Mean fixation duration, (4) Number of fixations made to the top vs. the bottom regions of the image, (5) Amount of time fixating in the top vs. the bottom regions, (6) Number of fixations made to the right visual hemifield (RVF) vs. the left visual hemifield (LVF), and (7) Amount of time fixating in the RVF vs. the LVF. We defined fixations as instances where the x-y eye coordinates were stable within 1 degree of visual angle (Loughland, Williams, & Gordon, 2002; Maltz & Shinar, 1999; Williams, Loughland, Gordon, & Davidson, 1999) for at least 50 ms (Dalton et al., 2005; Underwood, Foulsham, van Loon, Humphreys, & Bloyce, 2006). For facial images, top and bottom regions were defined by a horizontal line set at the bridge of the nose. The top region included the forehead, eyes, and top of the nose. The bottom region included the nostrils, mouth, and chin. Right and left regions were defined by the vertical midline of the face. For landscape images, top and bottom regions were defined by the horizontal midline of the image, and left and right regions were defined by the vertical midline. Figure 1 depicts top-bottom and left-right boundary lines in examples of facial and landscape images, and illustrates one HC participant's visual scan patterns to these images.
Figure 1.
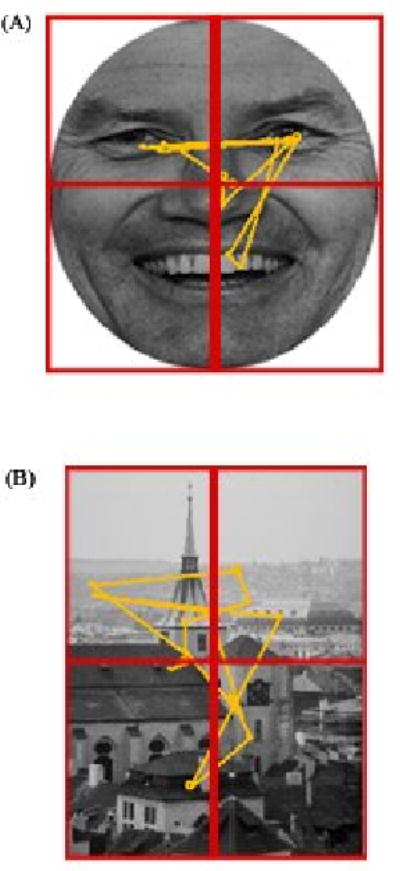
Examples of the visual scan patterns of a Healthy Control participant when viewing a facial emotion (A) and landscape image (B). Vertical and horizontal lines depict boundaries for right-left and top-bottom regions of interest, respectively. Circles represent fixations and attached lines represent saccades.
We determined the number of fixations made to the top and the bottom regions of images, and calculated a difference score by subtracting the number of fixations made to the bottom half of the image from those made to the top half of the image. Similar calculations were made to determine the amount of time spent fixating in the top and the bottom regions of the image. Positive numbers indicate a greater number of fixations or fixation duration in the top regions of the image. In comparisons of right and left fixations parameters, positive numbers indicate a greater number of fixations or fixation duration in the RVF. We calculated a mean for each of the seven visual scanning parameters, for each emotional category, that was the average of the fixation patterns made to each of the two faces for that emotion.
Visual scanning patterns are partially driven by image properties (e.g., contrast, edge orientation, image uniformity), and regions with greater visual variation receive more inspection (Henderson, 2003). In order to reduce the impact of these differences on visual scanning patterns across the landscape images, for each of the seven scanning parameters we calculated a mean that combined all fourteen landscape images. This allowed us to obtain a general measure of eye movements in response to non-facial image perception.
Because we were interested in assessing only those visual scanning patterns underlying the recognition of images, we examined data from the portion of total viewing time that best represented the decision making period. We calculated the PD and HC groups' average response times during the emotion categorization and landscape categorization tasks. For the facial emotion categorization task, we found that the HC group's average response time was 4.15 seconds (SD=1.14) and the PD group's average response time was 4.29 seconds (SD=1.31). For the landscape categorization task, the HC group's average response time was 4.25 seconds (SD=1.22) and the PD group's average response time was 4.22 seconds (SD=1.61). Overall, the average response time for both HC and PD groups across both tasks was 4.22 seconds (SD=1.29). Accordingly, we decided to analyze only the first 4.3 seconds of the eye tracking data.
Data Reduction
Eye movement recordings for facial expressions and landscape images
Before calculating the image category means for each of the seven visual scanning parameters, we examined each visual scanning data file for tracking accuracy. Those image files where the tracking of a participant's eye movements were inaccurate (indicating that either the participant moved while viewing the image or mechanical difficulties were experienced during data collection) were deleted from the final analyses. This resulted in the deletion of 4.8 % of the HC group's data and 5.8 % of the PD group's data. In order to preserve as much of the data as possible, in those instances where it was determined that the tracking of a participant's eye movements was inaccurate with regard to a topographical parameter (i.e., top-bottom or right-left placement), we chose to delete only the data related to that parameter. In the HC group, 8.9 % of the image files contained data that were partially removed, and 17.7 % of the PD group's scanning files contained data that were partially removed.
We assessed the visual scanning data for outliers in each group separately. We calculated the interquartile range (IQR) (i.e., the difference between the 75th and 25th percentiles) for each of the seven scanning parameters of each image category and deleted any value that was greater than 1.5 IQR from the end points of the range. This resulted in the deletion of 1.7 % of the HC data and 2.1 % of the PD data.
Results
The analyses that follow consist of mixed design analyses of variance (ANOVAs) followed by posthoc analyses when appropriate. For clarity, only those analyses revealing significant effects of interest are reported.
Comparisons of group performances on the Emotion categorization and Landscape categorization tasks
Our original findings from comparisons of the emotion categorization and landscape categorization tasks, described in detail in Clark et al., (2008), are replicated in the current sub-sample of the original cohort. We found that PD participants were impaired at recognizing facial expressions of Anger (t [34] = 2.66, p< .05) and Surprise (t [34] = 3.07, p< .01). Differences in side of motor-symptom onset were assessed, as the right hemisphere is thought to be more active than the left in processing emotional material (e.g., Blonder, Bowers, & Heilman, 1991; Borod, 1993; Bowers, Bauer, Coslett, & Heilman, 1985; Gur, Skolnick, & Gur, 1994; Narumoto, Okada, Sadato, Fukui, & Yonekura, 2001; Rapcsak, Kaszniak, & Rubens, 1989; Sato, Kochiyama, Yoshikawa, Naito, & Matsumura, 2004), and it is known that in PD, side of disease onset is associated with dysfunction of hemisphere-specific cognitive abilities (e.g., Amick, Grace, & Chou, 2006; Amick, Schendan, Ganis, & Cronin-Golomb, 2006; Davidsdottir, Wagenaar, Young, & Cronin-Golomb, 2008; Schendan, Amick, & Cronin-Golomb, 2009). Results from comparisons of RPD, LPD, and HC individuals indicated that impairments in the recognition of Angry facial expressions were driven by the LPD group compared to the HC group (F [2, 33] = 6.10, p< .01; post hoc, p< .01) and that impairments in the recognition of Surprise facial expressions were driven by the poorer performance of the RPD group compared to the LPD group and the HC group (F [2, 33] = 10.32, p< .001; post hoc, p< .05, p< .001 respectively). Because evidence suggests that women and men may experience PD differently (e.g., Haaxma et al., 2007; Shulman, 2007), and because male-female differences in emotion recognition have been reported (Hall, Carter, Horgan, & Fischer, 2000; Hall & Matsumoto, 2004; Thayer & Johnsen, 2000), we also examined male-female differences in emotion categorization in our groups. Men with PD demonstrated a further impairment in the recognition of Fearful facial expressions compared to women with PD (t [14] = 2.32, p< .05) and HC men (t [16] = 2.90, p< .05). The PD and HC groups did not differ in recognition of landscape categories (all p-values >.05). Group mean accuracy scores for performance on the facial expression and landscape categorization tasks are presented in Table 2.
Table 2.
Percent correct recognition for emotional facial and landscape image categories.
| Category | PD | RPD | LPD | HC | Male PD | Female PD | Male HC | Female HC | ||||||||
|---|---|---|---|---|---|---|---|---|---|---|---|---|---|---|---|---|
| M | SD | M | SD | M | SD | M | SD | M | SD | M | SD | M | SD | M | SD | |
| Anger | 78.1a | 14.2 | 85.7 | 14.0 | 72.2c | 12.0 | 90.0a,c | 12.6 | 75.0 | 14.1 | 81.3 | 14.6 | 88.0 | 14.8 | 92.0 | 10.3 |
| Disgust | 87.5 | 12.4 | 91.4 | 10.7 | 84.4 | 13.3 | 81.0 | 14.8 | 85.0 | 14.1 | 90.0 | 10.7 | 79.0 | 18.5 | 83.0 | 10.6 |
| Fear | 71.3 | 19.6 | 80.0 | 15.3 | 64.4 | 20.7 | 74.5 | 18.8 | 61.3f,g | 16.4 | 81.3f | 18.1 | 82.0g | 14.0 | 67.0 | 20.6 |
| Happy | 97.5 | 7.7 | 95.7 | 11.3 | 98.9 | 3.3 | 99.5 | 2.2 | 100.0 | 0.0 | 95.0 | 10.7 | 100.0 | 0.0 | 99.0 | 3.2 |
| Neutral | 82.5 | 18.4 | 71.4 | 23.4 | 91.1 | 6.0 | 84.5 | 9.4 | 77.5 | 24.9 | 87.5 | 7.1 | 85.0 | 9.7 | 84.0 | 9.7 |
| Sad | 80.6 | 19.1 | 77.1 | 24.3 | 83.3 | 15.0 | 81.5 | 20.1 | 80.0 | 17.7 | 81.3 | 21.7 | 72.0 | 23.9 | 91.0 | 8.8 |
| Surprise | 80.0b | 13.2 | 71.4d,e | 12.1 | 86.7d | 10.0 | 91.5b,e | 9.3 | 83.8 | 16.0 | 76.3 | 9.2 | 91.0 | 11.0 | 92.0 | 7.9 |
| All Faces | 82.5 | 5.9 | 81.8 | 6.9 | 83.0 | 5.4 | 86.1 | 6.7 | 80.4 | 4.3 | 84.6 | 6.8 | 85.3 | 7.6 | 86.9 | 6.0 |
| Canyon | 88.8 | 11.5 | 82.9 | 13.8 | 93.3 | 7.1 | 86.0 | 15.7 | 91.3 | 6.4 | 86.3 | 15.1 | 88.0 | 15.5 | 84.0 | 16.5 |
| City | 86.9 | 12.0 | 88.6 | 13.5 | 85.6 | 11.3 | 85.0 | 12.4 | 85.0 | 14.1 | 88.8 | 9.9 | 89.0 | 11.0 | 81.0 | 12.9 |
| Forest | 98.6 | 3.9 | 100.0 | 0.0 | 97.5 | 5.0 | 100.0 | 0.0 | 97.2 | 5.3 | 100.0 | 0.0 | 100.0 | 0.0 | 100.0 | 0.0 |
| Mountain | 89.4 | 10.0 | 92.9 | 7.6 | 86.7 | 11.2 | 91.0 | 7.9 | 92.5 | 7.1 | 86.3 | 11.9 | 90.0 | 9.4 | 92.0 | 6.3 |
| Shore | 85.0 | 20.7 | 77.1 | 29.8 | 91.1 | 6.0 | 88.0 | 10.6 | 91.3 | 9.9 | 78.8 | 27.0 | 90.0 | 9.4 | 86.0 | 11.7 |
| Town | 67.5 | 22.9 | 61.4 | 27.9 | 72.2 | 18.6 | 75.5 | 21.1 | 72.5 | 21.2 | 62.5 | 24.9 | 78.0 | 16.2 | 73.0 | 25.8 |
| Tropical | 88.8 | 14.5 | 94.3 | 9.8 | 84.4 | 16.7 | 88.5 | 16.9 | 81.3 | 16.4 | 96.3 | 7.4 | 83.0 | 21.6 | 94.0 | 8.4 |
| All Landscapes | 85.7 | 5.5 | 85.3 | 7.5 | 86.0 | 3.9 | 87.7 | 4.8 | 85.8 | 4.2 | 85.5 | 6.9 | 88.3 | 5.2 | 87.1 | 4.5 |
Note: PD = Parkinson's Disease; RPD = Right body side of motor onset PD; LPD = Left body side of motor onset PD; HC = Healthy Control; M = Mean; SD = Standard Deviation. Within rows, means with the same superscript are significantly different at p<.05.
Eye movement recordings for facial expressions
Fixation characteristics
The PD and HC groups did not differ significantly in the total number of fixations made to the seven emotional facial expressions, total time spent fixating on the emotional facial expressions, or mean fixation durations (all p's >.05).
Top-bottom comparisons
There was no significant group difference in the number or duration of fixations made to the top vs. the bottom regions of facial expressions (F [1, 23] = 0, p=.99). There was a significant main effect of top vs. bottom fixations (F [6, 138] = 3.37, p<.01), indicating that across both PD and HC groups, some emotions elicited a greater number of fixations to the top regions than did others, which is expected given that emotions vary in the amount of information that is conveyed in the upper and lower portions of the face (Calder et al., 2000).
Right-left comparisons
In comparing PD and HC on the number of fixations made to the RVF vs. the LVF of facial expressions, we observed a trend toward a main effect of group (F [1, 29] = 4.10, p=.052), a significant main effect of RVF vs. LVF fixations (F [6, 174] = 2.33, p<.05), and a non-significant interaction between RVF vs. LVF fixations and group (F [6, 174] = .47, p=.83). The PD group made a greater number of fixations in the RVF than did the HC group when Fearful faces were displayed (t [30] = 2.36, p<.05) (Figure 2). No group differences were observed for the remaining six emotions (all p's >.05). Significant group differences were not found when comparing PD and HC participants on the amount of time spent fixating in the RVF vs. the LVF of facial expressions (p>.05). We found a significant main effect of RVF vs. LVF fixation duration time (F [6, 192] = 2.62, p<.05) and a non-significant interaction between RVF vs. LVF fixation duration and group (F [6, 192] = .93, p=.48).
Figure 2.

Mean difference scores (+ standard error of the mean) for the number of fixations made to the right versus left visual fields when viewing facial expressions. Positive values indicate that more fixations were made to the right visual field and negative values indicate that more fixations were made to the left visual field. PD = Parkinson's Disease; HC = Healthy Control. Asterisks indicate that the groups' means are significantly different at the p<.05 level (*).
Side of motor onset
Because we observed differences in the emotion categorization abilities of PD participants that were related to side of body motor-symptom onset, we examined visual scanning patterns in the RPD and LPD groups separately. We focused our analyses on those emotions where the groups showed significant impairments in emotion categorization accuracy (i.e., Anger and Surprise). The results of these analyses did not reveal any significant group differences, indicating that the RPD, LPD, and HC groups' scanning of Anger and Surprise facial expressions did not differ (all p's>.05).
Scanning patterns of men with PD viewing fearful facial expressions
Because we observed that men with PD displayed specific impairments in the recognition of Fearful facial expressions when compared to women with PD and HC men, we examined the influence of gender and disease status on visual scanning for Fearful images. In the analysis comparing the groups on the total time spent fixating on Fearful facial expressions, we observed a non-significant main effect of group (F [1, 30] = 2.87, p=.10), a significant main effect of gender (F [1, 30] = 5.68, p<.05), and a significant interaction between group and gender (F [1, 30] = 4.44, p<.05). Follow-up t-tests indicated that HC women spent less time fixating on Fearful images than did HC men (t [17] = 2.83, p<.05) or women with PD (t [15] = 2.39, p<.05). Men and women with PD did not differ on this parameter (p >.05), nor did PD and HC men (p >.05). The analysis assessing group differences in mean fixation duration for Fearful expressions revealed no effect of group (F [1, 29] = 1.81, p=.19) or gender (F [1, 29] = 3.13, p=.09), and a significant interaction between group and gender (F [1, 29] = 4.36, p<.05). Follow-up t-tests revealed that HC women displayed a shorter mean fixation duration for Fearful images compared to HC men (t [16] = 3.28, p<.01) and to women with PD (t [14] = 3.02, p<.01). Men and women with PD did not differ on this parameter (p >.05), nor did PD and HC men (p >.05). In the analysis comparing the groups on the number of fixations made to the RVF vs. the LVF of Fearful expressions, we observed no effect of gender nor a gender by group interaction (both p>.05), but we did observe a significant main effect of group, which is consistent with findings reported above (Figure 2).
Eye movement recordings for landscape images
We compared the visual scanning patterns of PD and HC participants in response to viewing landscape images. No significant differences were found between the PD and HC groups for any of the seven visual scanning parameters (all p's>.05).
Comparisons of eye movement recordings for emotional faces and landscape images
Because abnormalities in facial scanning patterns have been observed in relation to specific subcortical neuropathology (e.g., Adolphs et al., 2005), we compared the PD and HC groups' patterns of visual scanning for emotional faces to those for landscape images to assess for differences in scanning patterns that may arise specifically in relation to faces in general. No significant differences were found between the PD and HC groups for any of the seven visual scanning parameters (all p's>.05).
Summary
In regard to facial emotion, PD patients displayed impairments in the recognition of Anger (driven by LPD) and Surprise (driven by RPD). Categorization impairments in PD were specific to facial emotion stimuli and were not observed on a task of non-emotional stimuli categorization of equal difficulty (i.e., landscape categorization). When comparing the visual scanning patterns of PD and HC, we found that the PD group made a greater number of fixations in the RVF when Fearful faces were displayed. No differences were observed between men and women with PD. HC women, compared to HC men, were noted to spend less time fixating on Fearful images and these fixations were of shorter duration. Correlational analyses of scanning patterns and emotion categorization are provided in the final Results section.
Experiment 2: Saccadic eye movements
The aims of this experiment were to compare PD and HC participants on measures of basic oculomotor function (saccades), and to evaluate the relative contribution of saccade integrity to visual scanning patterns of facial expressions. We hypothesized that the PD group would display abnormal saccades, particularly on a measure of voluntary saccades (i.e., antisaccades), based on findings of previous reports (e.g., Chan, Armstrong, Pari, Riopelle, & Munoz, 2005; Crevits & De Ridder, 1997; Hikosaka et al., 2000; Hood et al., 2007), including evidence that PD patients' saccades are generally slow and hypometric (Hikosaka et al., 2000). We reasoned that abnormalities in this oculomotor function would be related to reductions in the number of fixations made to images, increases in the mean duration of fixations, and increases in the overall time spent fixating on facial expressions.
Method
Prosaccade and Antisaccade tasks
We included tasks of both reflexive (prosaccade) and voluntary (antisaccade) abilities. Prosaccades are classified as a shift in gaze in response to targets appearing in various areas of the visual field. Antisaccades require a suppression of the automatic response to shift one's gaze toward new stimuli that appear in the visual field and require a shift of gaze in the direction opposite the location in which the stimulus appeared. Performance of prosaccade tasks recruits a network of cortical and subcortical regions including the FEF, supplemental eye fields, striatum, cerebellum, and brainstem loci (Barton, 2001; Pierrot-Deseilligny, Rivaud, Gaymard, Muri, & Vermersch, 1995). Studies comparing the neural substrates involved in the prosaccade and antisaccade tasks have shown that antisaccade tasks recruit the same network of structures, with additional activation observed in the FEF and other frontal regions including the dorsolateral prefrontal cortex (DLPFC) and supplemental eye fields (Barton, 2001; Cornelissen et al., 2002).
We based our protocols for prosaccade and antisaccade tasks on previously validated methods (Manoach, Weintraub, Daffner, & Scinto, 1997; Wong et al., 2005). The target stimuli were presented on a 17” computer screen. Eye movements were recorded using the Arrington Research eye tracking system, as in Experiment 1. The prosaccade and antisaccade paradigms that were used are described in detail in the report by Wong and colleagues (2005).
The presentation of prosaccade and antisaccade tasks was counterbalanced across participants. Both tasks included 20 trials and lasted approximately 60 seconds each. To familiarize participants with the tasks, each performed a practice set of seven practice trials before starting the task. Eye movement recordings were later reviewed by the experimenter to determine the accuracy of each trial. Accurate saccades were defined as those that were made in the direction of the target stimuli and directly followed the presentation of the stimuli. Accurate antisaccades were defined as those that were made in the direction opposite the target and directly followed the presentation of the stimuli.
Data reduction
The presence of outliers was assessed for the PD and HC groups separately. We calculated the IQR for prosaccade and antisaccade accuracy scores and omitted any value that was greater than 1.5 IQR from the end points of the range. This resulted in the deletion of 2 PD participants' data on the prosaccade measure.
Results
Prosaccade and Antisaccade tasks
We compared PD and HC participants' performances on the prosaccade and antisaccade tasks by conducting a two (PD, HC) by two (prosaccade, antisaccade) mixed design ANOVA, which revealed a significant main effect of group (F [1, 32] = 7.21, p<.05), a significant effect of task (F [1, 32] = 62.23, p<.001), and a significant group by task interaction (F [1, 32] = 7.26, p<.05). Follow-up analyses showed that, compared to the HC group, the PD group performed less accurately on the antisaccade task (t [34] = 2.72, p≤.01), whereas the groups did not differ on the prosaccade measure (t [32] =.14, p=.89).
We conducted a three (RPD, LPD, HC) by two (prosaccade, antisaccade) mixed design ANOVA, which revealed a significant main effect of group (F [2, 31] = 4.85, p<.05), a significant effect of task (F [1, 31] = 55.48, p<.001), and a significant group by task interaction (F [2, 31] = 5.78, p<.01). To examine the source of the interaction, we conducted three planned t-tests (LPD vs. HC; RPD vs. HC; and LPD vs. RPD) for each task. The results indicated that the groups did not differ on the prosaccade task (all p's>.05). In the antisaccade task, group differences were observed between the LPD and HC groups only (t [27] = 3.39, p<.01) (all other p's >.05). Group mean accuracy scores for performance on the prosaccade and antisaccade tasks are presented in Table 3.
Table 3.
Mean (+ standard deviations) percent correct scores on the Prosaccade and Antisaccade tasks for each group and subgroup.
| HC | PD | RPD | LPD | |||||
|---|---|---|---|---|---|---|---|---|
| (N=20) | (N=16*) | (N=7*) | (N=9) | |||||
| M | SD | M | SD | M | SD | M | SD | |
| Prosaccade | 98.0 | 3.4 | 97.8 | 4.3 | 97.0 | 6.7 | 98.3 | 2.6 |
| Antisaccade | 85.8a,b | 11.4 | 73.8a | 15.1 | 80.7 | 12.1 | 68.3b | 15.6 |
Note: HC = Healthy Control; PD = Parkinson's Disease; RPD = Right body side of motor onset Parkinson's Disease; LPD = Left body side of motor onset Parkinson's Disease.
On the prosaccade task PD N=14 and RPD N=5. Within rows, means with the same superscript are significantly different at p≤.01.
Summary
In line with previous findings (Chan et al., 2005; Hood et al., 2007), our results indicate that PD patients demonstrate reduced accuracy in antisaccade generation (driven by the LPD group) and normal accuracy levels for reflexive saccades. Correlational analyses are provided in the final Results section.
Experiment 3: Basic vision and visuoperception
The aim of this experiment was to evaluate the relation between basic visual and visuoperceptual functioning and visual scanning of facial expressions. Because visual scanning is partially driven by visually salient information detected by the viewer (e.g., contrast, intensity, spatial frequency) (Krieger et al., 2000; Mannan et al., 1996, 1997; Parkhurst & Niebur, 2003; Reinagel & Zador, 1999), we hypothesized that we would observe a relation between visual scanning of facial expressions and performance on tasks of basic vision and visuoperceptual abilities in the PD and HC groups.
Method
Contrast sensitivity
We used two measures of contrast sensitivity: a chart test and a computer-based letter-identification test. The Functional Acuity Contrast Test (FACT) (Ginsburg, 1984) is a chart that assesses the degree of contrast at which an individual can correctly detect the orientation of sinusoidal gratings at various spatial frequencies. The stimuli are presented in nine rows of circles that decrease in contrast from left to right. Moving down each column, the gratings increase in spatial frequency, from 1.5, 3, 6, 12, to 18 cycles per degree (cpd). In each circle, the gratings are oriented either vertically, to the left, or to the right and the participant indicates the orientation, either verbally or by hand gesture. Participants view the near FACT from a distance of 45.7 cm. A contrast level is determined for each spatial frequency by finding the minimal perceptible contrast level required to correctly identify the orientation of the grating for a given row. Higher scores indicate better contrast sensitivity.
We have found the computer-based letter-identification measure to be more sensitive than chart measures when assessing subtle changes in contrast sensitivity in non-demented individuals with PD (see Amick et al., 2003 for further experimental details). Briefly, the task presents a short display (12 ms) of a target letter (i.e., H, O, T, X). Target letters subtend a visual angle of 1.7°. After an interstimulus interval of 59 ms, the target letter is followed by a masking stimulus (lasting 506 ms) that consists of overlapping letters. The task is to name the target letter. Contrast levels are calculated using the Michelson contrast formula (max Lum – min Lum)/(max Lum + min Lum), where max Lum equals the luminance of the target and min Lum is the luminance of the constant background. These calculations determine the contrast levels required for participants' performance at 80 percent accuracy. On this task, lower scores indicate better contrast sensitivity.
Facial perception task
We administered the 16-item version of the Benton Test of Facial Recognition (Benton, Sivan, Hamsher, Varney, & Spreen, 1994) to assess general face perception abilities. This task presents participants with target photographs of unfamiliar faces and requires that they identify images of the target in a selection of six photographs that have been taken from different angles or under different lighting conditions. No time limit is placed on responses. Because the PD and HC groups were matched on age and education, raw scores were used in the analyses. Higher scores on this measure indicate greater facial perception abilities.
Results
Contrast sensitivity
For the FACT, we assessed group differences by conducting a mixed design ANOVA with group (PD, HC) as the between subjects factor and the five spatial frequencies as the within-subjects factor. There was no significant main effect of group (F [1, 34] = .33, p=.57), a significant effect of spatial frequency (F [1.95, 66.29] = 96.33, p<.001), and no significant group by frequency interaction (F [1.95, 66.29] = 1.37, p=.26). A separate analysis comparing RPD, LPD, and HC on the FACT revealed no main effect of group (F [2, 33] = .16, p=.85) or significant interaction effect (F [4.15, 68.52] = 1.78, p=.14). Table 4 presents group mean log contrast sensitivity scores on the FACT for each group.
Table 4.
Means (+ standard deviations) for scores of each group and subgroup on visual, visuoperceptual, and executive function measures.
| HC | PD | RPD | LPD | |||||
|---|---|---|---|---|---|---|---|---|
| (N=20) | (N=16*) | (N=7*) | (N=9) | |||||
| M | SD | M | SD | M | SD | M | SD | |
| FACT 1.5 cpd | 1.94 | .09 | 1.88 | .19 | 1.81 | .26 | 1.93 | .11 |
| FACT 3 cpd | 2.08 | .12 | 1.99 | .19 | 1.95 | .26 | 2.02 | .13 |
| FACT 6 cpd | 1.98 | .22 | 2.12 | .79 | 2.32 | 1.20 | 1.97 | .21 |
| FACT 12 cpd | 1.58 | .26 | 1.45 | .23 | 1.38 | .22 | 1.50 | .24 |
| FACT 18 cpd | 1.03 | .26 | .96 | .41 | .95 | .45 | .97 | .40 |
| Contrast Sensitivity | 30.54 | 15.32 | 44.08 | 22.56 | 41.64 | 23.93 | 45.98 | 22.71 |
| BTFR | 22.80 | 2.07 | 22.40 | 2.03 | 22.17 | 2.32 | 22.56 | 1.94 |
| TMT Part B | 57.90 | 20.46 | 70.00 | 21.19 | 71.50 | 29.26 | 69.00 | 15.75 |
| Stroop | -.50 | 7.98 | -1.14 | 6.06 | -.75 | 6.21 | -1.40 | 6.32 |
Note: HC = Healthy Control; PD = Parkinson's Disease; RPD = Right body side of motor onset Parkinson's Disease; LPD = Left body side of motor onset Parkinson's Disease. FACT = The Functional Acuity Contrast Test; mean log scores are represented for each spatial frequency level (cpd). Higher scores indicate better contrast sensitivity. Contrast Sensitivity scores represent mean contrast thresholds required to reach 80% accuracy rates on the computerized backward masking task of contrast sensitivity. Lower scores indicate better contrast sensitivity. BTFR = Benton Test of Facial Recognition; scores represent mean number correct out of 28. Higher scores indicate better face perception. TMT = Trail Making Test; scores represent mean seconds taken to complete Part B. Lower scores indicate better performance. Stroop = Stroop Color-Word Interference Score. Mean raw interference scores are presented for the Stroop Color-Word Test; higher scores indicate better performance. *For BTFR, TMT, and Stroop Color-Word, PD N=15 and RPD N=6.
For the letter-identification task, differences between groups were assessed using independent samples t-tests (one-tailed because of predicted group differences, as per Amick et al., 2003). The PD group required greater contrast than the HC group when performing the task at the 20 percent error rate (t [25.4] = 2.05, p=.026). In order to reach the criterion performance rate (80% correct), the PD participants required a mean contrast of 44.1 percent (SD=22.6), whereas the HC group required a mean contrast of 30.5 percent (SD=15.3). A one-way ANOVA comparing the performance of RPD, LPD, and HC groups on this measure did not reveal any significant group differences (F [2, 33] = 2.34, p=.11). Table 4 presents group mean scores on this task.
Facial Perception
We analyzed the PD and HC groups' performances on the Benton Test of Facial Recognition using independent group t-tests. No group differences were found (t [33] = 0.57, p=.57). We assessed the performances of the RPD, LPD, and HC groups on this measure using a one-way ANOVA, which did not reveal significant group differences (F [2, 32] = .22, p=.80). Group means are presented in Table 4.
Summary
Our results indicated that the PD and HC groups did not differ on measures of acuity (as noted in the General Method section) or contrast sensitivity. On an experimental measure of contrast sensitivity (the letter identification task), we found that the PD group required greater contrast than the HC group, suggesting that contrast sensitivity may be reduced in the PD group, consistent with previous findings (Amick et al., 2003). We observed no group differences on a measure of facial recognition. Correlational analyses are provided in the final Results section.
Experiment 4: Executive function measures
Facial emotion categorization involves the integration of both emotional and cognitive processes (Phillips et al., 2003). Because the lateral prefrontal cortex and the anterior cingulate gyrus (ACC) may contribute to the integration of affective and cognitive information (Gray, Braver, & Raichle, 2002; Yamasaki, LaBar, & McCarthy, 2002), the integrity of these regions may be particularly integral to performance on measures of facial emotion categorization. In this experiment we included measures of executive functioning thought to be sensitive to processes in the DLPFC and ACC. The aim was to evaluate the relation between processes of executive functioning and visual scanning patterns of facial expressions. Because visual scanning is partially driven in a top-down manner by cognitive processes associated with the demands of the task (Henderson et al., 1999; Land & Hayhoe, 2001; Yarbus, 1967), and PD is associated with a disruption of the function of fronto-striatal circuits (Sawamoto et al., 2007; Taylor et al., 1986), we hypothesized that we would observe a relation between visual scanning during a task of emotion categorization and performance on standard neuropsychological measures of frontal-lobe executive function.
Method
Trail Making Test
The Trail Making Test (TMT) (Reitan & Wolfson, 1993) was administered as per Spreen and Strauss (1998). Part A requires the participant to connect a series of numbers (1 through 25) that are randomly distributed on a page, and Part B requires that the participant connect numbers and letters in an alternating pattern (1–A–2–B…), as quickly as possible. On this test, lower scores are indicative of better (faster) performance. Given the data implicating the frontal-lobe contribution to performance on Part B (Moll, de Oliveira-Souza, Moll, Bramati, & Andreiuolo, 2002; Zakzanis, Mraz, & Graham, 2005), we focused our analyses on Part B only.
Impairments on this measure in PD patients have been related to abnormal frontal lobe-function (Stam et al., 1993). In healthy adults, the DLPFC is one of the primary areas activated during Part B, along with the precentral gyrus, cingulate gyrus, and medial frontal gyrus (Moll et al., 2002; Zakzanis et al., 2005). The DLPFC is believed to support executive functions including complex problem-solving, retrieval abilities, organizational strategies, concept formation, and working memory, which are processes that are likely to be involved when making judgments about emotional expressions.
Stroop Color–Word Test (Golden, 1978a, 1978b)
This test consists of three conditions, each lasting 45 seconds. In the Word condition, participants read aloud lists of color names printed in black ink. In the Color condition, they name the color of the ink in which four X's (XXXX) are printed. In the Color-Word (Interference) condition, they name the ink color in which incongruent color names are printed. For each, the instructions are to read the name or color as quickly and accurately as possible. Higher scores are indicative of better performance. With evidence for a frontal-striatal contribution to performance on the interference portion of this measure (Bruck et al., 2001; Rinne et al., 2000), the analyses concentrate on the interference scores only.
In PD patients, impaired performance on the interference condition has been related to abnormal dopaminergic functioning in the caudate (Bruck et al., 2001; Rinne et al., 2000) and to a lesser degree in the frontal cortices (Rinne et al., 2000). Poor performance in the Stroop has also been related to abnormal frontal-lobe functioning in PD (Stam et al., 1993). In healthy adults, increased reaction times for the interference condition on a modified version of the Stroop task has been correlated with increased ACC activation (MacDonald, Cohen, Stenger, & Carter, 2000). The ACC is thought to subserve executive functioning processes such as response initiation, intention, inhibition, and conflict monitoring, all of which are likely to support decision making on an emotion categorization task.
Results
Group performances were similar on these measures; statistics are reported for TMT followed by Stroop. No significant differences were found between the PD and HC (t [33] = 1.71, p=.10; t [33] =.26, p=.80), nor between men and women with PD (t [13] = .19, p=.85; t [13] = 1.03, p=.32). The performances of the RPD, LPD, and HC groups were assessed using a one-way ANOVA, which revealed no significant group differences (F [2, 32] = 1.44, p=.25; F [2, 32] = .05, p=.95). Table 4 presents group means.
Correlational analyses: emotion categorization, visual scanning, antisaccades, basic vision and visuoperception abilities, and executive function
In the correlational analyses we adjusted alpha to account for the multiple comparisons made within each experiment. We used a Bonferroni correction (alpha = .05/3 = .017) for the scanning variables that characterized fixation characteristics, as well as for those variables that describe the topographical characteristics of scanning patterns (i.e., top-bottom; right-left parameters; alpha = .05/2 = .025). Only those analyses resulting in significant correlations are reported.
Experiment 1: Visual scanning and emotion categorization
In the PD group, accuracy at recognizing Sad faces was positively correlated with the number of fixations made to the top vs. bottom regions of Sad faces (r=.64, p≤.01), and the amount of time spent fixating in the top vs. bottom regions of Sad faces (r=.62, p<.025). In HC, accuracy rates for Surprise facial expressions were negatively correlated with the total number of fixations made to Surprise images (r= -.56, p=.01). Because RPD participants displayed a specific impairment in the recognition of facial expressions of Surprise, and LPD participants demonstrated greater difficulties in recognizing Angry expressions, we assessed the relation between accuracy rates for Anger and Surprise facial expressions and RPD and LPD participants' scanning variables for these emotions. In the LPD group, accuracy rates for Surprise faces were positively correlated with the number of fixations made to the top vs. bottom regions of Surprise faces (r=.88, p<.025), and the amount of time spent fixating in the top vs. bottom regions of Surprise faces (r=.88, p<.01), indicating that accuracy rates for Surprise faces increased with increased time spent examining the top regions of Surprise expressions in LPD participants.
Experiment 2: Antisaccades, visual scanning, and emotion categorization
We found no correlations between the impairment in voluntary oculomotor abilities (i.e., antisaccade accuracy) and visual scanning in our groups (all p's>.05). Volitional oculomotor abilities were also unrelated to emotion categorization accuracy (p>.05).
Experiment 3: Basic vision and visuoperception, visual scanning, and emotion categorization
For the PD participants, better acuity was associated with greater total time spent fixating on emotional faces (r=.68, p<.017) and longer mean duration of fixations made to facial expressions (r=.59, p<.017). We also observed a positive correlation between performance on the FACT at 3 cpd and amount of time spent fixating in the right vs. left regions of emotional faces (r=.60, p<.025). Because we observed that PD participants, compared to HC, made a greater number of fixations in the RVF vs. LVF when viewing Fearful faces, and because men with PD showed a specific impairment in recognizing Fearful expressions, we examined the relation between these tendencies and basic visual and visuoperceptual abilities. In men with PD, better performance on the FACT at 12 cpd was related to a greater number of fixations in the RVF (r=.86, p<.025).
Experiment 4: Executive function, visual scanning, and emotion categorization
In the PD group, poorer performance on executive function measures was associated with an increase in the number of fixations made to Angry faces (TMT B, r= -.65, p<.01), and an increase in the amount of time spent examining the top regions of Angry (TMT B, r=.70, p<.01; Stroop Interference score, r= -.60, p<.025), Fearful (TMT B, r=.73, p<.01), Neutral (TMT B, r=.576, p=.025; Stroop Interference score, r= -.65, p<.01), and Surprise faces (TMT B, r= .75, p<.01; Stroop Interference score, r= -.73, p<.01). In the HC group, poorer performance on TMT B was related to an increase in the number of fixations made to Fearful (r=.55, p<.017) and Surprise facial expressions (r=.55, p<.017).
In analyses examining the relation between executive function and emotion categorization, we used a conservative alpha level of .01 because of correlations between emotions. These analyses revealed no significant correlations in the PD group (all p's >.01, with alpha =.01), whereas in the HC group poorer performance on TMT B was related to decreases in the recognition of Fearful (r= -.629, p<.01) and Happy (r= -.898, p<.001) facial expressions.
Discussion
The present study assessed whether impairments in recognizing facial expressions by patients with PD (Clark et al., 2008) were related to abnormalities in image analysis as represented by visual scanning patterns. Because PD is a disorder that is associated with oculomotor, visual, and cognitive abnormalities, we deemed that a careful assessment of group differences in scanning behaviors must also include an examination of these factors, which are known to affect visual scanning behaviors, including oculomotor abilities, basic visual functions, and cognitive abilities (i.e., executive function). Our examinations were conducted over a series of specific experiments, the findings from which we consider below.
Facial emotion categorization and visual scanning of facial images
Decreases in the number of fixations made in, and the amount of time spent fixating in upper facial regions, were associated with impaired recognition of sad expressions in the PD group. This finding accords with the fact that sad facial expressions are best identified from viewing the top half of faces (Calder et al., 2000). Comparisons of HC, RPD, and LPD participants on the emotion categorization task indicated that RPD participants displayed impairments in the recognition of surprise expressions, relative to LPD and HC participants. Analyses of visual scanning patterns revealed that increases in the number and duration of fixations in the top regions of surprise facial expressions were related to increases in recognition accuracy rates for this emotion in LPD participants. These results suggest that those LPD participants who attended more to salient emotional information present in the top regions of the face (i.e., eyes) were better able to recognize the emotion. Because LPD and RPD participants did not differ on top-bottom fixation measures, it is possible that RPD participants did not appropriately use this salient information. These findings suggest a modest but specific relation between facial emotion categorization impairments and visual scanning of facial expressions in PD.
Notably, not all studies have found a correlation between visual scanning of facial expressions and facial emotion recognition impairments. For example, Streit and colleagues (1997) found no relation between facial emotion recognition and facial visual scanning patterns in either schizophrenic patients or their control group. These researchers suggested that the neural systems responsible for visual scanning abnormalities may be unrelated to those that support facial emotion categorization in schizophrenic patients. Similarly, Sullivan and colleagues (2007) found that healthy older adults spent relatively more time looking at the eyes of angry expressions than did younger adults, but this pattern did not correlate with reductions in recognition accuracy for angry expressions in the older adult group.
By contrast, Wong and colleagues (2005) demonstrated that, compared to younger adults, older adults displayed an increased proportion of fixations in the lower regions of the face, which was associated with older adults' recognition impairments for expressions of fear, anger, and sadness. It is possible that the inconsistent results of the studies conducted by Wong and colleagues and by Sullivan and colleagues may be secondary to methodological differences, such as the manner in which fixations and regions of interest in the face were defined, or the amount of image viewing time that was analyzed. Yet, it is difficult to compare the results of Wong et al. to the current work, given that the mean age of participants in the current study was substantially younger (HC = 59.7 years; PD = 58.6 years) than that of the older adult group in Wong et al. (69.5 years). Results similar to those reported by Wong et al. have been observed in a patient with amygdala damage (Adolphs et al., 2005) and in patients with Alzheimer's disease (Ogrocki et al., 2000). The discrepancy between the findings of the current study and those that have shown a relation between visual scanning patterns and facial emotion recognition impairments in these patient groups suggests that the neural networks governing active visual scanning behaviors may be differently affected in these patients than they are in PD.
Saccadic eye movements
In line with previous findings (e.g., Chan et al., 2005; Hood et al., 2007), our results indicate that accurate antisaccade (i.e., voluntary saccade) generation was significantly reduced in PD participants, whereas accuracy for prosaccades (i.e., reflexive saccades) was normal. Notably, we found the antisaccade abnormalities to be most pronounced in the LPD participants (who have greater right hemisphere impairment), which is consistent with findings indicating greater involvement of the prefrontal regions in the right than left hemisphere in antisaccade generation (Ettinger et al., 2005; Sweeney et al., 1996). We did not find a relation between performance on the antisaccade task and visual scanning patterns during the emotion categorization task. Moreover, abnormalities on the antisaccade task were unrelated to facial emotion categorization abilities. Our findings suggest that in PD patients, visual scanning and facial emotion categorization processes were unaffected by abnormalities in the neural system that underlies antisaccade movements, which includes the FEF, supplemental eye fields, striatum, cerebellum, and brainstem loci (Barton, 2001; Pierrot-Deseilligny et al., 1995).
Influence of basic vision abilities and visuoperception
When comparing the visual scanning patterns of PD and HC groups, we found that the PD group made a greater number of fixations in the RVF than did the HC group when examining fearful expressions. This result is intriguing in light of our finding that men with PD displayed impairments in recognition of fearful expressions (Clark et al., 2008). Because this pattern was not related to increased impairment in fear recognition for male or female PD participants, we can infer that this behavior, although different from that of HC participants, is not disadvantageous in relation to emotion categorization processes. As facial emotion is expressed more intensely by the left hemiface (Dopson, Beckwith, Tucker, & Bullard-Bates, 1984; Sackeim et al., 1978), it is possible that individuals with PD examine the RVF (left hemiface) in an effort to obtain more emotion-related information. Results from Experiment 3 support this notion, in that they suggest that this difference in visual scanning patterns may have been driven by differences in low-level visual perception. Specifically, we observed that better contrast sensitivity at 12 cpd was related to increases in the number of fixations made in RVF for fearful images in men with PD. This finding suggests that the tendency for men with PD to make more fixations in the RVF when viewing fearful expressions may have been at least partially driven by low-level visual processes. Because better perception at higher spatial frequencies permits greater perception of fine-grained details from images, these data suggest that men with PD may be examining (and perhaps re-examining) multiple areas of interest in an attempt to extract more detailed information from the RVF of fearful expressions. This behavior may have arisen as a response to the greater difficulty men with PD experience in identifying fearful facial expressions.
We further found that in the PD group, better contrast sensitivity at a low frequency (3 cpd) was associated with an increase in the total time spent fixating in the RVF in PD participants. Studies of facial perception have indicated that better perception of visual information in the low frequency range allows for more accurate perception of the overall contour of facial characteristics (Cronin-Golomb et al., 2000). Accordingly, the tendency for PD participants to examine the emotionally intense left hemiface (RVF) may have been supported by better face perception abilities. We also observed that visual scanning of facial expressions was related to measures of acuity in PD participants. Better acuity was associated with fixations of greater duration and longer time spent fixating on faces, suggesting that greater analysis of facial features was facilitated by increased perception of those features. In the HC group, we did not observe a relation between measures of acuity or contrast sensitivity and visual scanning patterns of facial expressions, which suggests that visual scanning of facial expressions in HC participants may have been more strongly influenced by cognitive factors than by aspects of basic vision. This is in agreement with findings suggesting a predominant role for top-down processes in visual scanning behaviors in healthy adults (e.g., Einhäuser & König, 2003). It is important to note, however, that our findings do not rule out the possibility that additional visual abilities not measured here (e.g., motion perception), may influence visual scanning patterns in the HC group in contexts outside of the realm of this study.
Influence of executive function abilities
We also examined the relation between visual scanning patterns and cognitive abilities as assessed by neuropsychological measures of executive functioning. Based on research showing that visual exploration functions in parallel with moment-to-moment cognitive processes (Henderson et al., 1999; Land & Hayhoe, 2001; Yarbus, 1967), we hypothesized that we would observe an association between cognitive processing abilities and visual scanning patterns. We found that PD participants who exhibited weaker frontal-lobe-mediated abilities displayed a tendency to fixate longer in regions containing emotion-rich information (the upper regions) of angry, fearful, neutral, and surprise facial expressions. It is possible that those PD participants who displayed executive functioning difficulties (e.g., poor reasoning and problem solving abilities) may have spent more time looking in informative regions of facial expressions (i.e., the eyes: Baron-Cohen, Wheelwright, Hill, Raste, & Plumb, 2001) in response to the difficulties they experienced in making judgments about the emotional content of facial expressions. Because it was not observed that increased time spent looking in the top regions of faces was related to impaired recognition for these emotions in the PD group, we may infer that this additional time spent examining these regions was not detrimental to emotion categorization processes. More extensive examination in the top regions of the face may have served as a compensatory strategy for, or it may simply be a marker of, difficulties associated with decision making when assessing the emotional content of facial expressions of angry, fearful, neutral, and surprise.
In the HC group, we found that participants who demonstrated poorer executive functioning displayed a tendency to make more fixations on images of fear and surprise. We also observed that increases in the number of fixations made to surprise facial expressions were associated with decreased accuracy for the recognition of this emotion. We suggest that these findings may indicate that those HC participants who are better able to draw upon executive functioning abilities demonstrate a more organized analysis of facial expressions, which is associated with better identification accuracy.
Differences in the relation of frontal-lobe functions to visual scanning behaviors in the PD and HC groups are conceivable despite an overall lack of group differences on measures of executive function. It is suspected that the DLPFC and ACC, which underlie performance on the executive function measures used in this study (MacDonald et al., 2000; Zakzanis et al., 2005), are also involved in the integration of cognitive and emotional information (Gray et al., 2002; Yamasaki et al., 2002). It is possible that reductions in the integrity of the DLPFC and ACC may affect information extraction patterns on a task that involves both cognitive and emotional processing (e.g., facial emotion categorization) in individuals with weaknesses in both cognitive and emotional processing (i.e., individual PD participants) differently than they would in persons with weaknesses in cognitive abilities alone (i.e., individual HC participants). Given the dual role that the DLPFC and ACC play in cognitive and emotional integration, the correlation between scanning patterns and executive function abilities in PD may reflect the additive effect that difficulties in both cognitive and emotional processes have on visual scanning patterns in these patients. Hence, it is possible that PD-related abnormalities in emotional processing networks, which may involve ventral stream processes originating in the ventral striatum, amygdala, and prefrontal cortices (Clark et al., 2008), may combine with abnormalities in cognitive networks that involve the DLPFC and ACC to result in the observed differences in visual scanning patterns. This hypothesis will require further examination in future studies. Such investigations appear merited based on our observation of significant correlations between executive function measures with visual scanning behaviors. Our results are also consistent with findings that the DLPFC and ACC play a significant role in eye movement control and decisional processes governing oculomotor behavior (Gaymard et al., 1998; Pierrot-Deseilligny, Muri, Nyffeler, & Milea, 2005; Pierrot-Deseilligny, Ploner, Muri, Gaymard, & Rivaud-Pechoux, 2002). Consequently, it is not surprising that changes in the functional integrity of these regions would also be associated with modifications in visual information extraction patterns in our participants.
The different influences that executive function weaknesses have on visual scanning patterns in PD and HC participants imply that these groups may employ different compensatory strategies when trying to overcome cognitive difficulties on tasks of emotion categorization. These different influences may also reflect differences in the origin and organizational effects of frontal-lobe disruptions in these groups. Executive function weaknesses in the present HC group are presumably representative of changes in frontal-lobe circuitry seen in normal aging (Sullivan & Pfefferbaum, 2006; Tumeh et al., 2007), which differ etiologically from those associated with PD.
Conclusions
Our findings suggest that although PD and HC participants' visual scanning behaviors during an active viewing task of emotion categorization may appear similar when examined quantitatively using parameters relating to fixation characteristics and fixation location, there are subtle differences in scanning behaviors between the groups. Specifically, PD and HC participants' visual scanning behaviors show a tendency to be driven by distinct visual processes (e.g., acuity, contrast sensitivity) and cognitive strategies. These results highlight the importance of considering individual differences in perceptual and cognitive abilities in studies of visual scanning behaviors, particularly when examining this ability in patient populations for which aspects of vision and cognition are impaired. Further, the results provide evidence that the visual scanning behaviors exhibited by LPD and RPD participants, and by men and women, also differ. Additional studies with larger samples are needed to further explore the degree to which cognitive dysfunction and visual impairments may underlie differences in visual scanning behaviors during active viewing tasks of facial emotion categorization in individuals with PD as well as in subgroups of PD patients.
Acknowledgments
This work was supported by a Ruth L. Kirschstein National Research Service Award from the National Institute on Aging (Grant F31 AG026166), an American Psychological Association Minority Fellowship through the U.S. Department of Health and Human Services, Substance Abuse and Mental Health Services Administration (Grant T06 SM13833) (UC), a Clara Mayo Research Award from the Department of Psychology, Boston University (UC), and by the National Institute of Neurological Disorders and Stroke (Grant R01 NS050446) (ACG). We thank all of the individuals who participated in this study. Marie Saint-Hilaire, MD, and the Neurology team at Boston University Medical Center Neurology Associates provided valuable aid in our recruitment efforts. We are also grateful to Cheryl Matthews, BS; Kelly O'Keefe, MA; Lena Tsui, MA; Roxanne Istrate, MA; Amanda Sacino, BS; Allison Applebaum, MA; Sigurros Davidsdottir, PhD; Tom Laudate, MA; and Bruce Reese, MA, for their assistance with this project.
Footnotes
Publisher's Disclaimer: This is a PDF file of an unedited manuscript that has been accepted for publication. As a service to our customers we are providing this early version of the manuscript. The manuscript will undergo copyediting, typesetting, and review of the resulting proof before it is published in its final citable form. Please note that during the production process errors may be discovered which could affect the content, and all legal disclaimers that apply to the journal pertain.
References
- Adolphs R. Recognizing emotion from facial expressions: Psychological and neurological mechanisms. Behavioral and Cognitive Neuroscience Reviews. 2002;1(1):21–62. doi: 10.1177/1534582302001001003. [DOI] [PubMed] [Google Scholar]
- Adolphs R, Gosselin F, Buchanan TW, Tranel D, Schyns P, Damasio AR. A mechanism for impaired fear recognition after amygdala damage. Nature. 2005;433(7021):68–72. doi: 10.1038/nature03086. [DOI] [PubMed] [Google Scholar]
- Amick MM, Cronin-Golomb A, Gilmore GC. Visual processing of rapidly presented stimuli is normalized in Parkinson's disease when proximal stimulus strength is enhanced. Vision research. 2003;43(26):2827–2835. doi: 10.1016/s0042-6989(03)00476-0. [DOI] [PubMed] [Google Scholar]
- Amick MM, Grace J, Chou KL. Body side of motor symptom onset in Parkinson's disease is associated with memory performance. Journal of the International Neuropsychological Society. 2006;12(5):736–740. doi: 10.1017/S1355617706060875. [DOI] [PubMed] [Google Scholar]
- Amick MM, Schendan HE, Ganis G, Cronin-Golomb A. Frontostriatal circuits are necessary for visuomotor transformation: mental rotation in Parkinson's disease. Neuropsychologia. 2006;44(3):339–349. doi: 10.1016/j.neuropsychologia.2005.06.002. [DOI] [PubMed] [Google Scholar]
- Bares M, Brazdil M, Kanovsky P, Jurak P, Daniel P, Kukleta M, et al. The effect of apomorphine administration on smooth pursuit ocular movements in early Parkinsonian patients. Parkinsonism & related disorders. 2003;9(3):139–144. doi: 10.1016/s1353-8020(02)00015-9. [DOI] [PubMed] [Google Scholar]
- Baron-Cohen S, Wheelwright S, Hill J, Raste Y, Plumb I. The “Reading the Mind in the Eyes” Test revised version: a study with normal adults, and adults with Asperger syndrome or high-functioning autism. Journal of child psychology and psychiatry, and allied disciplines. 2001;42(2):241–251. [PubMed] [Google Scholar]
- Barton JJS. Brain damage and eye movements. In: Behrmann M, editor. Handbook of Neuropsychology. 2. Vol. 4. Amsterdam: Elsevier; 2001. pp. 15–44. [Google Scholar]
- Beck AT, Epstein N, Brown GK, Steer RA. An inventory for measuring clinical anxiety: Psychometric properties. Journal of Consulting and Clinical Psychology. 1988;56(6):893–897. doi: 10.1037//0022-006x.56.6.893. [DOI] [PubMed] [Google Scholar]
- Benton AL, Sivan AB, Hamsher KS, Varney NR, Spreen O. Contributions to Neuropsychological Assessment: A Clinical Manual. Second. New York: Oxford University Press; 1994. [Google Scholar]
- Blonder LX, Bowers D, Heilman KM. The role of the right hemisphere in emotional communication. Brain. 1991;114(Pt 3):1115–1127. doi: 10.1093/brain/114.3.1115. [DOI] [PubMed] [Google Scholar]
- Borod JC. Cerebral mechanisms underlying facial, prosodic, and lexical emotional expression: A review of neuropsychological studies and methodological issues. Neuropsychology. 1993;7:445–463. [Google Scholar]
- Bowers D, Bauer RM, Coslett HB, Heilman KM. Processing of faces by patients with unilateral hemisphere lesions. I. Dissociation between judgments of facial affect and facial identity. Brain and Cognition. 1985;4(3):258–272. doi: 10.1016/0278-2626(85)90020-x. [DOI] [PubMed] [Google Scholar]
- Bruck A, Portin R, Lindell A, Laihinen A, Bergman J, Haaparanta M, et al. Positron emission tomography shows that impaired frontal lobe functioning in Parkinson's disease is related to dopaminergic hypofunction in the caudate nucleus. Neuroscience Letters. 2001;311(2):81–84. doi: 10.1016/s0304-3940(01)02124-3. [DOI] [PubMed] [Google Scholar]
- Calder AJ, Young AW, Keane J, Dean M. Configural information in facial expression perception. Journal of experimental psychology: Human perception and performance. 2000;26(2):527–551. doi: 10.1037//0096-1523.26.2.527. [DOI] [PubMed] [Google Scholar]
- Chan F, Armstrong IT, Pari G, Riopelle RJ, Munoz DP. Deficits in saccadic eye-movement control in Parkinson's disease. Neuropsychologia. 2005;43(5):784–796. doi: 10.1016/j.neuropsychologia.2004.06.026. [DOI] [PubMed] [Google Scholar]
- Clark US, Neargarder S, Cronin-Golomb A. Specific impairments in the recognition of emotional facial expressions in Parkinson's disease. Neuropsychologia. 2008;46(9):2300–2309. doi: 10.1016/j.neuropsychologia.2008.03.014. [DOI] [PMC free article] [PubMed] [Google Scholar]
- Cornelissen FW, Kimmig H, Schira M, Rutschmann RM, Maguire RP, Broerse A, et al. Event-related fMRI responses in the human frontal eye fields in a randomized pro- and antisaccade task. Experimental brain research. 2002;145(2):270–274. doi: 10.1007/s00221-002-1136-3. [DOI] [PubMed] [Google Scholar]
- Crevits L, De Ridder K. Disturbed striatoprefrontal mediated visual behaviour in moderate to severe Parkinsonian patients. Journal of Neurology, Neurosurgery & Psychiatry. 1997;63(3):296–299. doi: 10.1136/jnnp.63.3.296. [DOI] [PMC free article] [PubMed] [Google Scholar]
- Cronin-Golomb A, Cronin-Golomb M, Dunne TE, Brown AC, Jain K, Cipolloni PB, et al. Facial frequency manipulation normalizes face discrimination in AD. Neurology. 2000;54(12):2316–2318. doi: 10.1212/wnl.54.12.2316. [DOI] [PubMed] [Google Scholar]
- Dalton KM, Nacewicz BM, Johnstone T, Schaefer HS, Gernsbacher MA, Goldsmith HH, et al. Gaze fixation and the neural circuitry of face processing in autism. Nature Neuroscience. 2005;8(4):519–526. doi: 10.1038/nn1421. [DOI] [PMC free article] [PubMed] [Google Scholar]
- Davidsdottir S, Wagenaar R, Young D, Cronin-Golomb A. Impact of optic flow perception and egocentric coordinates on veering in Parkinson's disease. Brain. 2008;131(Pt 11):2882–2893. doi: 10.1093/brain/awn237. [DOI] [PMC free article] [PubMed] [Google Scholar]
- Dopson WG, Beckwith BE, Tucker DM, Bullard-Bates PC. Asymmetry of facial expression in spontaneous emotion. Cortex. 1984;20(2):243–251. doi: 10.1016/s0010-9452(84)80041-6. [DOI] [PubMed] [Google Scholar]
- Dujardin K, Blairy S, Defebvre L, Duhem S, Noel Y, Hess U, et al. Deficits in decoding emotional facial expressions in Parkinson's disease. Neuropsychologia. 2004;42(2):239–250. doi: 10.1016/s0028-3932(03)00154-4. [DOI] [PubMed] [Google Scholar]
- Einhäuser W, König P. Does luminance-contrast contribute to a saliency map for overt visual attention? European Journal of Neuroscience. 2003;17(5):1089–1097. doi: 10.1046/j.1460-9568.2003.02508.x. [DOI] [PubMed] [Google Scholar]
- Ekman P, Friesen WV. Pictures of facial affect. Consulting Psychologists Press; 1976. [Google Scholar]
- Ettinger U, Antonova E, Crawford TJ, Mitterschiffthaler MT, Goswani S, Sharma T, et al. Structural neural correlates of prosaccade and antisaccade eye movements in healthy humans. Neuroimage. 2005;24(2):487–494. doi: 10.1016/j.neuroimage.2004.08.019. [DOI] [PubMed] [Google Scholar]
- Fernandez-Carriba S, Loeches A, Morcillo A, Hopkins WD. Asymmetry in facial expression of emotions by chimpanzees. Neuropsychologia. 2002;40(9):1523–1533. doi: 10.1016/s0028-3932(02)00028-3. [DOI] [PubMed] [Google Scholar]
- Folstein MF, Folstein SE, McHugh PR. Mini-mental state: A practical method for grading the cognitive state of patients for the clinician. Journal of Psychiatric Research. 1975;12(3):189–198. doi: 10.1016/0022-3956(75)90026-6. [DOI] [PubMed] [Google Scholar]
- Gaymard B, Rivaud S, Cassarini JF, Dubard T, Rancurel G, Agid Y, et al. Effects of anterior cingulate cortex lesions on ocular saccades in humans. Exp Brain Res. 1998;120(2):173–183. doi: 10.1007/s002210050391. [DOI] [PubMed] [Google Scholar]
- Ginsburg AP. A new contrast sensitivity vision test chart. Am J Optom Physiol Opt. 1984;61(6):403–407. doi: 10.1097/00006324-198406000-00011. [DOI] [PubMed] [Google Scholar]
- Golden CJ. Diagnosis and rehabilitation in clinical neuropsychology. Springfield, IL: Charles C. Thomas; 1978a. [Google Scholar]
- Golden CJ. Stroop Color and Word Test. Chicago, IL: Stoelting Co.; 1978b. [Google Scholar]
- Gray JR, Braver TS, Raichle ME. Integration of emotion and cognition in the lateral prefrontal cortex. Proceedings of the National Academy of Sciences of the United States of America. 2002;99(6):4115–4120. doi: 10.1073/pnas.062381899. [DOI] [PMC free article] [PubMed] [Google Scholar]
- Gur RC, Skolnick BE, Gur RE. Effects of emotional discrimination tasks on cerebral blood flow: regional activation and its relation to performance. Brain and Cognition. 1994;25(2):271–286. doi: 10.1006/brcg.1994.1036. [DOI] [PubMed] [Google Scholar]
- Haaxma CA, Bloem BR, Borm GF, Oyen WJ, Leenders KL, Eshuis S, et al. Gender differences in Parkinson's disease. Journal of neurology, neurosurgery, and psychiatry. 2007;78(8):819–824. doi: 10.1136/jnnp.2006.103788. [DOI] [PMC free article] [PubMed] [Google Scholar]
- Hall JA, Carter JD, Horgan TG, Fischer AH. Gender differences in nonverbal communication of emotion. New York, NY, US: Cambridge University Press; 2000. [Google Scholar]
- Hall JA, Matsumoto D. Gender differences in judgments of multiple emotions from facial expressions. Emotion. 2004;4(2):201–206. doi: 10.1037/1528-3542.4.2.201. [DOI] [PubMed] [Google Scholar]
- Henderson JM. Human gaze control during real-world scene perception. Trends in cognitive sciences. 2003;7(11):498–504. doi: 10.1016/j.tics.2003.09.006. [DOI] [PubMed] [Google Scholar]
- Henderson JM, Weeks PA, Jr, Hollingworth A. The effects of semantic consistency on eye movements during complex scene viewing. Journal of Experimental Psychology: Human Perception and Performance. 1999;25(1):210–228. [Google Scholar]
- Hikosaka O, Takikawa Y, Kawagoe R. Role of the basal ganglia in the control of purposive saccadic eye movements. Physiological reviews. 2000;80(3):953–978. doi: 10.1152/physrev.2000.80.3.953. [DOI] [PubMed] [Google Scholar]
- Hoehn MM, Yahr MD. Parkinsonism: Onset, progression and mortality. Neurology. 2001;57(10):S11–s26. [PubMed] [Google Scholar]
- Hood AJ, Amador SC, Cain AE, Briand KA, Al-Refai AH, Schiess MC, et al. Levodopa slows prosaccades and improves antisaccades: an eye movement study in Parkinson's disease. Journal of neurology, neurosurgery, and psychiatry. 2007;78(6):565–570. doi: 10.1136/jnnp.2006.099754. [DOI] [PMC free article] [PubMed] [Google Scholar]
- Hornykiewicz O, Kish SJ. Biochemical pathophysiology of Parkinson's disease. Advances in neurology. 1987;45:19–34. [PubMed] [Google Scholar]
- Jacobs DH, Shuren J, Bowers D, Heilman KM. Emotional facial imagery, perception, and expression in Parkinson's disease. Neurology. 1995;45(9):1696–1702. doi: 10.1212/wnl.45.9.1696. [DOI] [PubMed] [Google Scholar]
- Kan Y, Kawamura M, Hasegawa Y, Mochizuki S, Nakamura K. Recognition of emotion from facial, prosodic and written verbal stimuli in Parkinson's disease. Cortex. 2002;38(4):623–630. doi: 10.1016/s0010-9452(08)70026-1. [DOI] [PubMed] [Google Scholar]
- Krieger G, Rentschler I, Hauske G, Schill K, Zetzsche C. Object and scene analysis by saccadic eye-movements: an investigation with higher-order statistics. Spatial vision. 2000;13(2-3):201–214. doi: 10.1163/156856800741216. [DOI] [PubMed] [Google Scholar]
- Land MF, Hayhoe M. In what ways do eye movements contribute to everyday activities? Vision Research. 2001;41(25):3559–3565. doi: 10.1016/s0042-6989(01)00102-x. [DOI] [PubMed] [Google Scholar]
- Lawrence AD, Goerendt IK, Brooks DJ. Impaired recognition of facial expressions of anger in Parkinson's disease patients acutely withdrawn from dopamine replacement therapy. Neuropsychologia. 2007;45(1):65–74. doi: 10.1016/j.neuropsychologia.2006.04.016. [DOI] [PubMed] [Google Scholar]
- Loughland CM, Williams LM, Gordon E. Visual scanpaths to positive and negative facial emotions in an outpatient schizophrenia sample. Schizophrenia research. 2002;55(1-2):159–170. doi: 10.1016/s0920-9964(01)00186-4. [DOI] [PubMed] [Google Scholar]
- MacDonald AW, 3rd, Cohen JD, Stenger VA, Carter CS. Dissociating the role of the dorsolateral prefrontal and anterior cingulate cortex in cognitive control. Science. 2000;288(5472):1835–1838. doi: 10.1126/science.288.5472.1835. [DOI] [PubMed] [Google Scholar]
- Maltz M, Shinar D. Eye movements of younger and older drivers. Human factors. 1999;41(1):15–25. doi: 10.1518/001872099779577282. [DOI] [PubMed] [Google Scholar]
- Mannan SK, Ruddock KH, Wooding DS. The relationship between the locations of spatial features and those of fixations made during visual examination of briefly presented images. Spatial Vision. 1996;10(3):165–188. doi: 10.1163/156856896x00123. [DOI] [PubMed] [Google Scholar]
- Mannan SK, Ruddock KH, Wooding DS. Fixation patterns made during brief examination of two-dimensional images. Perception. 1997;26(8):1059–1072. doi: 10.1068/p261059. [DOI] [PubMed] [Google Scholar]
- Manoach DS, Weintraub S, Daffner KR, Scinto LF. Deficient antisaccades in the social-emotional processing disorder. Neuroreport. 1997;8(4):901–905. doi: 10.1097/00001756-199703030-00017. [DOI] [PubMed] [Google Scholar]
- Moll J, de Oliveira-Souza R, Moll FT, Bramati IE, Andreiuolo PA. The cerebral correlates of set-shifting: an fMRI study of the trail making test. Arquivos de neuro-psiquiatria. 2002;60(4):900–905. doi: 10.1590/s0004-282x2002000600002. [DOI] [PubMed] [Google Scholar]
- Narumoto J, Okada T, Sadato N, Fukui K, Yonekura Y. Attention to emotion modulates fMRI activity in human right superior temporal sulcus. Brain Res Cogn Brain Res. 2001;12(2):225–231. doi: 10.1016/s0926-6410(01)00053-2. [DOI] [PubMed] [Google Scholar]
- Ogrocki PK, Hills AC, Strauss ME. Visual exploration of facial emotion by healthy older adults and patients with Alzheimer disease. Neuropsychiatry, neuropsychology, and behavioral neurology. 2000;13(4):271–278. [PubMed] [Google Scholar]
- Parent A. Extrinsic connections of the basal ganglia. Trends in neurosciences. 1990;13(7):254–258. doi: 10.1016/0166-2236(90)90105-j. [DOI] [PubMed] [Google Scholar]
- Parkhurst DJ, Niebur E. Scene content selected by active vision. Spatial Vision. 2003;16(2):125–154. doi: 10.1163/15685680360511645. [DOI] [PubMed] [Google Scholar]
- Phillips ML, Drevets WC, Rauch SL, Lane R. Neurobiology of emotion perception I: The neural basis of normal emotion perception. Biol Psychiatry. 2003;54(5):504–514. doi: 10.1016/s0006-3223(03)00168-9. [DOI] [PubMed] [Google Scholar]
- Pierrot-Deseilligny C, Muri RM, Nyffeler T, Milea D. The role of the human dorsolateral prefrontal cortex in ocular motor behavior. Ann N Y Acad Sci. 2005;1039:239–251. doi: 10.1196/annals.1325.023. [DOI] [PubMed] [Google Scholar]
- Pierrot-Deseilligny C, Ploner CJ, Muri RM, Gaymard B, Rivaud-Pechoux S. Effects of cortical lesions on saccadic: eye movements in humans. Ann N Y Acad Sci. 2002;956:216–229. doi: 10.1111/j.1749-6632.2002.tb02821.x. [DOI] [PubMed] [Google Scholar]
- Pierrot-Deseilligny C, Rivaud S, Gaymard B, Muri R, Vermersch AI. Cortical control of saccades. Annals of neurology. 1995;37(5):557–567. doi: 10.1002/ana.410370504. [DOI] [PubMed] [Google Scholar]
- Rapcsak SZ, Kaszniak AW, Rubens AB. Anomia for facial expressions: evidence for a category specific visual-verbal disconnection syndrome. Neuropsychologia. 1989;27(8):1031–1041. doi: 10.1016/0028-3932(89)90183-8. [DOI] [PubMed] [Google Scholar]
- Rascol O, Clanet M, Montastruc JL, Simonetta M, Soulier-Esteve MJ, Doyon B, et al. Abnormal ocular movements in Parkinson's disease. Evidence for involvement of dopaminergic systems. Brain. 1989;112(Pt 5):1193–1214. doi: 10.1093/brain/112.5.1193. [DOI] [PubMed] [Google Scholar]
- Reinagel P, Zador AM. Natural scene statistics at the centre of gaze. Network. 1999;10(4):341–350. [PubMed] [Google Scholar]
- Reitan RM, Wolfson D. The Halstead–Reitan Neuropsychological Test Battery: Theory and Clinical Interpretation. 2nd. Tuscon, AZ: Neuropsychology Press; 1993. [Google Scholar]
- Rinne JO, Portin R, Ruottinen H, Nurmi E, Bergman J, Haaparanta M, et al. Cognitive impairment and the brain dopaminergic system in Parkinson disease: [18F]fluorodopa positron emission tomographic study. Archives of neurology. 2000;57(4):470–475. doi: 10.1001/archneur.57.4.470. [DOI] [PubMed] [Google Scholar]
- Sackeim HA, Gur RC, Saucy MC. Emotions are expressed more intensely on the left side of the face. Science. 1978;202(4366):434–436. doi: 10.1126/science.705335. [DOI] [PubMed] [Google Scholar]
- Sato W, Kochiyama T, Yoshikawa S, Naito E, Matsumura M. Enhanced neural activity in response to dynamic facial expressions of emotion: an fMRI study. Brain Res Cogn Brain Res. 2004;20(1):81–91. doi: 10.1016/j.cogbrainres.2004.01.008. [DOI] [PubMed] [Google Scholar]
- Sawamoto N, Honda M, Hanakawa T, Aso T, Inoue M, Toyoda H, et al. Cognitive slowing in Parkinson disease is accompanied by hypofunctioning of the striatum. Neurology. 2007;68(13):1062–1068. doi: 10.1212/01.wnl.0000257821.28992.db. [DOI] [PubMed] [Google Scholar]
- Schendan HE, Amick MM, Cronin-Golomb A. Role of a lateralized parietal-basal ganglia circuit in hierarchical pattern perception: evidence from Parkinson's disease. Behav Neurosci. 2009;123(1):125–136. doi: 10.1037/a0013734. [DOI] [PMC free article] [PubMed] [Google Scholar]
- Shulman LM. Gender differences in Parkinson's disease. Gender Medicine. 2007;4(1):8–18. doi: 10.1016/s1550-8579(07)80003-9. [DOI] [PubMed] [Google Scholar]
- Spreen O, Strauss E. A compendium of neuropsychological tests: Administration, norms, and commentary. 2nd. New York, NY, US: Oxford University Press; 1998. [Google Scholar]
- Sprengelmeyer R, Young AW, Mahn K, Schroeder U, Woitalla D, Buttner T, et al. Facial expression recognition in people with medicated and unmedicated Parkinson's disease. Neuropsychologia. 2003;41(8):1047–1057. doi: 10.1016/s0028-3932(02)00295-6. [DOI] [PubMed] [Google Scholar]
- Stam CJ, Visser SL, Op de Coul AA, De Sonneville LM, Schellens RL, Brunia CH, et al. Disturbed frontal regulation of attention in Parkinson's disease. Brain. 1993;116(Pt 5):1139–1158. doi: 10.1093/brain/116.5.1139. [DOI] [PubMed] [Google Scholar]
- Streit M, Wolwer W, Gaebel W. Facial-affect recognition and visual scanning behaviour in the course of schizophrenia. Schizophrenia research. 1997;24(3):311–317. doi: 10.1016/s0920-9964(96)00126-0. [DOI] [PubMed] [Google Scholar]
- Sullivan EV, Pfefferbaum A. Diffusion tensor imaging and aging. Neuroscience & Biobehavioral Reviews. 2006;30(6):749–761. doi: 10.1016/j.neubiorev.2006.06.002. [DOI] [PubMed] [Google Scholar]
- Sullivan S, Ruffman T, Hutton SB. Age differences in emotion recognition skills and the visual scanning of emotion faces. The journals of gerontology. Series B, Psychological sciences and social sciences. 2007;62(1):P53–60. doi: 10.1093/geronb/62.1.p53. [DOI] [PubMed] [Google Scholar]
- Sweeney JA, Mintun MA, Kwee S, Wiseman MB, Brown DL, Rosenberg DR, et al. Positron emission tomography study of voluntary saccadic eye movements and spatial working memory. Journal of neurophysiology. 1996;75(1):454–468. doi: 10.1152/jn.1996.75.1.454. [DOI] [PubMed] [Google Scholar]
- Taylor AE, Saint-Cyr JA, Lang AE. Frontal lobe dysfunction in Parkinson's disease. The cortical focus of neostriatal outflow. Brain. 1986;109(Pt 5):845–883. doi: 10.1093/brain/109.5.845. [DOI] [PubMed] [Google Scholar]
- Thayer JF, Johnsen BH. Sex differences in judgement of facial affect: A multivariate analysis of recognition errors. Scandinavian Journal of Psychology. 2000;41(3):243–246. doi: 10.1111/1467-9450.00193. [DOI] [PubMed] [Google Scholar]
- Tumeh PC, Alavi A, Houseni M, Greenfield A, Chryssikos T, Newberg A, et al. Structural and Functional Imaging Correlates for Age-Related Changes in the Brain. Seminars in Nuclear Medicine. 2007;37(2):69–87. doi: 10.1053/j.semnuclmed.2006.10.002. [DOI] [PubMed] [Google Scholar]
- Underwood G, Foulsham T, van Loon E, Humphreys L, Bloyce J. Eye movements during scene inspection: A test of the saliency map hypothesis. European Journal of Cognitive Psychology. 2006;18(3):321–342. [Google Scholar]
- Vidailhet M, Rivaud S, Gouider-Khouja N, Pillon B, Bonnet AM, Gaymard B, et al. Eye movements in parkinsonian syndromes. Annals of neurology. 1994;35(4):420–426. doi: 10.1002/ana.410350408. [DOI] [PubMed] [Google Scholar]
- Walker-Smith GJ, Gale AG, Findlay JM. Eye movement strategies involved in face perception. Perception. 1977;6(3):313–326. doi: 10.1068/p060313. [DOI] [PubMed] [Google Scholar]
- Williams LM, Loughland CM, Gordon E, Davidson D. Visual scanpaths in schizophrenia: is there a deficit in face recognition? Schizophrenia research. 1999;40(3):189–199. doi: 10.1016/s0920-9964(99)00056-0. [DOI] [PubMed] [Google Scholar]
- Wong B, Cronin-Golomb A, Neargarder S. Patterns of visual scanning as predictors of emotion identification in normal aging. Neuropsychology. 2005;19(6):739–749. doi: 10.1037/0894-4105.19.6.739. [DOI] [PubMed] [Google Scholar]
- Yamasaki H, LaBar KS, McCarthy G. Dissociable prefrontal brain systems for attention and emotion. Proceedings of the National Academy of Sciences of the United States of America. 2002;99(17):11447–11451. doi: 10.1073/pnas.182176499. [DOI] [PMC free article] [PubMed] [Google Scholar]
- Yarbus AL. Eye movements and vision. New York: Plenum Press; 1967. [Google Scholar]
- Zakzanis KK, Mraz R, Graham SJ. An fMRI study of the Trail Making Test. Neuropsychologia. 2005;43(13):1878–1886. doi: 10.1016/j.neuropsychologia.2005.03.013. [DOI] [PubMed] [Google Scholar]
- Zgaljardic DJ, Borod JC, Foldi NS, Mattis P. A review of the cognitive and behavioral sequelae of Parkinson's disease: relationship to frontostriatal circuitry. Cognitive and behavioral neurology. 2003;16(4):193–210. doi: 10.1097/00146965-200312000-00001. [DOI] [PubMed] [Google Scholar]