Abstract
Hybridization of complementary lipid-linked DNA oligonucleotides was used to tether small unilamellar vesicles (SUVs) to the lipid monolayer shells of air-microbubbles, a new attachment design for a drug delivery vehicle to be used in tandem with ultrasound imaging. Flow cytometry was used and a novel analysis was developed, based upon light scattering and fluorescence intensity, to quantify the fraction of microbubbles of chosen size-ranges with oligonucleotide-tethered fluorescently labeled SUVs. Fluorescence microscopy was used to verify that our methodology results in successful high-density SUV tethering to a similar fraction of the microbubbles when compared to the flow cytometry statistics. The fraction of successful tetherings increased with the concentration of the complementary lipid-linked oligonucleotide as expected and decreased with the time that microbubbles were incubated with SUVs, which was not expected. Also unexpected, a large fraction of microbubbles had only background fluorescence levels while a much smaller fraction (at most one-eighth, for the shortest incubation and highest concentration of lipid-linked oligonucleotide) had oligonucleotide-tethered fluorescently labeled SUVs and, according to our fluorescence microscopy, that small fraction was densely covered with SUVs. Ejection of the lipid-linked oligonucleotide during high surface pressure compression of the monolayer shells of actively shrinking microbubbles subjected to the Laplace overpressure is speculated as a qualitatively explanation for the statistics.
Introduction
Microbubbles (radius = 0.5–50 µm) consist of a gas-in liquid core coated by a thin shell composed of proteins, surfactants, lipopolymers, and/or lipids. Current medically related investigations on microbubbles include the design of blood-substitutes (or “oxygen carriers”), ultrasound contrast agents, and drug carriers.1, 2 A few drug carrying designs have been proposed based on the molecular properties of the therapeutic drug. Briefly, therapeutic drugs may be embedded in the lipid shell encapsulating a gas microbubble3, 4 or electrostatically adsorbed to the surface of the microbubble.3, 5–7 Kheirlomoom and coworkers8 proposed a novel design in which vesicles that could carry drugs (incorporating DSPE-PEG2000-biotin) were tethered to lipid monolayer-shelled microbubbles (incorporating DSPE-PEG2000-avidin) via avidin-biotin linkage. The authors showed that this construct has acoustic properties indistinguishable from microbubble contrast agents, including the ability to be localized by the focal point of an ultrasound beam, a property that they used to dock the microbubbles, with tethered vesicles, on a monolayer of cells. Here, we propose a new attachment design where hybridization of complementary DNA oligonucleotide sequences is used to tether vesicles to the lipid shells of microbubbles.
Yoshina-Ishii and Boxer9 reported on a novel system in which vesicles were tethered to a fluid supported lipid bilayer by lipid-linked complementary DNA oligonucleotide sequences. In their studies they demonstrated specificity of binding by showing that vesicles do not associate with the lipid bilayer unless the complementary sequence is present.9 Pairing of complementary oligonucleotides offers more flexibility in comparison to pairing of avidin to biotin. Specifically, vesicles encoded with different oligonucleotide sequences have been tethered to a supported lipid bilayer incorporating complementary sequences arranged in an array pattern.9 In addition, sequence complementarity, repetition, and length have been used to finely tune the hybridization interactions.10–12 Neither encoding nor varying of the strength of interaction are as readily accomplished in the avidin-biotin protein-based system. For biomedical uses, a DNA (vs. protein) based linkage may avoid well-known immunogenicity often associated with non-endogenous proteins or protein aggregation and misfolding.13 Immunogenicity in oligonucleotides is usually associated with introduction of non-endogenous chemical motifs and RNA oligonucleotides that trigger an innate immune response against viral infection. 13
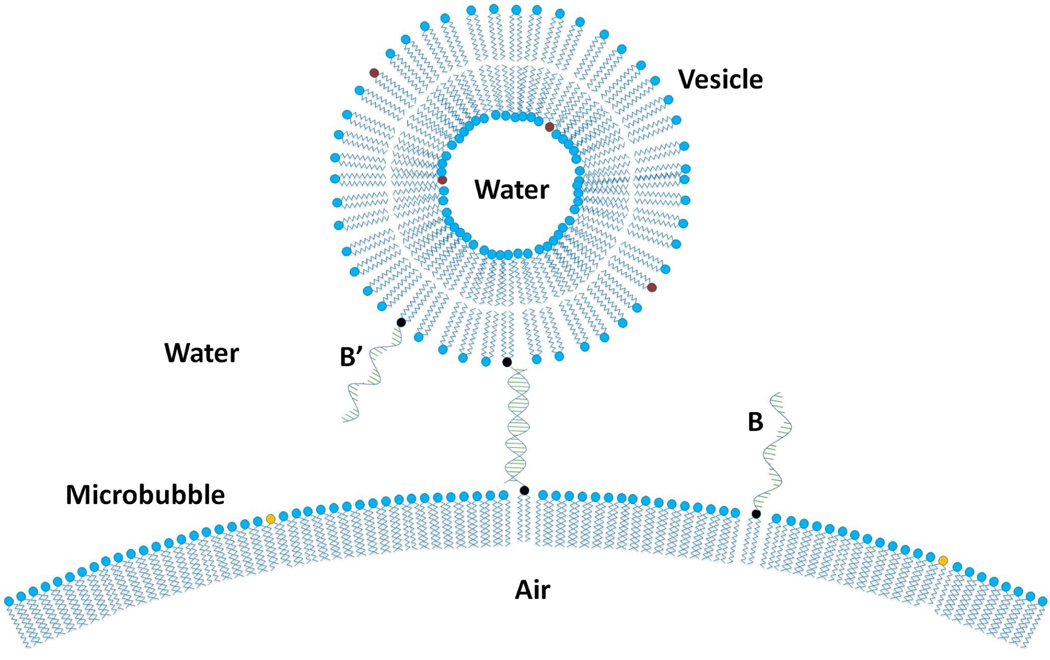
Our design incorporates a lipid-linked DNA oligonucleotide (denoted B) into the lipid monolayer-shell of an air-filled microbubble for tethering of vesicles incorporating the complementary lipid-linked DNA oligonucleotide (denoted B’) sequence. This new design is schematically represented in Figure 1. To monitor the tethering of vesicles to microbubbles via DNA hybridization, we use flow cytometry (FC). The number of applications for flow cytometry has increased recently,14–17 although it has been traditionally used in immunological studies to monitor the binding of fluorescent antibodies. The method is based upon monitoring forward and side light scattering independently, properties that have different dependences upon geometrical factors of the particles, and fluorescence intensity derived both from intrinsic fluorescence of the particle and from reflection.18 Here we develop a novel analysis that utilizes the simultaneous monitoring of forward scatter (FS), side scatter (SS), and fluorescence intensity (FI) of individual microbubbles, vesicles, and microbubbles with attached vesicles. In particular, we distinguish populations of these particles by their scattering characteristics and fluorescence intensity. We also independently monitor populations of different size ranges based upon their scattering characteristics. Compared to standard fluorescence microscopy, flow cytometry offered certain advantages; we did not need to physically separate particles that would create background fluorescence, we gathered data from sub-micron sized microbubbles (the most medically relevant population), and we rapidly developed statistics from large populations. In the present study, we investigate the tethering of small unilamellar vesicles (SUVs), composed of distearoyl phosphatidylcholine (DSPC) and the lipidic oligonucleotide, DiC18-B’, to the lipid monolayer shells encapsulating air microbubbles, composed of DSPC, dipalmitoyl phosphatidylserine (DPPS), and complimentary DiC18-B. Fluorescent probes were incorporated into the bilayers of SUVs for statistical quantification of the fraction of microbubbles with attached vesicles using flow cytometry and fluorescence microscopy.
Figure 1.
Scheme for tethering vesicles to the lipid monolayer shell of an air-microbubble via hybridization of complementary DNA oligonucleotide sequences (B and B’). The lipid bilayer of the vesicle contains the fluorescent probe DiOC18 for flow cytometry detection or TR-DHPE for fluorescence imaging. Vesicle and microbubble curvatures are not to scale.
Materials and Methods
Materials
The lipid components 1,2-Distearoyl-sn-Glycero-3-Phosphocholine (DSPC) and 1,2-Dipalmitoyl-sn-Glycero-3-[Phospho-L-Serine] (Sodium Salt) (DPPS) dissolved in chloroform (10 mg/mL) were purchased from Avanti Polar Lipids (Alabaster, AL). The fluorescent probe Texas Red 1,2-dihexadecanoyl-sn-glycero-3-phosphoethanolamine (TR-DHPE) dissolved in chloroform (2 mg/mL) and the Vibrant® 3,3'-dioctadecyloxacarbocyanine perchlorate (DiOC18) cell labeling solution (1 mM) were purchased from Invitrogen (Carlsbad, CA). All were stored in graduated screw thread glass vials with PTFE-faced silicone septa at −20 °C except for DiOC18 which was stored in its original vial at 4 °C. All were used without further purification. The DNA-lipids, DiC18-B (B=5’ TAG TAT TCA ACA TTT CCG TGT CGA 3’) and DiC18-B’ (B’=5’ TCG ACA CGG AAA TGT TGA ATA CTA 3’) were synthesized as described by Yoshina-Ishii and Boxer,19 and kindly donated by Steven G. Boxer’s laboratory, Department of Chemistry, Stanford University, California. These were lyophilized for long-term storage or hydrated with nuclease free water at desired molar concentrations for short-term use and stored in Nuclease Free 0.2 mL eppendorf tubes (Fisher Scientific, Hanover Park, IL) at −20 °C.
Preparation of Microbubbles and Vesicles
Lipid-coated microbubbles were prepared by dissolving a mixture of 98mol% DSPC and 2mol% DPPS in chloroform in a glass vial. The chloroform was then removed via solvent evaporation by nitrogen gas followed by vacuum desiccation for 10min. This produced a thin, mixed lipid film, which was then hydrated with 100 µL DiC18-B dissolved in nuclease free water (Kaysville, UT) at desired concentrations or nuclease free water for the control sample to a final DSPC/DPPS lipid concentration of 9 mg/mL.
Small unilamellar vesicles (SUVs) were prepared using DSPC dissolved in chloroform in a glass vial. For fluorescence imaging, 1 mol% TR-DHPE dissolved in chloroform was added. Solvent evaporation followed by vacuum desiccation was performed as mentioned earlier. The lipid was then hydrated with 1.6µM DiC18-B’ in nuclease free water (Kaysville, UT) solution to a final DSPC lipid concentration of 20 mg/mL. This DiC18-B’ concentration is the amount needed to contain at most one molecule per vesicle based on a Poisson distribution.
Hydrated samples were placed in a bath sonicator with heat for 1.5 h until aggregates dispersed and the solutions appeared milky. The solution for microbubble preparation was placed in the refrigerator for at least 10 min prior to production. Microbubbles were produced by mechanical agitation for 10 s with an M-250 dental amalgamator (TPC Advanced Technology, INC., Los Angeles, CA). 500 µL of nuclease free water was added to the microbubbles for ease of collection with a 1 mL pipette and transferred into 5 mL polystyrene round-bottom tubes (BD Falcon, Bedford, MA) for flow cytometry. The sample was then placed in the refrigerator for at least 5 min until all the microbubbles rose to the top. The water underneath the microbubble layer was carefully removed with a glass Pasteur pipette.
The SUV solution was prepared by tip sonication (Branson, Danbury, CT) at low power (150W) until the lipid solution appeared clear (~1–1.5 min) and immediately cooled to room temperature by running cold tap water over the exterior of the vial. For flow cytometry, the fluorescent probe DiOC18 was added to the SUV solution and allowed to incubate for 20min at room temperature. The amount of DiOC18 added was 1 µg for every 1 mg of total lipid mass.
Tethering vesicles to microbubbles
100 µL of the fluorescently labeled SUV solution and 100 µL 1.46X PBS (Phosphate Buffered Saline) in nuclease free water were then added to the microbubbles immediately after the water layer beneath the buoyant microbubble layer was carefully removed with a glass Pasteur pipette. The microbubble/vesicle solution was allowed to incubate at 4 °C for 2 h or 20 min. The vial was shaken by tapping at 30 min intervals to allow the microbubbles to mix. At the end of the incubation, the water layer containing excess vesicles underneath the buoyant microbubble layer was carefully removed with a glass Pasteur pipette and the microbubbles were resuspended with 200 µL 0.73X PBS in nuclease free water solution. Immediately prior to running the samples for fluorescence imaging or flow cytometry, the vial was vortexed for 5 s at power level 5.
Flow Cytometry
A Becton Dickinson (BD, Franklin Lakes, NJ) FACScan Flow Cytometer equipped with a single, air-cooled argon laser with 488 nm excitation was used with the following settings (Amp Gain=6.33, FL2=654 nm, and SSC=355). Data acquisition was performed using CellQuest software (BD, Franklin Lakes, NJ). Dot plots and density plots were generated by WinMDI software version 2.9 (Windows Multiple Document Interface for Flow Cytometry, The Scripps Research Institute, LaJolla, CA)
Brightfield and Fluorescence Imaging
Microbubbles were injected from a sample syringe into a laminar flow perfusion chamber (Warner Instruments, Hamden, CT) for observation. Microbubbles immediately rose to the top coverglass slip after injection into the chamber due to buoyancy. Both the top and bottom coverglass slips were coated with SurfaSil (Pierce, Rockford, IL) prior to experimentation to prevent electrostatic interactions. Microbubbles were imaged using a Nikon eclipse e400 upright epifluorescence microscope (Nikon, Melville, NY) equipped with a high resolution Orca ER digital camera (Hamamatsu, Japan).
Results and Discussion
Microbubble and Vesicle Components
In this study, we investigate the tethering of SUVs composed of DSPC and the lipidic DNA oligonucleotide, DiC18-B’, to the lipid monolayer shells of air microbubbles composed of DSPC, DPPS, and complimentary DiC18-B. DSPC was chosen as the major component for the preparation of SUVs because it resembles the major component (i.e hydrogenated soy PC) found in the FDA approved drug delivery liposome DOXIL®/Caelyx®.20 DSPC was chosen as the major component for microbubble preparation because it has been shown that long saturated acyl chains significantly reduce air permeability of lipid monolayer shells.21–23 DiC18-B’ and DiC18-B are self-inserting molecules24 and therefore, when needed, each was added when dried lipid films of DSPC or 98 mol% DSPC/2 mol % DPPS respectively were hydrated to form MLVs. Subsequently, the SUVs and microbubbles were prepared by tip sonication and mechanical agitation respectively from these MLVs. Inclusion of 10 mol% DSPE-PEG2000 to the lipid mixture generated a visibly more concentrated microbubble population (data not shown). A similar lipopolymer is included in a leading FDA approved microbubble formulation, DEFINITY®/Luminity®.25 Because of its major role as a steric stabilizer and therefore possible interference with vesicle attachment we chose to not include a lipopolymer in our formulation. Instead, it was necessary to cool the aqueous emulsifier-free lipid mixture prior to mechanical agitation to produce lipid-stabilized microbubbles. This cooling step counteracted the measured rise in temperature of 2 °C caused by frictional heating during mechanical agitation, and decreased the temperature a further 3 °C.
Analysis of bright field images (not shown) using PC Image (Scion, Frederick, MD) indicated that microbubbles (~23 °C) were generated with a mean diameter of 8.2±3.8 µm (99% of microbubbles with diameter ≤ 20 µm). The microbubbles produced here were larger than microbubbles generated from formulations containing ~10 mol% lipopolymer, an emulsifier and steric stablizer. Specifically, they were ~2X larger than microbubbles generated by tip sonication (4.0±3 µm) determined similarly from bright field images26 and ~4X larger than those generated with the FDA approved ultrasound contrast agent solution Definity® (described in the package insert as having mean diameter range 1.1 – 3.3 µm, 98% less than 10 µm, and a maximum of 20 µm) that uses mechanical agitation for 45 s for the productions of perfluoropentane-filled microbubbles.25
Flow Cytometry Data: Identifying Microbubbles vs. Vesicles
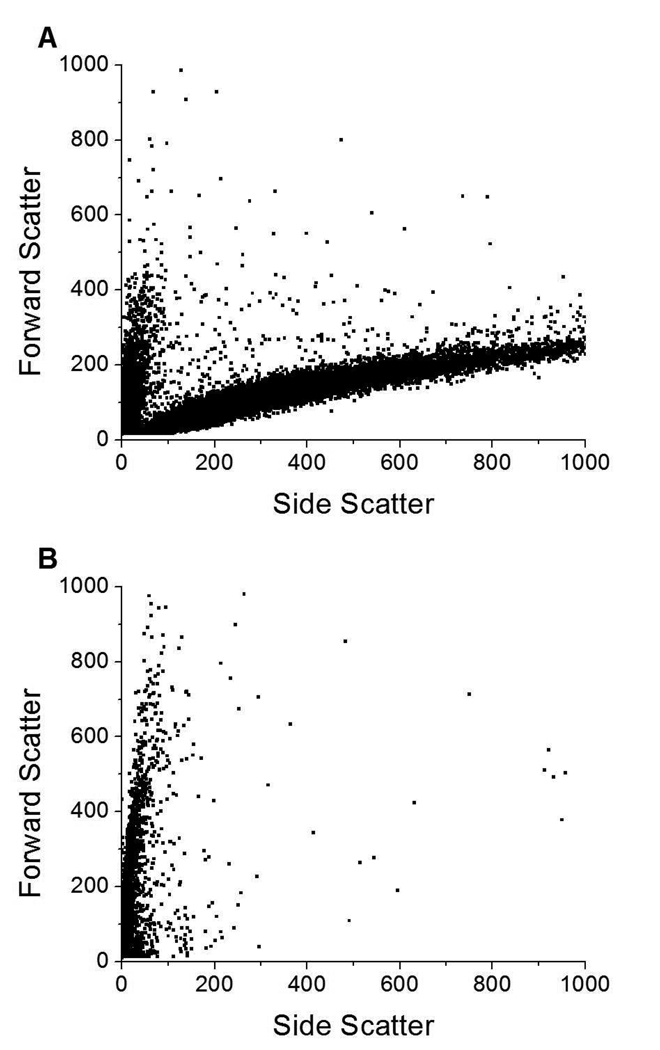
All flow cytometry data was taken at room temperature (~23 °C) A forward scatter vs. side scatter dot plot (Figure 2A) of DSPC/DPPS microbubbles revealed two populations differing in their light scattering properties, a population of low SS (and wide range of FS) and a population with a wide range of SS (and narrow range of FS). Side scattering is a multi-faceted phenomenon, which depends, amongst other characteristics, on internal granularity and surface roughness. In the submicron size range side scattering also depends upon the particle size.27, 28 Forward scattering depends upon the particle size and also the refractive index.28 FS is not directly proportional to size, particularly when the object’s size is similar to the wavelength of the laser light. These microbubbles were produced from bath sonicated vesicles, therefore these two populations of particles with very different physical properties (e.g. refractive index) and scattering properties are vesicles and lipid coated microbubbles. These two populations were quite distinct from each other except near zero FS and SS, making statistical analysis of the FC data a promising method to quantify specific tethering of fluorescent DSPC SUVs to microbubbles by DNA hybridization. A FS vs. SS dot plot (Figure 2B) of DSPC/DiC18-B’ - SUVs revealed one population of low SS. Therefore, vesicles can be identified by their low SS.
Figure 2.
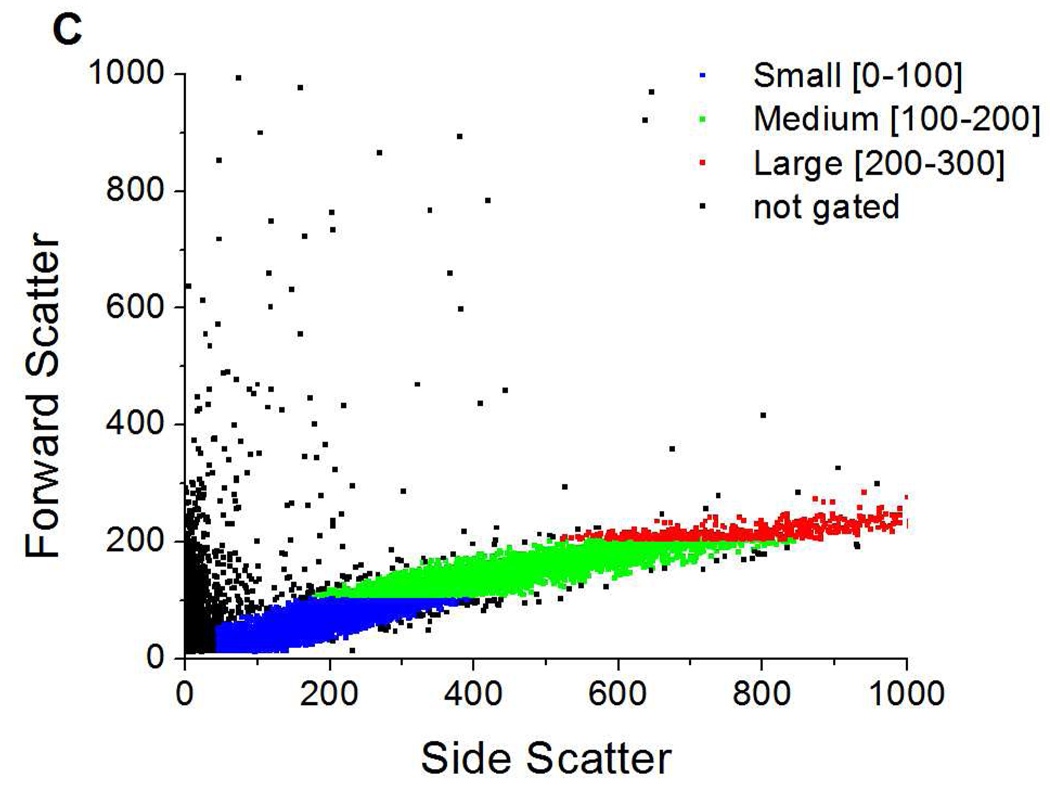
Forward vs. side scatter dot plots of A) DSPC/DPPS microbubbles; B) fluorescently labeled DSPC/DiC18-B’ small unilamellar vesicles (SUVs); and, C) DSPC/DPPS microbubbles incubated with fluorescently labeled DSPC/DiC18-B’ SUVs for 20 min (0nM DiC18-B – 20 min). Color dots indicate gates based on relative microbubble size: blue (FS = 0–100) – small, green (FS = 100–200) – medium, and red (FS = 200–300) – large. Fluorescent probe was DiOC18.
Flow Cytometry Data: Control Microbubbles Incubated with SUVs
In a control experiment incubating the DSPC/DPPS microbubbles and DSPC/DiC18-B’ SUVs for 20 min, a FS vs. SS dot plot revealed two populations, one at low SS and another at a wide range of SS (Figure 2C). The low SS population corresponded to bath sonicated vesicles used for the microbubble formation and DSPC/DiC18-B’ SUVs. By process of elimination, the other population with a wide range of SS corresponded to a control population of DSPC/DPPS microbubbles, i.e. none of the linking DiC18-B was added to this microbubble formulation. This microbubble population will be referred to as 0nM DiC18-B – 20 min.
Gating the Flow Cytometry Data to Select Microbubbles
A serpentine shape trend in FS vs. SS on a dot plot has been reported to correlate to a multimodal size distribution while a linear trend correlates to a population that approaches a normal size distribution.26 Our FS vs. SS data for microbubble populations (wide SS populations) is nearly linear as demonstrated in Figure 2A, suggesting that the microbubbles produced here by mechanical agitation generated a normal size distribution as opposed to a multimodal size distribution generated in microbubbles produced by tip sonication.26 The FS value depends upon the size of the object in a population, therefore a population can be roughly broken up into particular size ranges by gating the data based upon FS. We have done this here, primarily because the data for the middle sized population of microbubbles (FS = 100–200) gave data that was easily statistically analyzed without further gating. The three gates that were used to analyze the microbubble FS data are shown in Figure 2C as FS = 0–100 (blue), FS = 100–200 (green), and FS = 200–300 (red). The FS = 0–100 gate began at SS ~ 40 because the vesicle population overlaps the microbubble population at low SS. It will be shown later that an additional gate had to be applied to the FS = 0–100 population to eliminate aggregated vesicles from this population.
Microbubble-SUV Tethering Quantified by Flow Cytometry
Next, statistical quantification of microbubble-vesicle tethering was performed. For all of these experiments, microbubbles were selected from the FC scattering data by applying the three sizing gates (FS = 0–100, 100–200, 200–300). For each of these microbubbles, the fluorescence intensity (FI) data was obtained from the fluorescence channel of the FC.
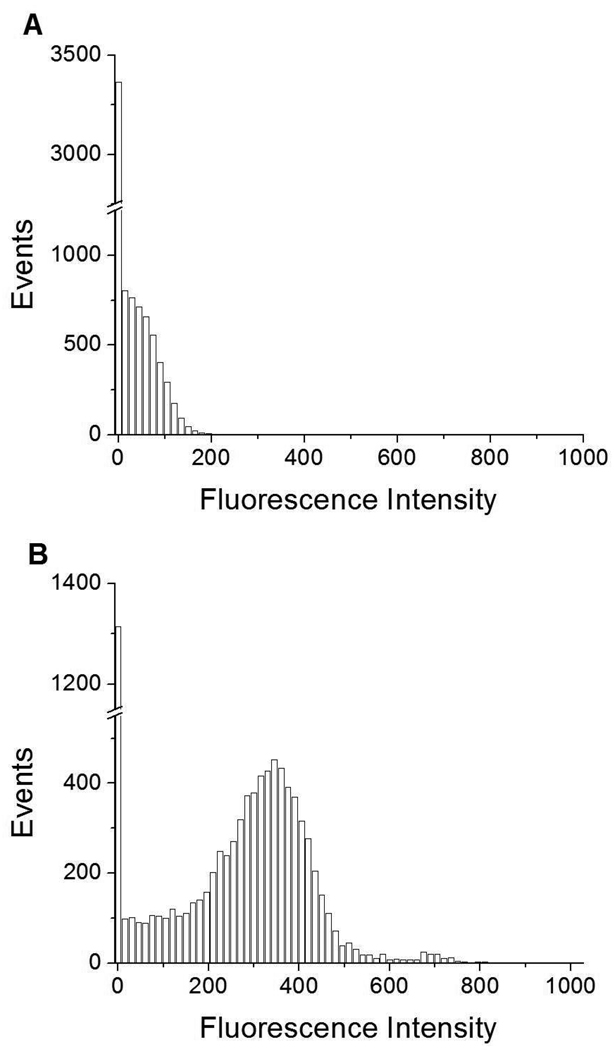
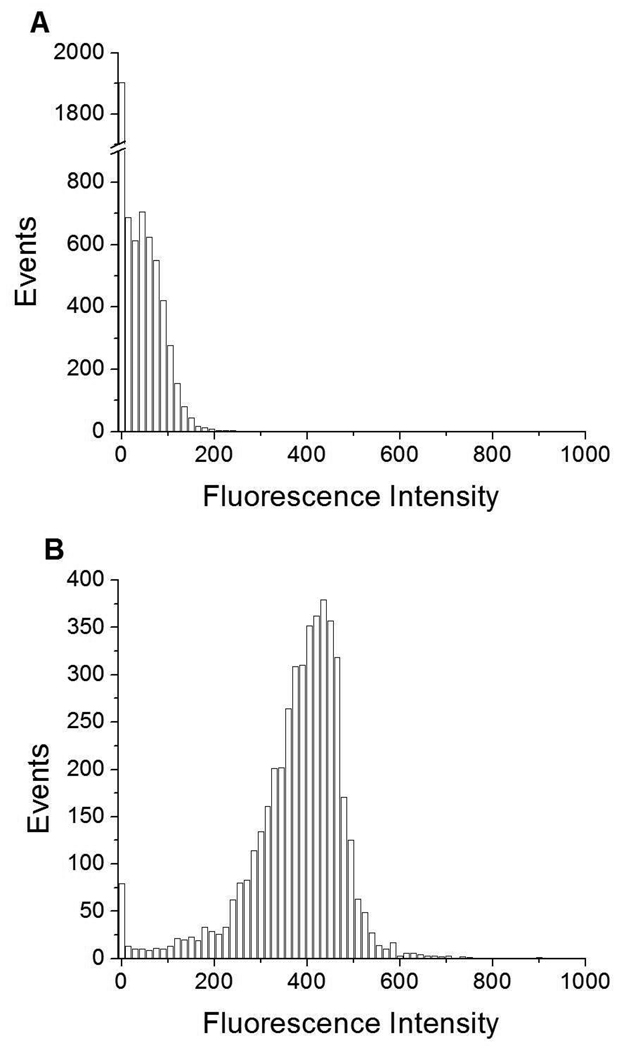
We first monitored FI for DSPC/DPPS microbubbles alone. The histograms of # events (where each event represents a microbubble) vs. FI in Figure 3A, 4A, and Figure S1A (Supporting Information) show that a unimodal distribution centered at ~ 0 FI (Peak 1) exists for these three populations (FS = 0–100, 100–200, 200–300 respectively). Since no fluorescent probe has been added at this point, the fluorescence detected originated from light that was scattered by the microbubbles into the fluorescence detector.
Figure 3.
Events vs. fluorescence intensity histograms for small-sized (FS=0–100) A) DSPC/DPPS microbubbles; and, B) DSPC/DPPS microbubbles incubated with fluorescently labeled DSPC/DiC18-B’ SUVs for 20 min (0nM DiC18-B – 20 min). Fluorescent probe was DiOC18.
Figure 4.
Events vs. fluorescence intensity histograms for medium-sized (FS=100–200) A) DSPC/DPPS microbubbles; and, B) DSPC/DPPS microbubbles incubated with fluorescently labeled DSPC/DiC18-B’ SUVs for 20 min (0nM DiC18-B – 20 min). Fluorescent probe was DiOC18.
Next, DSPC/DiC18-B’ SUVs, incorporating the self-inserting fluorescent probe DiOC18, were incubated for 2 h with DSPC/DPPS microbubbles formulated from a MLV solution containing 0, 2, 20, 40, or 200 nM DiC18-B. The 0 nM and 200 nM experiments were also incubated for a shorter period, 20 min. On average, each SUV contained one DiC18-B’. Prominent for all histograms of # events vs. fluorescence was a peak centered between 350 and 500 FI (Peak 2). This is shown in Figure 3B, 4B, and Figure S1B (Supporting Information) representing the 0nM DiC18-B – 20 min control for the three populations (FS = 0–100, 100–200, 200–300 respectively). This fluorescent population could have been formed several ways; from the nonspecific binding of DiOC18 vesicles to a fraction of microbubbles, from the close proximity of microbubbles to free fluorescently labeled vesicles yielding reflections from the microbubbles (these reflections are readily visible in a fluorescence microscope) or from the exchange of DiOC18 from the SUV solution to the monolayer of the microbubble shell. For the FS = 0–100 and FS = 100–200 gated data (Figure 3B and 4B), Peak 1 still exists to the left of Peak 2.
The histograms of # events vs. FI for the microbubble-vesicle tethering experiments displayed a final peak (Peak 3) between 550 and 750 FI. We will argue based upon the FC data and microscopy that Peak 3 corresponds to microbubbles that have multiple SUVs attached via DNA hybridization of DiC18-B to DiC18-B’ and it can be used to quantify successful microbubble-vesicle tethering.
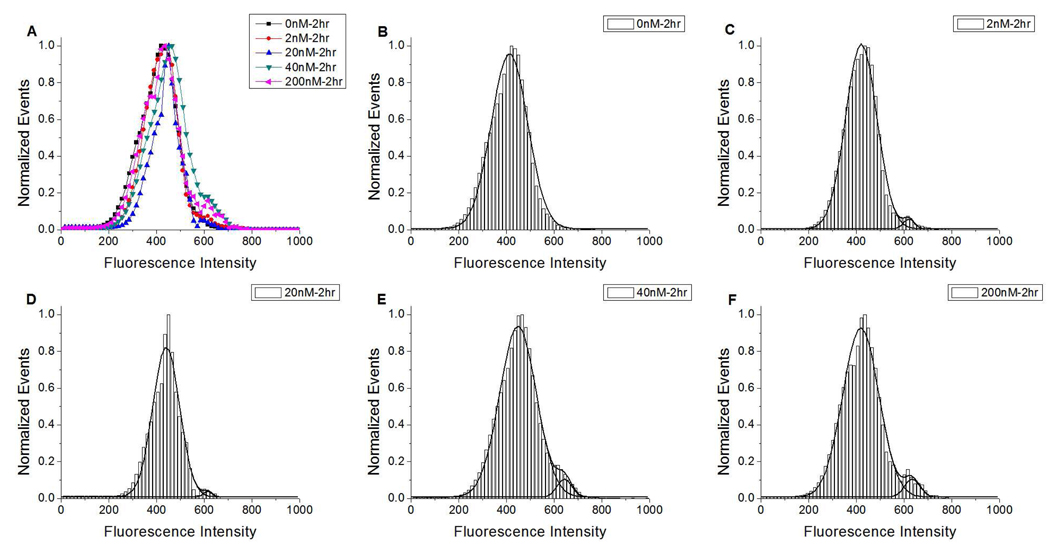
For the FS = 100–200 gated population of microbubbles, Peak 3 was absent for the 0nM DiC18-B – 20 min and 0nM DiC18-B – 2 h control conditions. Peak 3 appeared as a shoulder to Peak 2 for all other concentrations of DiC18-B and both incubation times. In order to statistically analyze the fraction of microbubbles (p) in Peak 1 through 3 of the vesicle attachment experiments, we produced histograms from all of the # events vs. FI data from each condition (usually 3 batches with 3 FC runs each for each condition). From these histograms, we normalized the # of events such that the maximum of Peak 2 was 1.0, smoothed the data by Matlab (The Math Works, Nattick, MA), and fit Gaussian functions to Peak 2 and 3 using OriginPro (OriginLab Northampton, MA). Figure 5A and 6A, where all of the smoothed data for Peak 2 and 3 are plotted, clearly shows the development of the shoulder (associated with Peak 3) with increasing concentration of DiC18-B. Data from Peak 3 is distinguished from Peak 2 in Figures 5B–F and 6B–C where Gaussian fits of Peak 2 and 3 are overlaid on the histograms The events not included in Peak 2 and 3 (not shown) were considered to comprise Peak 1.
Figure 5.
Normalized events vs. fluorescence intensity histograms for medium-sized (FS=100–200) DSPC/DPPS microbubbles prepared with increasing DiC18-B concentrations and incubated with fluorescently labeled DSPC/DiC18-B’ SUVs for 2 h. A) All histogram shapes plotted without Gaussian fits; and, histogram with Gaussian fits for B) 0, C) 2, D) 20, E) 40, and F) 200 nM DiC18-B. Fluorescent probe was DiOC18.
Figure 6.
Normalized events vs. fluorescence intensity histograms for medium sized (FS=100–200) DSPC/DPPS microbubbles prepared with 0 or 200 nM DiC18-B and incubated with fluorescently labeled DSPC/DiC18-B’ SUVs for 20 min. A) Both histogram shapes plotted without Gaussian fit; and, histogram with Gaussian fits for B) 0 and C) 200 nM DiC18-B. Fluorescent probe was DiOC18.
The number of events in each peak was used to determine the fraction of microbubbles in each population (Table 1). For the FS = 100–200 gated population of microbubbles, between 2 nM and 200 nM DiC18-B, the fraction of microbubbles in Peak 3 (p3) increased from 0.008 to 0.035 for the 2 h incubation time. The fraction of microbubbles in Peak 3 was greatly increased, to 0.121, by decreasing the incubation time of vesicles and microbubbles to 20 min. In addition, the center of the peak had increased from an average of ~ 630 FI for the 2 h incubation to a value of ~710 FI for the 20 min incubation.
Table 1.
Summary of fitting parameters (p, µ, and σ) obtained from one- or two-peak Gaussian fits to histograms in Figures 5 and 6 corresponding to medium-sized (FS=100–200) microbubbles, where p, µ, and σ represent population fraction of each peak (i.e. p1 + p2 + p3 = 1), mean fluorescence intensity (FI), and standard deviation respectively.
| DiC18-B Concentration [nM] |
µ1 FI |
p1 | µ2 ± σ2 FI |
p2 | µ3 ± σ3 FI |
p3 |
|---|---|---|---|---|---|---|
| 0 (2 h) | 0 | 0.178 | 412 ± 152 | 0.822 | / | / |
| 2 (2 h) | 0 | 0.542 | 420 ± 131 | 0.450 | 619 ± 46 | 0.008 |
| 20 (2 h) | 0 | 0.551 | 440 ± 112 | 0.444 | 614 ± 34 | 0.005 |
| 40 (2 h) | 0 | 0.573 | 448 ± 154 | 0.410 | 643 ± 61 | 0.017 |
| 200 (2 h) | 0 | 0.210 | 418 ± 152 | 0.756 | 636 ± 64 | 0.035 |
| 0 (20 min) | 0 | 0.116 | 410 ± 126 | 0.884 | / | / |
| 200 (20 min) | 0 | 0.154 | 441 ± 167 | 0.724 | 709 ± 133 | 0.121 |
An additional gate was applied to the FS = 0–100 gated population to eliminate aggregated DSPC/DiC18-B’ SUVs (labeled with DiOC18) that are evident to be present in that population. We detected their presence by looking at SS vs. FI plots of the density of events before and after the FS = 0–100 gate was applied. For SS vs. FI, before the FS = 0–100 gate was applied, three populations were clearly observed as shown in Figure S2A for the control experiment, 0nM DiC18-B – 20 min. The population with low SS values corresponds to vesicles as justified earlier. This population increased in SS at high values of FI, from 575 to 775 FI. A very similar phenomena was interpreted as aggregation in ~600 nm lipid coated silica particles.17 The other two populations have wide ranges of SS and correspond to Peak 1 and Peak 2 as justified earlier. Application of the FS = 0–100 gate as shown in Figure S2B does not eliminate all of the vesicle population, particularly corresponding to the aggregated vesicles. Note that the FI value of these aggregated vesicles is centered at approximately 700 and therefore in a histogram they create a peak centered at ~700, shown in Figure S2C, which would interfere with the analysis of Peak 3. Therefore, an additional gate, area defined in Figure S2D, was applied to all of the FS = 0–100 data which selected the microbubble population and eliminated the vesicle population as shown in Figure S2E. A histogram of the FS = 0–100 data for 0nM DiC18-B – 20 min demonstrates the presences of the peak before application of the second gate (Figure S2C) and its absence after (Figure S2F).
After application of the FS = 0–100 gate and the gate shown in Figure S2D, Peak 3 appeared as a shoulder to Peak 2, for all non-zero concentrations of DiC18-B and both incubation times. Gaussian fits were not possible with smoothed data for this data set. The unsmoothed data was compiled and fitted with Gaussian functions as described above. Figure S3 and S4 in Supporting Information show the development of Peak 3 with increasing DiC18-B and the Gaussian fits to Peak 2 and 3 for all conditions. The data is summarized in Table 2 and shows that vesicle attachment to the small-sized microbubbles (Table 2) is effective although a lower fraction of microbubbles appear to have attached vesicles compared to the medium-sized microbubbles (Table 1). Between 2 nM and 200 nM DiC18-B, the fraction of microbubbles in Peak 3 increased monotonically from 0.004 to 0.030 for the 2 h incubation time. As before, the fraction of microbubbles in Peak 3 was greatly increased, 0.088, by decreasing the incubation time of vesicles and microbubbles to 20 min. In addition, the center of the peak had increased from an average of ~590 FI for the 2 h incubation to a value of ~640 FI for the 20 min incubation.
Table 2.
Summary of fitting parameters (p, µ, and σ) obtained from one- or two-peak Gaussian fits to histograms in Figure S3 and S4 in Supporting Information corresponding to small-sized (FS=0–100) microbubbles, where p, µ, and σ represent population fraction of each peak (i.e. p1 + p2 + p3 = 1), mean fluorescence intensity (FI), and standard deviation respectively.
| DiC18-B Concentration [nM] |
µ1 ± σ1 | p1 | µ2 ± σ2 | p2 | µ3 ± σ3 | p3 |
|---|---|---|---|---|---|---|
| 0 (2 h) | 0 | 0.518 | 390±130 | 0.482 | / | / |
| 2 (2 h) | 0 | 0.514 | 390±132 | 0.482 | 593±32 | 0.004 |
| 20 (2 h) | 0 | 0.671 | 435±79 | 0.321 | 581±71 | 0.008 |
| 40 (2 h) | 0 | 0.466 | 420±150 | 0.525 | 609±60 | 0.009 |
| 200 (2 h) | 0 | 0.654 | 419±111 | 0.316 | 569±84 | 0.030 |
| 0 (20 min) | 0 | 0.350 | 345±144 | 0.650 | / | / |
| 200 (20 min) | 0 | 0.526 | 433±142 | 0.386 | 643±133 | 0.088 |
No additional gate was applied to the FS = 200–300 gated population. The 200–300 gate selects for the largest-sized microbubbles, that happen to exist as a relatively small population. The data is noisy (see Figure S5A and S6A in Supporting Information) and therefore Peak 3 can only be fit to Gaussians using unsmoothed data for the most extreme conditions, 0 nM and 200 nM of DiC18-B and both incubation times (Figure S5 B and C and S6 B and C). The data is summarized in Table S1 and qualitatively shows that vesicle attachment to the largest microbubbles is effective and accounts for at least several percent of the largest microbubbles.
Evidence for Detection of Microbubbles-SUV Tethering and Interpretation of Results
Several pieces of supporting evidence indicate that Peak 3 represents the population of microbubbles with multiple vesicles attached by oligonucleotide hybridization. First of all, the fluorescence intensity range for events (microbubbles) of Peak 3 falls close to the range for vesicle aggregates (~525–850 FI), indicating that there are two or more vesicles on these microbubbles. Secondly, with the exception of 2 nM DiC18-B – 2 h, the fraction of events (microbubbles) in Peak 3 increased monotonically with concentration of DiC18-B since more microbubbles will include this molecule, necessary for specific vesicle attachment by hybridization.
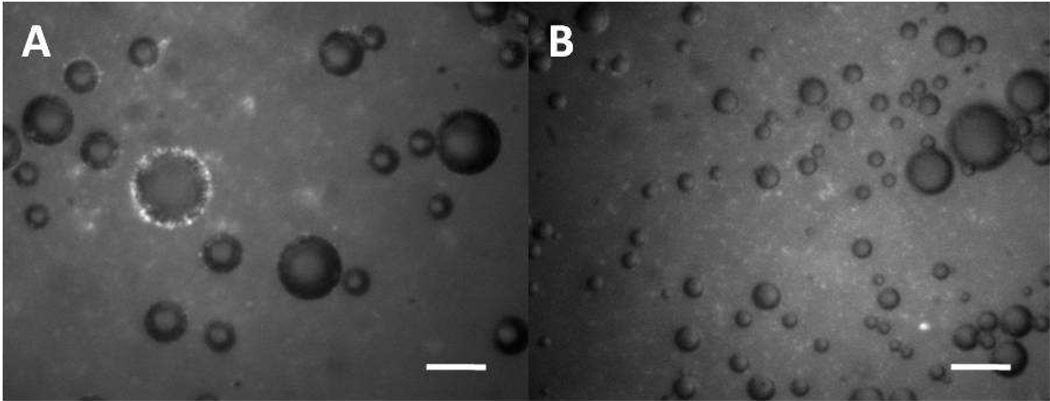
Thirdly, we performed a fluorescence microscopy experiment for 200nM DiC18-B – 2 h (~23 °C), and found that the fraction of microbubbles that were completely ringed by fluorescent SUVs was of a similar magnitude to the fraction of microbubbles found in Peak 3 by FC. SUVs were visualized by fluorescence microscopy by adding 1 mol% TR-DHPE to the lipids comprising the DSPC/DiC18-B’ SUVs. Figure 7A is a fluorescent image of microbubbles after the vesicle tethering procedure showing many fluorescent spots forming a complete ring around a microbubble. The appearance of individual spots in the ring resembles strongly the free fluorescent SUVs in solution and therefore we conclude that it is likely that they are SUVs attached to the microbubbles. These complete rings were clearly distinguishable from clusters of fluorescent SUVs that were near or touching microbubbles and therefore only microbubbles with complete rings of fluorescent SUVs were used in the statistics. For the 200nM DiC18-B – 2 h microbubbles, a fraction of approximately 0.02 (19 out of 1,100) had a complete ring of attached SUVs. Figure 7B is a fluorescence image of control microbubbles showing similar sized microbubbles and background fluorescence caused by unbound vesicles in comparison to Figure 7A. For the 0nM DiC18-B – 2 h microbubbles (~23 °C), 0.0002 (1 out of 5,000) had a complete ring of attached vesicles.
Figure 7.
A) Complete fluorescent ring of bright spots surrounding microbubble indicates dense tethering of SUVs to the lipid monolayer shell of an air-microbubble by hybridization of complementary lipid-linked DNA oligonucleotides (DiC18-B’ and DiC18-B). Conditions here correspond to 200nM DiC18-B – 2 h. B) Control containing none of the lipid-linked DNA oligonucleotide DiC18-B shows in this image no microbubbles ringed with fluorescent vesicles. Conditions here correspond to 0nM DiC18-B – 2 h. Scale bars represent 20µm.
The increase in fraction and FI of Peak 3 for a 20 min incubation compared to a 2 h incubation are indicative of increased attachment of SUVs to microbubbles via DNA hybridization with the shorter incubation time. This was unexpected since a longer incubation time should ensure more thorough mixing and a longer time to reach equilibrium. Indeed, it was also surprising in general that such a large fraction of microbubbles have only background fluorescence levels while a much lesser fraction (at most one-eighth) have attached SUVs and, according to our fluorescence microscopy, that lesser fraction may be densely covered with SUVs.
These two unexpected observations might be attributed to ejection of the DiC18-B component when the monolayer shell surface pressure, under influence of the Laplace overpressure, has exceeded the collapse pressure of the DiC18-B component. Indeed, a lipid monolayer can be subjected to more than double the surface pressure of a lipid bilayer (~30 mN/m), where these lipid-linked oligonucleotides are reported to insert essentially irreversibly.19 Lipid shelled microbubbles will shrink in size at a rate roughly inversely dependent upon the sum of the radius and the shell gas transfer resistance times water diffusivity until the monolayer surface pressure approaches ~72 mN/m, a pressure reachable by DSPC.29 This pressure corresponds to an interfacial tension of zero mN/m and zero Pa Laplace overpressure.23 During the shrinkage process, immiscible components will be ejected at their collapse surface pressure.30 Most lipids with saturated chains and very large headgroups can not withstand a surface pressure of 72 mN/m,29, 31 although many can reach high surface pressures. Therefore, it is possible that DiC18-B has been ejected from most microbubble shells so that only a small fraction of microbubble shells existing at lower surface pressures retain DiC18-B and are available for hybridization with DiC18-B’ labeled SUVs. Quantification of the ejection and indeed, mole fraction of DiC18-B incorporated into newly formed microbubbles is of interest. We have recently developed a washing step that eliminates unbound DiC18-B and lipid aggregates from the microbubble population. This step could be followed by quantification of DiC18-B to lipid ratios in microbubbles through fluorimetry if the DiC18-B and other lipids are fluorescently labeled.
Previous evidence that the average area/molecule and concomitant surface pressure of a microbubble shell can vary dramatically in a population of microbubbles is in agreement with this hypothesis.21, 32 The longer the microbubble is in existence (longer incubation), the higher will be the monolayer surface pressure, due to Laplace overpressure and therefore SUVs could be ejected via the hybridized DiC18-B anchor when its collapse surface pressure is reached, accounting for a reduced fraction of attached SUVs. For comparison to the time scales used for incubation here, 20 minutes and 2 hours, an estimate of the ejection time for an average sized (4 µm radius) microbubble can be made based upon a recent theoretical analysis by Sakar et al.33 where dissolution of similarly coated microbubbles in air-saturated media is modeled. We assume an average surface tension during dissolution of 36 mN/m and a decrease to one-fifth surface area (area change for a similar lipopolymer to reach a 5 mN/m ejection surface tension)29. Figure 8 of Sakar et al.33 gives an average dissolution rate of approximately −2.5 µm/hr, and therefore a time of approximately 1 hour for the necessary decrease in area. This estimate is in good agreement with the time scale (20 minutes – 2 hours) where a large amount of ejection appears to be taking place. In addition, a higher fraction of large microbubbles should be labeled compared to smaller microbubbles since they shrink more slowly (1/R dependence), a trend that we may be observing here since the Peak 3 fraction of the FS = 0–100 small-sized microbubbles is smaller on average compared to the FS = 100–200 medium-sized microbubbles.
Conclusions
We showed that incorporation of complementary lipid-linked DNA oligonucleotide sequences into the lipid monolayer of a microbubble and the lipid bilayer of vesicles allowed for their hybridization thus providing a new model for a drug delivery vehicle. To quantify tethering of vesicles to microbubbles of three size ranges, we developed a novel use and analysis of flow cytometry data and qualitatively verified its statistics by fluorescence microscopy. Our data suggests that the highest concentration of lipid-linked oligonucleotides (200 nM) used here is appropriate for further studies, since as many as one-eighth of the microbubbles were tethered to vesicles. These results also suggest that a short incubation time (minutes vs. hours) is preferable and that incubation time should be optimized in the future. The short incubation time is proposed to be necessary because of the Laplace overpressure that compresses the monolayer shell and ejects the lipid-linked oligonucleotide over a time period of approximately 1 hour, in agreement with a recent model. Presumably this occurs because the lipid linked oligonucleotide was not miscible with the main DSPC component of the monolayer shell. Therefore alternatively, DSPC could be substituted for another lipid in the future that is more miscible with the lipid linked oligonucleotide. Since the completion of these experiments, a monolayer study in our group of phophatidylcholines mixed with lipopolymer showed that a shorter acyl chain lipid (e.g. DPPC or DMPC) may enhance miscibility.29 Other improvements could be studied in the future such as the use of small microbubbles of enhanced stability compared to larger microbubbles,34 inclusion of a steric stabilizer such as DSPE-PEG2000, and the use of a low permeability perfluorocarbon filling gas such that a significantly shorter chain lipid such as DMPC35–37 could be substituted for DSPC.
Supplementary Material
Acknowledgements
Funding provided by a GAANN fellowship from the US Department of Education and the NSF MRSEC Program CPIMA (NSF DMR 0213618). We gratefully acknowledge donation of the lipid linked oligonucleotides ((DiC18-B’ and DiC18-B) by Steven G. Boxer as synthesized by Yee-Hung M. Chan and Bettina van Lengerich with funding provided to Boxer by NIH (GM06930). We acknowledge the UC Davis Cancer Center Shared Resources for use of the BD FACScan Flow Cytometer.
Footnotes
Supporting Information Available.
Flow cytometry data analysis for FS = 0–100 and FS = 200–300 gated data.
References
- 1.Ferrara K, Pollard R, Borden M. Annual Review of Biomedical Engineering. 2007;9:415–447. doi: 10.1146/annurev.bioeng.8.061505.095852. [DOI] [PubMed] [Google Scholar]
- 2.Unger EC, Porter T, Culp W, Labell R, Matsunaga T, Zutshi R. Advanced Drug Delivery Reviews. 2004;56:1291–1314. doi: 10.1016/j.addr.2003.12.006. [DOI] [PubMed] [Google Scholar]
- 3.Unger EC, Hersh E, Vannan M, Matsunaga T, McCreery T. Prog. Cardiovasc. Dis. 2001;44:45–54. doi: 10.1053/pcad.2001.26443. [DOI] [PubMed] [Google Scholar]
- 4.Unger EC, McCreery T, Sweitzer R, Vielhauer G, Wu G, Shen D. Academic Radiology. 1998;1:S247–S294. doi: 10.1016/s1076-6332(98)80119-0. [DOI] [PubMed] [Google Scholar]
- 5.Borden MA, Caskey CF, Little E, Gillies RJ, Ferrara KW. Langmuir. 2007;23:9401–9408. doi: 10.1021/la7009034. [DOI] [PubMed] [Google Scholar]
- 6.Vannan M, McCreery T, Li P, Han Z, Unger EC, Kuersten B, Nabel E, Rajagopalan S. J. Am. Soc. Echocardiogr. 2002;15:214–218. doi: 10.1067/mje.2002.119913. [DOI] [PubMed] [Google Scholar]
- 7.Unger EC, Hersh E, Vannan M, McCreery T. Echocardiography. 2001;18:355–361. doi: 10.1046/j.1540-8175.2001.00355.x. [DOI] [PubMed] [Google Scholar]
- 8.Kheirolomoom A, Dayton PA, Lum AFH, Little E, Paoli EE, Zheng HR, Ferrara KW. Journal of Controlled Release. 2007;118:275–284. doi: 10.1016/j.jconrel.2006.12.015. [DOI] [PMC free article] [PubMed] [Google Scholar]
- 9.Yoshina-Ishii C, Boxer S. JACS Comm. 2003;125:3696–3697. doi: 10.1021/ja029783+. [DOI] [PubMed] [Google Scholar]
- 10.Chan YHM, van Lengerich B, Boxer SG. Biointerphases. 2008;3:FA17–FA21. doi: 10.1116/1.2889062. [DOI] [PubMed] [Google Scholar]
- 11.Stengel G, Zahn R, Hook F. J. Am. Chem. Soc. 2007;129:9584. doi: 10.1021/ja073200k. [DOI] [PubMed] [Google Scholar]
- 12.Chung M, Lowe RD, Chan YHM, Ganesan PV, Boxer SG. J. Struct. Biol. 2009;168:190–199. doi: 10.1016/j.jsb.2009.06.015. [DOI] [PMC free article] [PubMed] [Google Scholar]
- 13.van de Weert M, Horn Møller E. Immunogenicity of Biopharmaceuticals: Causes, Methods to Reduce Immunogenicity, and Biosimilars. In: van de Weert M, Horn Møller E, editors. Immunogenicity of Biopharmaceuticals. New York: Springer New York; 2008. [Google Scholar]
- 14.Aharoni A, Thieme K, Chiu CPC, Buchini S, Lairson LL, Chen HM, Strynadka NCJ, Wakarchuk WW, Withers SG. Nat. Methods. 2006;3:609–614. doi: 10.1038/nmeth899. [DOI] [PubMed] [Google Scholar]
- 15.Hedhammar M, Stenvall M, Lonneborg R, Nord O, Sjolin O, Brismar H, Uhlen M, Ottosson J, Hober S. J. Biotechnol. 2005;119:133–146. doi: 10.1016/j.jbiotec.2005.03.024. [DOI] [PubMed] [Google Scholar]
- 16.Rieseberg M, Kasper C, Reardon KF, Scheper T. Appl. Microbiol. Biotechnol. 2001;56:350–360. doi: 10.1007/s002530100673. [DOI] [PubMed] [Google Scholar]
- 17.Nordlund G, Lonneborg R, Brzezinski P. Langmuir. 2009;25:4601–4606. doi: 10.1021/la8036296. [DOI] [PubMed] [Google Scholar]
- 18.Shapiro HM. Practical Flow Cytometry. 4 ed. Hoboken, NJ: Wiley-Liss; 2003. p. 681. [Google Scholar]
- 19.Yoshina-Ishii C, Miller GP, Kraft ML, Kool ET, Boxer SG. J. Am. Chem. Soc. 2005;127:1356–1357. doi: 10.1021/ja043299k. [DOI] [PubMed] [Google Scholar]
- 20.Immordino ML, Dosio F, Cattel L. Int. J. Nanomed. 2006;1:297–315. [PMC free article] [PubMed] [Google Scholar]
- 21.Lozano MM, Longo ML. Langmuir. 2009;25:3705–3712. doi: 10.1021/la803774q. [DOI] [PubMed] [Google Scholar]
- 22.Borden MA, Longo ML. J. Phys. Chem. B. 2004;108:6009–6016. [Google Scholar]
- 23.Borden MA, Longo ML. Langmuir. 2002;18:9225–9233. [Google Scholar]
- 24.Yoshina-Ishii C, Chan YHM, Johnson JM, Kung LA, Lenz P, Boxer SG. Langmuir. 2006;22:5682–5689. doi: 10.1021/la0534219. [DOI] [PMC free article] [PubMed] [Google Scholar]
- 25.Kee PH, McPherson DD. Nanoparticles in Biomedical Imaging. Vol. 102. Springer New York; 2008. Use of Acoustically Active Contrast Agents in Imaging of Inflammation and Atherosclerosis; pp. 343–368. [Google Scholar]
- 26.Feshitan JA, Chen CC, Kwan JJ, Borden MA. J. Colloid and Interface Science. 2009;329:316–324. doi: 10.1016/j.jcis.2008.09.066. [DOI] [PubMed] [Google Scholar]
- 27.Vorauer-Uhl K, Wagner A, Borth N, Katinger H. Cytometry. 2000;39:166–171. [PubMed] [Google Scholar]
- 28.Sato K, Obinata K, Sugawara T, Urabe I, Yomo T. J. Biosci. Bioeng. 2006;102:171–178. doi: 10.1263/jbb.102.171. [DOI] [PubMed] [Google Scholar]
- 29.Lozano MM, Longo ML. Soft Matter. 2009;5:1822–1834. [Google Scholar]
- 30.Birdi KS. Lipid and Biopolymer Monolayers at Liquid Interfaces. New York: Plenum Press; 1989. [Google Scholar]
- 31.Frey SL, Chi EY, Arratia C, Majewski J, Kjaer K, Lee KYC. Biophys. J. 2008;94:3047–3064. doi: 10.1529/biophysj.107.119990. [DOI] [PMC free article] [PubMed] [Google Scholar]
- 32.Borden MA, Pu G, Runner GJ, Longo ML. Colloid Surface B. 2004;35:209–223. doi: 10.1016/j.colsurfb.2004.03.007. [DOI] [PubMed] [Google Scholar]
- 33.Sarkar K, Katiyar A, Jain P. Ultrasound Med. Biol. 2009;35:1385–1396. doi: 10.1016/j.ultrasmedbio.2009.04.010. [DOI] [PMC free article] [PubMed] [Google Scholar]
- 34.Rossi S, Waton G, Krafft MP. ChemPhysChem. 2008;9:1982–1985. doi: 10.1002/cphc.200800386. [DOI] [PubMed] [Google Scholar]
- 35.Schutt EG, Klein DH, Mattrey RM, Riess JG. Angew. Chem.-Int. Edit. 2003;42:3218–3235. doi: 10.1002/anie.200200550. [DOI] [PubMed] [Google Scholar]
- 36.Riess JG. Current Opinion in Colloid & Interface Science. 2003;8:259–266. [Google Scholar]
- 37.Rossi S, Watson G, Krafft MP. Langmuir. 2010;26:1649–1655. doi: 10.1021/la9025987. [DOI] [PubMed] [Google Scholar]
Associated Data
This section collects any data citations, data availability statements, or supplementary materials included in this article.


