

Abstract
Larger Error-Related Negativities (ERNs) have been consistently found in Obsessive Compulsive Disorder (OCD) patients, and are thought to reflect the activities of a hyperactive cortico-striatal circuit during action monitoring. We previously observed that OC symptomatic students (non-patients) have larger ERNs during errors in a response competition task, yet smaller ERNs in a reinforcement learning task. The finding of a task-specific dissociation suggests that distinct yet partially overlapping medio-frontal systems underlie the ERN in different tasks, and that OC symptoms are associated with functional differences in these systems. Here, we used EEG source localization to identify why OC symptoms are associated with hyperactive ERNs to errors yet hypoactive ERNs when selecting maladaptive actions. At rest, OC symptomatology predicted greater activity in rostral anterior cingulate cortex (rACC) and lower activity in dorsal anterior cingulate cortex (dACC). When compared to a group with low OC symptom scores, the high OC group had greater rACC reactivity during errors in the response competition task and less deactivation of dACC activity during errors in the reinforcement learning task. The degree of activation in these areas correlated with ERN amplitudes during both tasks in the high OC group, but not in the low group. Interactive ACC systems associated avoidance of maladaptive actions were intact in the high OC group, but were related to poorer performance on a third task: probabilistic reversal learning. These novel findings link both tonic and phasic activities in the ACC to action monitoring alterations, including dissociation in performance deficits, in OC symptomatic participants.
Keywords: ERN, LORETA, Anterior Cingulate, OCD, Reinforcement Learning, EEG
Neuroimaging investigations have implicated a hyperactive cortico-striatal circuit in the etiology of Obsessive-Compulsive Disorder (OCD). OCD patients are characterized by greater resting striatal dopaminergic tone and heightened ventro-medial prefrontal cortex (vmPFC) and anterior cingulate cortex (ACC) metabolism, which often correlate with the severity of obsessive symptomatology (Cavedini, et al. 2006; Denys, et al. 2004a; Denys, et al. 2004b; Hesse, et al. 2005; van der Wee, et al. 2004), and which resolve after successful treatment (Perani, et al. 1995). Presentation of stimuli that are consistent with individual OC patient concerns is associated with greater activity in striatum, vmPFC, and ACC, which often correlate with anxiety scores (Adler, et al. 2000; Chen, et al. 2004; Cottraux, et al. 1996; Mataix-Cols, et al. 2004; Nakao, et al. 2005b; Rauch, et al. 1994; Rosenberg and Keshavan 1998) and resolve after successful treatment (Nakao, et al. 2005b). The functional implications of a hyperactive cortico-striatal circuit in OCD have been examined using tasks that challenge action monitoring processes. The term action monitoring refers to the processes of error detection and conflict monitoring during goal-directed responses, processes that are strongly associated with ACC functioning (Botvinick, et al. 2001).
Although it is assumed that investigations of hyperactive resting metabolism and altered action monitoring may help identify the aberrant neural systems underlying the intrusive thoughts and repetitive behaviors that characterize OCD, there has been little emphasis on understanding how tonic (resting) and phasic (event-related) brain activities relate to each other – even within normative samples. For example, it is possible that dissociation in phasic error signals does not reflect altered action monitoring per se, but rather are reflective of differential tonic activities in the underlying neural systems. Here, we extend findings from our previous study that discovered task dissociation in neuroelectric reflections of internal error signaling in OC symptomatic students with no differences in performance (Gründler, et al. 2009). This current investigation used EEG source localization to link tonic and phasic activities in the ACC to dissociations in both error signaling and task performance in OC symptomatic participants. The findings suggest that phasic brain responses may be reflective of both tonic levels of activity and altered performance abilities, but the choice of task is crucial when determining the difference.
Committing Errors
Larger response-related frontocentral voltage deflections in the EEG following error commission, termed error-related negativities (ERNs), have also been consistently found in OCD patients (Endrass, et al. 2008; Gehring, et al. 2000; Hajcak, et al. 2008; Johannes, et al. 2001; Ruchsow, et al. 2005), and in highly symptomatic non-patients (Gründler, et al. 2009; Hajcak and Simons 2002; Santesso, et al. 2006). EEG source localization and EEG-informed functional Magnetic Resonance Imaging (fMRI) have both implicated the dorsal ACC (dACC) as the proposed neural generator of the ERN during response errors (Debener, et al. 2005; Ullsperger and von Cramon 2004), although rostral areas of the ACC (rACC) have been proposed to contribute to this signal as well (Luu, et al. 2003). Functional Magnetic Resonance Imaging (fMRI) investigations have revealed that rACC areas are more active in OCD patients than controls following error commission (Fitzgerald, et al. 2005; Maltby, et al. 2005; Ursu, et al. 2003). Converging evidence suggests that the neural reaction to error commission reflects a hyperactive ACC in OCD patients, yet EEG studies have never investigated the source-localized influence of ACC sub-regions as a contributing factor to larger ERNs in OCD patients.
Learning to Avoid Errors
Our previous investigation revealed that the relationship between medio-frontal activation and action monitoring in OC symptomatic non-patients is task-dependent, with larger ERNs to errors in a response competition task, and smaller ERNs to sub-optimal choices in a probabilistic reinforcement learning task (Gründler, et al. 2009). This pattern of results implicates potentially dissociable neural systems underlying suboptimal choices during reinforcement learning compared to motor errors of commission; where OC symptoms appear to reflect dissociation in the functioning of these systems. In reinforcement learning tasks, larger error signals have been associated with a greater tendency to learn to avoid selecting actions that have probabilistically led to negative outcomes, sometimes termed NoGo learning (Frank, et al. 2007; Frank, et al. 2004; Frank, et al. 2005; Holroyd and Coles 2002). Although the direct correlation between individual differences in ERN amplitude and NoGo learning (Frank, et al. 2007; Frank, et al. 2005) was replicated in our earlier investigation (Gründler, et al. 2009), there were no relationships between NoGo performance and OC symptomatology.
In fact, despite reliable findings of differences in brain activity between OC patients and controls, differences in behavioral performance are rare in action monitoring and reinforcement learning tasks (Endrass, et al. 2008; Gehring, et al. 2000; Hajcak, et al. 2008; Hajcak and Simons 2002; Johannes, et al. 2001; Maltby, et al. 2005; Ruchsow, et al. 2005; Ursu, et al. 2003; but see: Fitzgerald, et al. 2005). In contrast to slow probabilistic integration of punishment cues over multiple trials (NoGo learning), OCD patients have shown deficits in learning to rapidly overcome goal-directed stimulus-response relationships during probabilistic reversal learning (Chamberlain, et al. 2008; Kim, et al. 2003; Remijnse, et al. 2006; Valerius, et al. 2008). Probabilistic reversal learning is characterized by the sudden reversal of a probabilistically learned relationship of value between stimuli, requiring higher level cognitive control, response inhibition, and attention to error feedback to flexibly alter behavior (Cools, et al. 2002). A probabilistic learning task was included in Study II of our previous investigation (Gründler, et al. 2009), with the results of that task presented for the first time in the present report. Since no study measuring the ERN has investigated probabilistic reversal learning in OCD, this approach offers the opportunity to extend investigations of ACC action monitoring systems with a task known to be affected by OCD.
The Current Investigation
Here we extend our prior ERP findings (Gründler, et al. 2009) by applying an EEG source localization method known as Standardized Low Resonance Electrical Tomography Analysis (sLORETA) (Pascual-Marqui 2002) to investigate how tonic (resting) and phasic (error-related) activities in the medial PFC are affected by obsessive compulsive symptomatology. Unlike some methods of dipole fitting, sLORETA represents the smoothest distribution of source activities without a priori user specification. We investigated the correlations between source-localized activity in rACC and dACC with ERN amplitudes from both the response competition and reinforcement learning tasks. Both sLORETA Regions of Interest and ERN amplitudes were used to predict individual differences in avoidance (NoGo) and reversal learning in High and Low OC groups.
Methods
Participants
Data for this investigation were taken from the two studies described in our previous report (Gründler, et al. 2009), which have been combined for this investigation. All participants gave informed consent and the research ethics committee of the University of Arizona approved both studies. Participants were recruited from pretest materials given to undergraduate students in introductory psychology classes. For each Study, more than 1000 students completed the Obsessive Compulsive Inventory – Revised (Foa, et al. 2002). Participants over the entire range of the OCI-R scores were recruited for the studies. The recommended clinical significant cutoff score of 21 (Foa, et al. 2002) was used to create a High (>20) and a Low (<21) OC group (High M=37.9 SD= 9.95; Low M=8.12 SD=5.65).
Participants were excluded from analyses if they had a history of neurological disease or head trauma, current use of psychoactive medications, or if there was a change in their OCI-R score between the experimental session and the recruitment score which resulted in a change in OC grouping criterion. Following these exclusion criterion, resting EEG data were available from 107 young adults (37 High and 70 Low). Additional exclusion criteria (see ERP Data Processing below) resulted in probabilistic learning ERP data from 70 young adults (24 High and 46 Low), with sLORETA images for 66 of these participants (23 High and 43 Low). Flanker task data were collected for only a subset of subjects, resulting in ERP data and sLORETA images available from 34 (16 High and 18 Low) participants.
Tasks
First, all participants sat in a resting state while EEG activity was recorded. In both studies, participants rested while one minute segments of alternating eyes open or eyes closed EEG data were recorded. Participants in Study I rested for four minutes then performed the probabilistic learning task two times with different pseudo-randomly assigned character sets. Behavioral and EEG data were computed over the average of the combined tasks. In Study II, participants rested for six minutes, then performed a variant of the Erikson flanker task and one session of the probabilistic learning task followed by a reversal learning task. For the purposes of this investigation, data from Studies I and II (resting, probabilistic learning) have been combined, although some data were only gathered during Study II (flanker task, probabilistic reversal learning task). See Figure 1 for a visual depiction of all tasks.
Figure 1.

Examples of tasks. Probabilistic learning: during training, each pair is presented separately. Participants have to select one of the two stimuli, slowly integrating ‘Correct’ and ‘Incorrect’ feedback (each stimulus has a unique probabilistic chance of being ‘Correct’) in order to maximize their accuracy. During the testing phase, each stimulus is paired with all other stimuli and participants must choose the best one, without the aid of feedback. Note that the letter and percentage are not presented to the participant, nor are the example boxes surrounding the choice. An example ERN is shown to a suboptimal choice during testing. Flankers task: the center letter must be identified with a button press (i.e.: right button for ‘F’, left button for ‘E’); errors of motor commission elicit an ERN. Probabilistic reversal learning: this task is similar to the training phase of the probabilistic learning task, but after four consecutive identifications of the optimal stimulus (‘A’), the probabilities switch and the alternative (‘B’) becomes the optimal choice.
The probabilistic learning task consisted of a forced choice training phase consisting of up to six blocks of sixty trials each, followed by a subsequent testing phase (Frank, et al., 2004). During the training phase the participants were presented with three stimulus pairs (termed AB, CD, EF pairs). Each stimulus was associated with a different probabilistic chance of receiving ‘Correct’ or ‘Incorrect’ feedback (See Figure 1 for feedback probabilities). The participants underwent training trials (consisting of one to six blocks of sixty stimuli each) until they reached a minimum criterion of choosing the probabilistically best stimulus in each pair (AB ≥ 65%, CD ≥ 60%, and EF ≥ 50% correct choices). For each pair, the decision to reliably choose a stimulus (i.e. A over B) can be derived by either learning that the choice of stimulus A is correct (Go learning) or by learning that the choice of stimulus B is incorrect (NoGo learning), or some degree of both.
To test whether the participants learned more from positive or negative feedback, a testing phase followed the training phase. During the testing phase all possible stimulus pairs (ie. AD, CF, etc.) were presented eight times (120 trials total) and no feedback was provided. Thus, each pair had an optimal and suboptimal response based on what was learned during the training phase. ERP data were taken from the responses in this testing phase. Measures of reward seeking (Go learning) and punishment avoidance (NoGo learning) were also taken from this test phase. Go learning was defined as the percent of the choices of the A stimulus over C,D,E and F stimuli, where NoGo learning was defined as the percent of choices of C,D,E and F over B (Frank, et al. 2007; Frank, et al. 2005). A measure of valenced learning bias was computed as the difference of Go accuracy minus NoGo accuracy, with more positive scores reflecting a tendency to learn more from Go over NoGo.
In Study II, participants completed a modified Erikson flankers task. Each trial (400 total) on this speeded response task requires the participant to press one of two response buttons in order to identify the center letter in a string that is either congruent (i.e. MMMMM or NNNNN) or incongruent (i.e. NNMNN or MMNMM) from the flankers. Errors are likely to occur on incongruent trials due to increased response competition. Participants in Study II additionally performed a reversal learning task at the end of the probabilistic learning task. This reversal learning task used the ‘A’ and ‘B’ stimuli (80% and 20% correct) from the probabilistic learning task in order to examine reversals from a relatively well-learned stimulus response pair. Instructions indicated that the participant should try to choose the correct stimulus, but that the computer might change which stimulus was correct - so they should try to keep up. There were 60 forced-choice trials in total, with feedback and timing parameters identical to the probabilistic learning task. Reversals occurred after the participant chose the optimal stimulus (80%) four consecutive times (regardless of feedback), upon which time the probabilities in the next trial were reversed for each stimulus (‘A’ went from 80% to 20% correct, and visa versa). The total number of stimulus value reversals over the 60 trial block was used as an index of reversal learning success.
EEG Recording
Scalp voltage was measured using 62 Ag/AgCl electrodes referenced to a site between Cz and CPz using a Neuroscan Synamps2 system. Additionally, two mastoid channels were recorded, as were separate bipolar channels for recording horizontal and vertical eye movements. EEG was recorded continuously in DC mode with a low-pass hardware filter at 100 Hz for Study I and in AC mode with bandpass filter (0.5–100 Hz) for Study II. Both studies used a sampling rate of 500Hz, impedances were kept under 10 kΩ. All EEG data from Study I were high-pass filtered at .05 Hz before analyses.
Response-Locked ERPs
Response-locked EEG epochs were taken for optimal and suboptimal choices during the test phase in the probabilistic learning task, and for correct and erroneous choices in the flanker task (as detailed in Gründler, et al. 2009). All EEG epochs were re-referenced to linked mastoids, eyeblinks were corrected using a regression method (Semlitsch, et al. 1986), and epochs were averaged for each condition and task. For the quantification of the response-related ERPs, raw data were filtered from 0.5–15 Hz (96 dB/octave) prior to epoching, baseline corrected from −100 to 0 ms, followed by trough-to-peak measurements (trough: largest negativity within 0 to 120 ms, peak: largest positivity in the prior 120 ms) to determine baseline-independent amplitudes by subtracting the amplitude of the ERN trough from the preceding peak, with the primary interest at the Cz electrode. Thus a more positive value indicates a larger ERN.
sLORETA Processing
Two minutes of eyes closed rest were epoched into non-overlapping 2.048 second epochs for each participant. These epochs were then cleaned of eyeblink and muscle artifacts using Independent Components Analysis from the EEGLab toolbox (Delorme and Makeig 2004). All cleaned, resting epochs were spectrally transformed in sLORETA using stationary Fast Fourier Transformation (see Frei et al. (2001) for more information) with frequency windows for the following bands: delta (1.5–4 Hz), theta (4–8 Hz), alpha1 (8–10 Hz), alpha2 (10–12 Hz), beta1 (12–20 Hz), beta2 (20–30 Hz), gamma (30–50 Hz), and global (1.5–50 Hz). Three dimensional current density estimates for the average power within each band were then computed. All data were normalized within-subjects prior to statistical testing. Resting current density power correlates of the OCI-R were run using the non-parametric statistical package in the sLORETA module, which displays statistical results over the entire cortex exceeding a p<.05 threshold of statistical significance.
Response-locked epochs (−300 to 300 ms) surrounding error (ERN) and correct (CRN) responses for the probabilistic learning task and flankers task were eyeblink corrected (Semlitsch, et al. 1986), averaged within each condition, and then converted to sLORETA estimates of 3D current density. Four participants were removed from the probabilistic learning task ERP data set prior to sLORETA transformation due to excessive artifact or bad electrodes in sites other than Cz. All data were normalized within-subjects prior to statistical testing, which were performed within 50ms windows surrounding the peak of each error and correct response-related ERP (flankers: 66–106 ms; probabilistic learning: 76–126 ms). Current density power differences were computed within groups for error > correct contrasts. Additionally, this within-subject accuracy difference contrast (error > correct) was tested between groups in a mixed model fashion using the non-parametric statistical package in the sLORETA module.
Methods for sLORETA Region of Interest (ROI) analyses were determined for subregions of the ACC using custom Matlab (The MathWorks; Natick, MA) scripts, largely following the methods of (Pizzagalli, et al. 2006). Power in all 6239 voxels was normalized to a power of 1 and log transformed at each time point. ROI values thus reflect the log transformed fraction of total power across all voxels, separately for each frequency band. Voxels within Brodmann Areas (BA) 24 and 32 were split into rostral and dorsal areas using the following determination: dorsal ACC = z > 15 and y < 35, else rostral ACC. Activity at each time point in these rACC and dACC ROIs was averaged together for resting data, and within the same 50ms window surrounding the peak of each error and correct ERP that was used for whole-brain contrasts.
Statistical Analyses
Behavioral data from the probabilistic learning and the probabilistic reversal learning tasks were only used in participants who were able to choose the most rewarding stimulus (A) over the least rewarding stimulus (B) more than 50% of the time during the test phase, since data from participants who fail this basic criterion are not interpretable (Frank, et al. 2007; Frank, et al. 2004; Frank, et al. 2005). This criterion removed 25 participants from the final analyses. In addition to the exclusion criterion for behavioral performance, participants were excluded from task-related EEG analyses if there were fewer than 30 EEG epochs in any condition (this excluded an additional 14 participants). Note that all methods used for behavioral and ERP measures are identical with our previous report; except whereas the previous report used difference wave (ERN-CRN) amplitudes, this report utilizes the raw ERN and CRN ERPs.
Separate 2 (ROI: rACC, dACC) * 2 (Group: High OCI-R, Low OCI-R) ANOVAs were used to test for group differences in rACC and dACC power at rest. Separate 2 (Accuracy: Error, Correct) * 2 (ROI: rACC, dACC) * 2 (Group: High OCI-R, Low OCI-R) ANOVAs were used to test for group differences in error-specific ACC sub-region activation; planned comparisons were used to decompose significant high-level interactions. Fisher’s z tests were used to test the difference between correlations. Effect sizes are reported as partial η2 for ANOVA interactions, Cohen’s d for t-tests and R2 for correlations.
Results
Performance and ERPs
The results presentation begins with a review of key findings that were previously reported (Gründler, et al. 2009) and that are summarized in Figure 2. There were no significant group differences or correlations with the OCI-R on the probabilistic learning performance measurements of test accuracy, test reaction time (RT), Go accuracy, Go RT, NoGo accuracy, NoGo RT, learning bias (Go-NoGo), or length of training. There were no significant group differences or correlations with the OCI-R on the flanker task performance measures of correct RT, error RT, error rate, post-error RT slowing, or percent of errors that were self-corrected. Additionally, there were no significant group differences or correlations with the OCI-R with the number of ERN epochs included in ERP/sLORETA analyses1.
Figure 2.
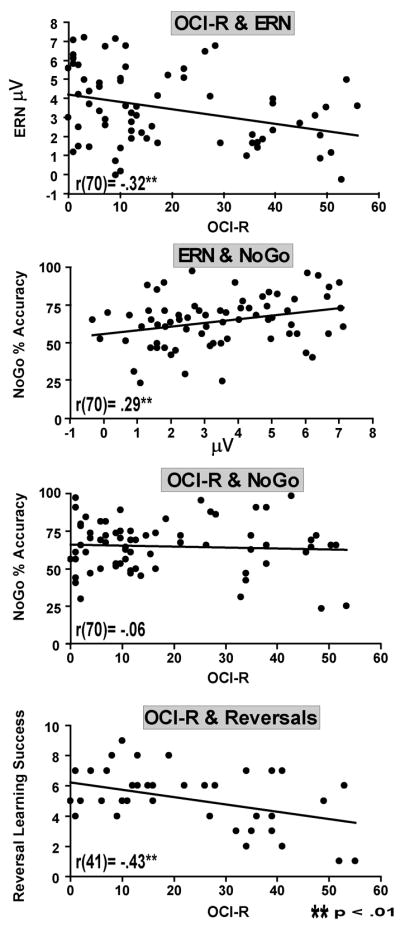
In the probabilistic learning task, OCI-R score is inversely correlated with ERN amplitude, and ERN amplitude is correlated with punishment avoidance (NoGo accuracy), but there is no relationship between OCI-R score and NoGo accuracy. However, there was a relationship between higher OCI-R score and poorer reversal learning.
Each task elicited a larger response-related voltage negativity on error trials compared to correct trials (probabilistic learning ERN>CRN: t(69)=3.10, p<.01, d= .40; flankers ERN>CRN: t(35)=8.44, p<.01, d= 1.35). ERN amplitudes in the flankers task were larger in the High OCI-R group than the Low OCI-R group (t(32)=2.24, p<05, d= .75). Conversely, probabilistic learning task ERN amplitude was negatively correlated with OCI-R score (r(70)= −.32, p<.01, R2= .10). ERN amplitudes were positively correlated with NoGo accuracy (r(70)= .29, p<.01, R2= .08), but there was no relationship between OCI-R score and NoGo accuracy (r(70)= −.06)2, nor was there evidence for an interaction between OCI-R score and the relationship between ERN amplitude and NoGo accuracy (F<1). This task dissociation in ERN amplitude was detailed in our previous report (Gründler, et al. 2009), as was the lack of behavioral differences between groups even in the presence of altered ERN amplitudes (See Figure 1).
The only performance metric that differed as a function of OCI-R score occurred in the probabilistic reversal learning task, which we report here for the first time. There was a negative correlation between OCI-R score and the number of successful reversals (r(41) = −.43, p<.01, R2= .18; Group differences: t(39)= 3.02, p<.01, d= .97 [Low M=5.9, SD=1.4 High: M=4.3, SD=2.1]). Reversal learning success was significantly correlated with NoGo accuracy (r(41) = .35, p<.05, R2= .12) but not Go accuracy (r(41) = .02, p>.05). Although individual differences in avoidance and reversal learning acuities were related, OC symptoms were only related to reversal (not NoGo) performance.
Resting EEG
Figure 3 shows the correlation between OCI-R score and resting EEG power, where non-parametric permutation tests and ROI analyses reveal that current density in the medial frontal cortex varies as a function of obsessive compulsive symptomatology: with greater activity in vmPFC, including rACC, and lower activity in dorsomedial PFC (dmPFC), including dACC. A Group * ROI ANOVA revealed a significant interaction, such that the High group was characterized by greater rACC and lower dACC global power at rest compared to the Low group (F(1,105)=4.26, p<.05, partial η2= .04; absent any simple main effects for Group, p>.05). These global power differences varied within distinct frequency bands. Both non-parametric permutation tests and ROI correlations both reveal that increased OCI-R score correlated with increased rACC power in low frequency bands and decreased dACC power in faster frequency bands. Although the OCI-R scores were highly co-linear with Beck Depression Inventory (BDI) scores (r(107)=.53, p<.01, R2=.28), all significant OCI-R - ROI correlations remain significant when accounting for variance due to BDI in a regression model. In summary, individuals with elevated OCI-R scores demonstrate greater activity at rest in vmPFC, including rACC, and lower activity in dmPFC, including dACC3.
Figure 3. Resting EEG.

sLORETA figures show non-parametric correlation tests of OCI-R score and resting EEG band power. Hotter or cooler colors indicate statistical thresholds for voxels which were positively or negatively correlated with the OCI-R, respectively. All slices are x = −5, and approximate Region of Interest (ROI) masks are drawn over the global power slice. Whole brain analyses show greater ventromedial PFC and lower dorsomedial PFC global power activities with increasing OCI-R score. ROI analyses demonstrate the significant interaction whereby the High OCI-R group is characterized by greater rACC and lower dACC power at rest. Below, these effects are expanded for each discrete frequency band. Both whole brain and ROI correlations show increased vmPFC/rACC activity in slow frequencies and decreased dmPFC/dACC activity in faster frequencies as a function of OCI-R score.
Flankers Task
Figure 4 shows the flanker task ERPs, sLORETA images, and ROI values for the error-correct difference. Non-parametric permutation tests reveal a large area in dmPFC (BA6, BA8, and dACC) that are more active during errors than correct trials. Between group comparisons of the error-correct contrast reveal that the High group is characterized by relatively greater vmPFC activity, including rACC activity, than the Low group.
Figure 4.

Flankers task. All ROI values, sLORETA statistical threshold images (x = −5), and headmaps (+/− 10 μV) are shown for the time range in the highlighted window over the ERPs. Errors are associated with an increase in dACC power, yet the High OCI-R group is characterized by greater vmPFC/rACC activity than the Low OCI-R group in the error-correct contrast. In the High group, greater rACC reactivity to errors correlates with larger ERN amplitudes.
An Accuracy * ROI * Group ANOVA revealed a significant Accuracy * ROI interaction (F(1,32)=21.28, p<.01, eta2 = .40), with no main effects or interactions with group. Contrasts revealed a difference in Accuracy conditions in the dACC ROI only (F=8.36, p<.01), where dACC power was increased in both groups following errors (see Figure 4). Dorsal ACC power significantly correlated with ERN amplitude (r(34)= .34, p= .05, R2= .12), with no evidence for an interaction between group and the relationship between dACC power and ERN amplitude (F<1). In line with the permutation test findings of increased rACC power, only the High group was characterized by a correlation between rACC ROI power and ERN amplitude (r(16)= .53, p<.05, R2= .28), a relationship that was not found in the Low group (r(18)= .03, p=.90)4. In summary, dACC power was increased following errors, and dACC power correlated with ERN amplitude in all participants. Group differences were only apparent in the rACC ROI, where the sLORETA contrasts reveal that the High OC group had relatively greater vmPFC/rACC power, and where greater rACC ROI power correlated with larger ERN amplitudes in the High group only.
Probabilistic Learning Task
Figure 5 shows the Probabilistic Learning task ERPs, sLORETA images, and ROI values for the error-correct difference. Non-parametric permutation tests revealed minor differences between error and correct trials, mainly in the Low group where activity was lower on error trials in parts of the dACC, posterior cingulate, and medial BA6. Between group comparisons of the error-correct contrast reveal that the High group was characterized by relatively greater dACC activity than the Low group, although this could be alternatively be characterized as a lack of deactivation in dACC regions, given the error-related dACC deactivation observed in the Low group.
Figure 5.

Probabilistic learning task. All ROI values, sLORETA statistical threshold images (x = −5), and headmaps (+/− 4 μV) are shown for the time range in the highlighted window over the ERPs. Errors are associated with reciprocal activation in ACC sub-regions (lower dACC, higher rACC) in the Low group only; this pattern is not seen in the High group. The High OCI-R group is characterized by greater dACC activity than the Low OCI-R group in the error-correct contrast (although this pattern is likely reflective of a lack of deactivation). Whereas increased rACC activity correlates with ERN amplitude in the Low group, the degree of dACC deactivation correlates with ERN amplitude in the High group.
A significant Accuracy * ROI * Group 3-way interaction (F(1,64)=3.92, p=.05, partial eta2 = .06) revealed evidence of group differences in error-related ACC sub-region activation. Separate Accuracy * ROI ANOVAs reveal that only the Low group was characterized by error-specific reciprocal ROI activities of increased rACC and decreased dACC, as demonstrated by an Accuracy * ROI interaction (F(1,42)=12.41, p<.01, partial eta2=.23; absent any simple main effects for Accuracy, p>.05), a pattern that was not seen in the High group (F<1). The two groups also display opposite relationships between ACC activity and ERN amplitude: whereas increased rACC activity in the Low group correlates with larger ERN amplitudes (r(43)= .34, p<.05, R2= .12), dACC deactivation in the High group correlates with larger ERN amplitudes (r(23)= −.40, p=.05, R2= .16). This latter correlation suggests that the lack of dACC deactivation in the High OCI-R group may be directly related to the smaller ERN amplitudes observed in the probabilistic learning task.
Brain-Behavior Relationships
Table 1 shows how in the Low group only, the degree of phasic decrease in dACC power during probabilistic error commission correlated with individual differences in the ability to learn to avoid punishment. Conversely, in the High group, phasic increases in rACC power correlated with punishment avoidance learning5. Figure 6 summarizes the source-ERP-behavioral relationships, where greater dACC deactivation predicted NoGo bias in the Low group, but larger ERN amplitudes in the High group. Conversely, greater rACC reactivity predicted larger ERN amplitudes in the Low group, but NoGo bias in the High group. This pattern of intact brain-behavior relationships does not reveal whether the group difference in ERN amplitude is a functionally relevant indicator of a deficit in the functioning of action monitoring systems, or simply a result of the degree that different cortical processing systems are recruited for this task.
Table 1.
Within-group correlations (Pearson’s r) between error-related sub-regional cingulate activities and learning accuracies [Low OCI-R: N=43, High OCI-R: N=23].
| Learning Metric | Group | z-Test | |
|---|---|---|---|
| Low OCI-R | High OCI-R | ||
| Bias: Go>NoGo |
|||
| Dorsal ACC | .36* | −.35 | 2.71** |
| Rostral ACC | .10 | −.45* | 2.12* |
| NoGo |
|||
| Dorsal ACC | −.38* | .15 | −2.00* |
| Rostral ACC | −.22 | .39* | −2.32* |
p<.05;
p<.01
Figure 6.

Summary of brain-behavior relationships for individual differences within Low OCI-R (left) and High OCI-R (right) groups in probabilistic tasks. A) In the Low group, error related decreases in dACC power predict NoGo bias; yet in the High group error-related increases in rACC power predict NoGo bias. B) In the Low group, error-related increases in rACC power predict larger ERNs; yet in the High group error-related decreases in dACC power predict larger ERNs. This regional dissociation (shown in A & B) does not reveal if the smaller ERN in the High group is only reflective of the degree that different (possibly compensatory) neural systems are recruited, or if smaller ERNs are reflective of a true deficit in action monitoring systems in the High group. C) Evidence for altered action monitoring as a function of high obsessive compulsive symptomatology is seen in the probabilistic reversal learning task, where smaller ERN amplitudes predicted poorer future performance during reversal learning in the High group only.
However, evidence from the reversal learning task suggests that the probabilistic learning ERN may be a functionally relevant indicator of deficient action monitoring processes in the High group. Only in the High group, ERN amplitude in the probabilistic learning task predicted future reversal learning success (r(13) = .73, p<.01, R2= .53), a pattern that was significantly different than the null effect found in the Low group (r(16) = −.10, p=.70; z= 1.97, p<.05). Differential patterns of regional cingulate phasic activities in the High group may be able to function during response selection of values that have been integrated over time (NoGo), but may be unable to compensate for rapidly overcoming well-learned stimulus-response associations (reversal).
Discussion
OC symptoms predicted a pattern of relatively greater rACC power and relatively lower dACC power at rest, suggesting tonic alteration as a function of OC symptom severity. High OC symptoms were associated with relatively greater rACC activity during errors on the response competition task, and less deactivation of dACC activity during errors in the reinforcement learning task. The degree of ACC reactivity in these areas correlated with the size of ERN amplitudes for each task in the High group, but not the Low group. This pattern of relationships suggests that task-specific phasic activation of ACC sub-regions are altered as a function of OC symptom severity, and this alteration is partially reflected in the scalp-recorded ERN.
The direct relationship between individual differences in ERN amplitude and punishment avoidance learning was similar between groups, even though activity in different cingulate subregions were correlated with these indices in High and Low groups. Although this sub-regional dissociation didn’t affect punishment avoidance learning, evidence of diminished performance was found in the High group where smaller ERN amplitudes predicted poorer future performance during reversal learning. These novel findings link both tonic and phasic activities in the ACC to action monitoring alterations, including dissociation in task performance, in OC symptomatic participants.
Tonic Cingulate Sub-Region Activity
OC symptom-related correlations with resting vmPFC/rACC power may be reflective of the hyperactive metabolic activity seen in OC patients. EEG source-localized power in most bands has been shown to directly correlate with functional metabolism (Oakes, et al. 2004), particularly theta band power in the rACC (Pizzagalli, et al. 2003), providing support that this novel measurement of resting neural functioning reflects similar vmPFC hyperactivation described in the extant patient literature (Adler, et al. 2000; Cavedini, et al. 2002; Chen, et al. 2004; Denys, et al. 2004a; Denys, et al. 2004b; Hesse, et al. 2005; Mataix-Cols, et al. 2004; Nakao, et al. 2005a; Rosenberg and Keshavan 1998; van der Wee, et al. 2004). The finding of lower resting dACC power as a function of OC symptomatology is consistent with neuroimaging findings of lower resting metabolism of OCD patients (Yucel, et al. 2007), yet diminished tonic rACC and dACC activity have also been found in clinical depression (Mayberg, et al. 1997; Pizzagalli, et al. 2001). However, even after accounting for variance associated with depressive symptomatology, this investigation found that obsessive-compulsive symptoms, rather than depressive symptoms, underlie the individual differences in resting EEG.
Phasic Cingulate Sub-Region Activation
Intracranial EEG recordings have indicated an increase theta power in the vmPFC/rACC and a decrease in beta power in the dmPFC/dACC during manual responses, especially during response conflict (Cohen, et al. 2008). While the time window for ROI analysis (50 ms) precluded the ability to parse frequency dynamics within each ACC sub-region in this investigation, both of these specific frequency bands (theta and beta) were altered at rest in the respective ACC sub-regions as a function of OC symptoms in this investigation. Since rACC areas often show a functional trade-off in activation with dACC areas (Bush, et al. 2000), both rACC hyperactivation and dACC hypoactivation may contribute to altered action monitoring signals as measured by ERN amplitude and even possibly the fMRI Blood Oxygen Level Dependent (BOLD) response.
In this investigation, reciprocal activation of rACC and dACC EEG power was seen during errors during the probabilistic learning task in the Low OCI-R group; this pattern was not present in the High OCI-R group. During response competition errors, the High group was characterized by greater rACC activity, in addition to dACC activation that was common to both groups, again demonstrating an alteration in reciprocal cingulate sub-region activation. This pattern of results hints that a single dynamic, present at rest in high OC individuals, underlies alteration in phasic action monitoring signals: rACC hyperactivity and dACC hypoactivity may contribute to inflexible reciprocal phasic activation of cingulate sub-regions.
Error Commission and the ERN
During motor errors of commission on the flankers task, dACC activity correlated with ERN amplitude without any group differences. However, only the High group had a correlation between rACC reactivity and ERN amplitude. The link between increased rACC reactivity and larger ERN amplitudes in High OC participants is convergent with findings of relatively greater rACC activation from fMRI studies (Fitzgerald, et al. 2005; Maltby, et al. 2005; Ursu, et al. 2003). The rostral part of the ACC has been related to assessing the salience of affective and homeostatic challenges (Bush, et al. 2000). Increased ERNs relate to trait and state level affective lability, and ERNs are larger in individuals with anxiety disorders (Hajcak, et al. 2003; Olvet and Hajcak 2008) and negative affect (Hajcak, et al. 2004; Luu, et al. 2000). Future investigations may aim to probe the relationship between increased affective salience, increased rACC reactivity, and larger ERNs.
Error Avoidance and the ERN
In contrast to such studies where response contingencies are known and erroneous responses reflect response errors of which subjects are generally aware, participants are rarely explicitly aware of the reinforcement probabilities on this type of reinforcement learning task. Moreover, there are no outright “errors” to make on a probabilistic task, only suboptimal choices. These suboptimal choices are unlikely to be as obvious or meaningful as errors-of-commission on a flanker task and these probabilistic errors may even reflect a different type of cognitive process: conflict due to a value judgment violation, an exploratory or uncertain response, or a sub-threshold error signal. The finding of phasically increased rACC and decreased dACC power in relation to both ERN amplitude and NoGo performance is a novel advancement in the field of reinforcement learning; yet more normative work must be done before OC symptom-related alterations (inflexible reciprocal phasic activation) can be fully interpreted.
Brain-Behavior Linkages
The ERN is understood to be a signal of internal action monitoring processes, and larger amplitudes have been shown to correlate with the degree of post-error behavioral adaptation (Cavanagh, et al. 2009; Debener, et al. 2005). However, the OC patient literature has failed to show a consistent effect of altered performance on response competition or reinforcement learning tasks in OCD patients (Endrass, et al. 2008; Gehring, et al. 2000; Hajcak, et al. 2008; Hajcak and Simons 2002; Johannes, et al. 2001; Maltby, et al. 2005; Ruchsow, et al. 2005; Ursu, et al. 2003; but see: Fitzgerald, et al. 2005). Recent studies have suggested that a putative performance monitoring dysfunction in OCD may not even be selective to error processing, since larger voltage negativities to correct responses are also observed in patients (Endrass, et al. 2008) and highly symptomatic non-patients (Hajcak and Simons 2002). Thus, it is not clear if ERN differences between patient and control groups are functionally relevant indicators of altered action monitoring adaptations, or if they are a result of the degree that different cortical processing systems are recruited due to “baseline shifts”. Evidence from this investigation supports both these possibilities, but suggests that the choice of task is a crucial variable to reveal these differences.
This investigation discovered that the High OC group may be compromised in their ability to reciprocally alter rACC and dACC activities in a phasic manner. This lack of reciprocal activation does not appear to hinder avoidance learning in the High OC group, possibly due to compensatory use of different cortical systems within the mPFC as detailed in Figure 6. Compensatory neural responses during reinforcement and action learning have been detailed in Parkinson’s (Bedard and Sanes 2009) and schizophrenic patients (Weickert, et al. 2009) in the absence of performance deficits. Whereas avoidance learning appears intact, probabilistic reversal learning is compromised in OCD patients (Chamberlain, et al. 2008; Kim, et al. 2003; Remijnse, et al. 2006; Valerius, et al. 2008). Our finding of a probabilistic learning deficit as a function of OC symptoms implicates possible deficits in the interactive systems of error monitoring, response inhibition, and high-order task structure systems in the brain, especially when quickly overcoming previously well learned responses. The finding of a relationship between ERN amplitude and reversal success in the High group represents the first relationship between an altered response-related ERP and a behavioral consequence as a function of OC symptomatology in the extant literature. This is a novel and important finding, since it suggests that ACC sub-regions involved in probabilistic error avoidance are directly related to performance deficits in rapid probabilistic reversal learning.
Limitations & Future Directions
The use of student populations for clinical analogues demands replication with OCD patients, but this methodology provides unique advantages: a young medically-healthy and psychopharmaceutical-free sample, the absence of severe comorbid psychiatric conditions, homogeneity in age, and the ease of using larger sample sizes. Moreover, a multitude of findings common to the patient literature were replicated here: including hyperactive resting vmPFC activity, larger error commission ERNs, and a deficit in reversal learning. The use of tonic and phasic source-localized EEG to account for the observed task dissociation in ERN amplitudes is a novel methodological advancement in the study of individual differences. These individual differences in OC symptomatology make strong and parsimonious predictions for future investigations with OCD patients.
This investigation localized the sources of phase-locked activities contributing to the ERPs, but not phase-varying activities which remain unidentified as in any ERP study (Trujillo and Allen, 2005). The sLORETA method of EEG source localization uses a standard MNI template for all participants, which would not account for structural variations in sulci or gyri across participant groups. Given that OCD patients have been characterized by diminished grey matter in the ACC (Rotge, et al. 2009) the contribution of structural differences between groups will not be accounted for in the analysis of resting and functional EEG activities. However, this possibility may be actually diminished by the use of student analogues as opposed to a patient population. Future investigations should replicate these tonic and phasic interdependencies in a patient population with an optimized methodology for functional localization, such as PET or fMRI. The specificity of these results to OCD should also be compared to other anxiety and mood disorders (Olvet and Hajcak 2008). Given that diminished tonic ACC activity may also be a correlate of depressive symptomatology (Mayberg, et al. 1997; Pizzagalli, et al. 2001), comparison studies are needed in order to fully characterize the functioning of the medial PFC in OCD.
Event-related brain responses do not exist in the vacuum of single moment; they are likely just a partial transient reflection of sustained, communicative, or adaptive system activities. It remains an open question whether altered action monitoring signals in OCD reflect a true difference in the adaptive performance, a tonic “baseline shift” in activity levels, or an altered context of interaction with other neural systems involved in cognitive control (like lateral PFC; Cavanagh et al., 2009) or affective reactivity (perhaps insula; Magno et al. 2006). This investigation suggests that the choice of task may be an important starting point for dissociating these myriad influences on event-related brain activity.
Conclusion
EEG source localization revealed that a single dynamic, present at rest, contributes to altered action monitoring signals in highly OC symptomatic participants. A pattern of rostral cingulate hyperactivation and dorsal cingulate hypoactivation may contribute to altered functioning in circumstances that require flexible alteration of goal-directed performance. These novel findings link both tonic and phasic activities in the ACC to action monitoring alterations, including dissociation in performance deficits, in OC symptomatic participants. Differential modulation of medial prefrontal systems may be related to obsessive-compulsive symptoms, with hypoactivity in dorsomedial systems that promote rapid active avoidance, but hyperactivity in ventromedial systems that are sensitive to maladaptive responses. The functional interaction of these systems may be compromised in OCD patients when recruited to overcome well-learned actions that perpetuate bad outcomes.
Acknowledgments
The authors thank Christina Figueroa and Dr. Mike X Cohen for their ongoing support and critical review of earlier versions of this manuscript, Dr. Diego Pizzagalli and Dr. Roberto Pascual-Marqui for their advice on LORETA ROI processing, and Antonia Kaczurkin for help with data collection. This study benefited from infrastructure provided by NIMH R01-MH066902. JFC is supported by NIMH F31MH082560.
Footnotes
All data are presented as [Mean, (SD)]: flanker error count: [Low: 72 (42); High: 64 (23)]; flanker correct RT ms: [Low: 453 (70); High: 461 (60)]; flanker error RT ms: [Low: 419 (85); High: 432 (73)]; probabilistic learning percent accuracy: [Low: 70 (9); High: 69 (11)]; probabilistic learning correct RT: [Low: 921 (351); High: 892 (318)]; probabilistic learning error RT: [Low: 1010 (335); High: 987 (336)]; sLORETA epoch count for flankers: [Low: 71 (43); High: 59 (22)]; sLORETA epoch count for probabilistic learning: [Low: 59 (21); High: 53 (21)].
Note that this OCI-R – NoGo statistic (and the data displayed in Figure 2) is taken from the sample with the learning criterion exclusion (AB > .5) and the additional EEG exclusion criteria (at least 30 ERNs) for the purpose of continuity. The pattern in the data following the learning criterion exclusion alone is nearly identical: OCI-R and NoGo r(84)= −.07, p=.55.
Additional ROI analyses included a wider sample of vmPFC (BA10, BA11, BA25 and rACC) and dmPFC (BA6, BA8, BA9 and dACC) areas, where these additional BAs include voxels in the medial PFC only (between X=−14 and X=14). Findings from these larger mPFC ROIs were very similar to the ACC ROIs alone. Following a priori hypotheses, and for the sake of parsimony, all analyses focus on ACC ROIs.
Although the difference between these correlations was not statistically significant (p=.14), when this analysis was performed in a larger time window (0 to 150 ms), the correlations were more divergent between groups (High: r(16)= .58, p<.05, R2= .34; Low: r(18)= −.12, p= .66) and were significantly different from each other (z= −2.04, p<.05).
Low OCI-R: These same effects hold even after accounting for resting effects by computing individual change scores (task-rest): Bias: (r(43)= .40, p<.01, R2= .16); NoGo: (r(43)= −.49, p<.01, R2= .24); Go: (r(43)= .17, p>.29); between groups comparison of bias and NoGo: (z’s>2.5, p’s<.01). High OCI-R: These effects largely hold even after accounting for resting effects by computing individual change scores (task-rest): Bias: (r(23)= −.43, p<.05, R2= .18); NoGo remains a trend: (r(23)= .39, p=.07, R2= .15); Go: (r(23)= −.27, p>.20); although the between groups comparison of bias and NoGo do not remain significant at the p<.05 threshold: (z’s>1.6, p’s<.10). In sum, tonic (resting) individual differences in dACC or rACC power do not appear to affect these brain-behavior relationships within the Low group, but tonic effects may have a slight influence in these relationships within the High group.
Publisher's Disclaimer: This is a PDF file of an unedited manuscript that has been accepted for publication. As a service to our customers we are providing this early version of the manuscript. The manuscript will undergo copyediting, typesetting, and review of the resulting proof before it is published in its final citable form. Please note that during the production process errors may be discovered which could affect the content, and all legal disclaimers that apply to the journal pertain.
References
- Adler CM, McDonough-Ryan P, Sax KW, Holland SK, Arndt S, Strakowski SM. fMRI of neuronal activation with symptom provocation in unmedicated patients with obsessive compulsive disorder. Journal of Psychiatry Research. 2000;34(4–5):317–24. doi: 10.1016/s0022-3956(00)00022-4. [DOI] [PubMed] [Google Scholar]
- Bedard P, Sanes JN. On a basal ganglia role in learning and rehearsing visual-motor associations. Neuroimage. 2009 doi: 10.1016/j.neuroimage.2009.03.050. [DOI] [PMC free article] [PubMed] [Google Scholar]
- Botvinick MM, Braver TS, Barch DM, Carter CS, Cohen JD. Conflict monitoring and cognitive control. Psychological Review. 2001;108(3):624–52. doi: 10.1037/0033-295x.108.3.624. [DOI] [PubMed] [Google Scholar]
- Bush G, Luu P, Posner MI. Cognitive and emotional influences in anterior cingulate cortex. Trends in Cognitive Science. 2000;4(6):215–222. doi: 10.1016/s1364-6613(00)01483-2. [DOI] [PubMed] [Google Scholar]
- Cavanagh JF, Cohen MX, Allen JJ. Prelude to and resolution of an error: EEG phase synchrony reveals cognitive control dynamics during action monitoring. Journal of Neuroscience. 2009;29(1):98–105. doi: 10.1523/JNEUROSCI.4137-08.2009. [DOI] [PMC free article] [PubMed] [Google Scholar]
- Cavedini P, Gorini A, Bellodi L. Understanding obsessive-compulsive disorder: focus on decision making. Neuropsychology Review. 2006;16(1):3–15. doi: 10.1007/s11065-006-9001-y. [DOI] [PubMed] [Google Scholar]
- Cavedini P, Riboldi G, D’Annucci A, Belotti P, Cisima M, Bellodi L. Decision-making heterogeneity in obsessive-compulsive disorder: ventromedial prefrontal cortex function predicts different treatment outcomes. Neuropsychologia. 2002;40(2):205–11. doi: 10.1016/s0028-3932(01)00077-x. [DOI] [PubMed] [Google Scholar]
- Chamberlain SR, Menzies L, Hampshire A, Suckling J, Fineberg NA, del Campo N, Aitken M, Craig K, Owen AM, Bullmore ET, et al. Orbitofrontal dysfunction in patients with obsessive-compulsive disorder and their unaffected relatives. Science. 2008;321(5887):421–2. doi: 10.1126/science.1154433. [DOI] [PubMed] [Google Scholar]
- Chen XL, Xie JX, Han HB, Cui YH, Zhang BQ. MR perfusion-weighted imaging and quantitative analysis of cerebral hemodynamics with symptom provocation in unmedicated patients with obsessive-compulsive disorder. Neuroscience Letters. 2004;370(2–3):206–11. doi: 10.1016/j.neulet.2004.08.019. [DOI] [PubMed] [Google Scholar]
- Cohen MX, Ridderinkhof KR, Haupt S, Elger CE, Fell J. Medial frontal cortex and response conflict: evidence from human intracranial EEG and medial frontal cortex lesion. Brain Research. 2008;1238:127–42. doi: 10.1016/j.brainres.2008.07.114. [DOI] [PubMed] [Google Scholar]
- Cools R, Clark L, Owen AM, Robbins TW. Defining the neural mechanisms of probabilistic reversal learning using event-related functional magnetic resonance imaging. Journal of Neuroscience. 2002;22(11):4563–7. doi: 10.1523/JNEUROSCI.22-11-04563.2002. [DOI] [PMC free article] [PubMed] [Google Scholar]
- Cottraux J, Gerard D, Cinotti L, Froment JC, Deiber MP, Le Bars D, Galy G, Millet P, Labbe C, Lavenne F, et al. A controlled positron emission tomography study of obsessive and neutral auditory stimulation in obsessive-compulsive disorder with checking rituals. Psychiatry Research. 1996;60(2–3):101–12. doi: 10.1016/0165-1781(96)02697-2. [DOI] [PubMed] [Google Scholar]
- Debener S, Ullsperger M, Siegel M, Fiehler K, von Cramon DY, Engel AK. Trial-by-trial coupling of concurrent electroencephalogram and functional magnetic resonance imaging identifies the dynamics of performance monitoring. Journal of Neuroscience. 2005;25(50):11730–7. doi: 10.1523/JNEUROSCI.3286-05.2005. [DOI] [PMC free article] [PubMed] [Google Scholar]
- Delorme A, Makeig S. EEGLAB: an open source toolbox for analysis of single-trial EEG dynamics including independent component analysis. Journal of Neuroscience Methods. 2004;134(1):9–21. doi: 10.1016/j.jneumeth.2003.10.009. [DOI] [PubMed] [Google Scholar]
- Denys D, van der Wee N, Janssen J, De Geus F, Westenberg HG. Low level of dopaminergic D2 receptor binding in obsessive-compulsive disorder. Biological Psychiatry. 2004a;55(10):1041–5. doi: 10.1016/j.biopsych.2004.01.023. [DOI] [PubMed] [Google Scholar]
- Denys D, Zohar J, Westenberg HG. The role of dopamine in obsessive-compulsive disorder: preclinical and clinical evidence. Journal of Clinical Psychiatry. 2004b;65(Suppl 14):11–7. [PubMed] [Google Scholar]
- Endrass T, Klawohn J, Schuster F, Kathmann N. Overactive performance monitoring in obsessive-compulsive disorder: ERP evidence from correct and erroneous reactions. Neuropsychologia. 2008;46(7):1877–87. doi: 10.1016/j.neuropsychologia.2007.12.001. [DOI] [PubMed] [Google Scholar]
- Fitzgerald KD, Welsh RC, Gehring WJ, Abelson JL, Himle JA, Liberzon I, Taylor SF. Error-related hyperactivity of the anterior cingulate cortex in obsessive-compulsive disorder. Biological Psychiatry. 2005;57(3):287–94. doi: 10.1016/j.biopsych.2004.10.038. [DOI] [PubMed] [Google Scholar]
- Foa EB, Huppert JD, Leiberg S, Langner R, Kichic R, Hajcak G, Salkovskis PM. The Obsessive-Compulsive Inventory: development and validation of a short version. Psychological Assessment. 2002;14(4):485–96. [PubMed] [Google Scholar]
- Frank MJ, D’Lauro C, Curran T. Cross-task individual differences in error processing: neural, electrophysiological, and genetic components. Cognitive Affective and Behavioral Neuroscience. 2007;7(4):297–308. doi: 10.3758/cabn.7.4.297. [DOI] [PubMed] [Google Scholar]
- Frank MJ, Seeberger LC, O’Reilly RC. By carrot or by stick: cognitive reinforcement learning in parkinsonism. Science. 2004;306(5703):1940–3. doi: 10.1126/science.1102941. [DOI] [PubMed] [Google Scholar]
- Frank MJ, Woroch BS, Curran T. Error-related negativity predicts reinforcement learning and conflict biases. Neuron. 2005;47(4):495–501. doi: 10.1016/j.neuron.2005.06.020. [DOI] [PubMed] [Google Scholar]
- Frei E, Gamma A, Pascual-Marqui R, Lehmann D, Hell D, Vollenweider FX. Localization of MDMA-induced brain activity in healthy volunteers using low resolution brain electromagnetic tomography (LORETA) Human Brain Mapping. 2001;14:152–165. doi: 10.1002/hbm.1049. [DOI] [PMC free article] [PubMed] [Google Scholar]
- Gehring WJ, Himle J, Nisenson LG. Action-monitoring dysfunction in obsessive-compulsive disorder. Psychological Science. 2000;11(1):1–6. doi: 10.1111/1467-9280.00206. [DOI] [PubMed] [Google Scholar]
- Gründler TO, Cavanagh JF, Figueroa CM, Frank MJ, Allen JJ. Task-related dissociation in ERN amplitude as a function of obsessive-compulsive symptoms. Neuropsychologia. 2009;47(8–9):1978–87. doi: 10.1016/j.neuropsychologia.2009.03.010. [DOI] [PMC free article] [PubMed] [Google Scholar]
- Hajcak G, Franklin ME, Foa EB, Simons RF. Increased error-related brain activity in pediatric obsessive-compulsive disorder before and after treatment. American Journal of Psychiatry. 2008;165(1):116–23. doi: 10.1176/appi.ajp.2007.07010143. [DOI] [PubMed] [Google Scholar]
- Hajcak G, McDonald N, Simons RF. Anxiety and error-related brain activity. Biological Psychology. 2003;64(1–2):77–90. doi: 10.1016/s0301-0511(03)00103-0. [DOI] [PubMed] [Google Scholar]
- Hajcak G, McDonald N, Simons RF. Error-related psychophysiology and negative affect. Brain and Cognition. 2004;56(2):189–97. doi: 10.1016/j.bandc.2003.11.001. [DOI] [PubMed] [Google Scholar]
- Hajcak G, Simons RF. Error-related brain activity in obsessive-compulsive undergraduates. Psychiatry Research. 2002;110(1):63–72. doi: 10.1016/s0165-1781(02)00034-3. [DOI] [PubMed] [Google Scholar]
- Hesse S, Muller U, Lincke T, Barthel H, Villmann T, Angermeyer MC, Sabri O, Stengler-Wenzke K. Serotonin and dopamine transporter imaging in patients with obsessive-compulsive disorder. Psychiatry Research. 2005;140(1):63–72. doi: 10.1016/j.pscychresns.2005.07.002. [DOI] [PubMed] [Google Scholar]
- Holroyd CB, Coles MG. The neural basis of human error processing: reinforcement learning, dopamine, and the error-related negativity. Psychological Review. 2002;109(4):679–709. doi: 10.1037/0033-295X.109.4.679. [DOI] [PubMed] [Google Scholar]
- Johannes S, Wieringa BM, Nager W, Rada D, Dengler R, Emrich HM, Munte TF, Dietrich DE. Discrepant target detection and action monitoring in obsessive-compulsive disorder. Psychiatry Research. 2001;108(2):101–10. doi: 10.1016/s0925-4927(01)00117-2. [DOI] [PubMed] [Google Scholar]
- Kim CH, Chang JW, Koo MS, Kim JW, Suh HS, Park IH, Lee HS. Anterior cingulotomy for refractory obsessive-compulsive disorder. Acta Psychiatrica Scandinavica. 2003;107(4):283–90. doi: 10.1034/j.1600-0447.2003.00087.x. [DOI] [PubMed] [Google Scholar]
- Luu P, Collins P, Tucker DM. Mood, personality, and self-monitoring: negative affect and emotionality in relation to frontal lobe mechanisms of error monitoring. Journal of Experimental Psychology: General. 2000;129(1):43–60. doi: 10.1037//0096-3445.129.1.43. [DOI] [PubMed] [Google Scholar]
- Luu P, Tucker DM, Derryberry D, Reed M, Poulsen C. Electrophysiological responses to errors and feedback in the process of action regulation. Psychological Science. 2003;14(1):47–53. doi: 10.1111/1467-9280.01417. [DOI] [PubMed] [Google Scholar]
- Magno E, Foxe JJ, Molholm S, Robertson IH, Garavan H. The anterior cingulate and error avoidance. Journal of Neuroscience. 2006;26(18):4769, 4773. doi: 10.1523/JNEUROSCI.0369-06.2006. [DOI] [PMC free article] [PubMed] [Google Scholar]
- Maltby N, Tolin DF, Worhunsky P, O’Keefe TM, Kiehl KA. Dysfunctional action monitoring hyperactivates frontal-striatal circuits in obsessive-compulsive disorder: an event-related fMRI study. Neuroimage. 2005;24(2):495–503. doi: 10.1016/j.neuroimage.2004.08.041. [DOI] [PubMed] [Google Scholar]
- Mataix-Cols D, Wooderson S, Lawrence N, Brammer MJ, Speckens A, Phillips ML. Distinct neural correlates of washing, checking, and hoarding symptom dimensions in obsessive-compulsive disorder. Archives of General Psychiatry. 2004;61(6):564–76. doi: 10.1001/archpsyc.61.6.564. [DOI] [PubMed] [Google Scholar]
- Mayberg HS, Brannan SK, Mahurin RK, Jerabek PA, Brickman JS, Tekell JL, Silva JA, McGinnis S, Glass TG, Martin CC, et al. Cingulate function in depression: a potential predictor of treatment response. Neuroreport. 1997;8(4):1057–61. doi: 10.1097/00001756-199703030-00048. [DOI] [PubMed] [Google Scholar]
- Nakao T, Nakagawa A, Yoshiura T, Nakatani E, Nabeyama M, Yoshizato C, Kudoh A, Tada K, Yoshioka K, Kawamoto M. A functional MRI comparison of patients with obsessive-compulsive disorder and normal controls during a Chinese character Stroop task. Psychiatry Research. 2005a;139(2):101–14. doi: 10.1016/j.pscychresns.2004.12.004. [DOI] [PubMed] [Google Scholar]
- Nakao T, Nakagawa A, Yoshiura T, Nakatani E, Nabeyama M, Yoshizato C, Kudoh A, Tada K, Yoshioka K, Kawamoto M, et al. Brain activation of patients with obsessive-compulsive disorder during neuropsychological and symptom provocation tasks before and after symptom improvement: a functional magnetic resonance imaging study. Biological Psychiatry. 2005b;57(8):901–10. doi: 10.1016/j.biopsych.2004.12.039. [DOI] [PubMed] [Google Scholar]
- Oakes TR, Pizzagalli DA, Hendrick AM, Horras KA, Larson CL, Abercrombie HC, Schaefer SM, Koger JV, Davidson RJ. Functional coupling of simultaneous electrical and metabolic activity in the human brain. Human Brain Mapping. 2004;21(4):257–70. doi: 10.1002/hbm.20004. [DOI] [PMC free article] [PubMed] [Google Scholar]
- Olvet DM, Hajcak G. The error-related negativity (ERN) and psychopathology: Toward an endophenotype. Clinical Psychology Reviews. 2008 doi: 10.1016/j.cpr.2008.07.003. [DOI] [PMC free article] [PubMed] [Google Scholar]
- Pascual-Marqui RD. Standardized low-resolution brain electromagnetic tomography (sLORETA): technical details. Methods and Findings in Experimental Clinical Pharmacology. 2002;24(Suppl D):5–12. [PubMed] [Google Scholar]
- Perani D, Colombo C, Bressi S, Bonfanti A, Grassi F, Scarone S, Bellodi L, Smeraldi E, Fazio F. [18F]FDG PET study in obsessive-compulsive disorder. A clinical/metabolic correlation study after treatment. British Journal of Psychiatry. 1995;166(2):244–50. doi: 10.1192/bjp.166.2.244. [DOI] [PubMed] [Google Scholar]
- Pizzagalli D, Pascual-Marqui RD, Nitschke JB, Oakes TR, Larson CL, Abercrombie HC, Schaefer SM, Koger JV, Benca RM, Davidson RJ. Anterior cingulate activity as a predictor of degree of treatment response in major depression: evidence from brain electrical tomography analysis. American Journal of Psychiatry. 2001;158(3):405–15. doi: 10.1176/appi.ajp.158.3.405. [DOI] [PubMed] [Google Scholar]
- Pizzagalli DA, Oakes TR, Davidson RJ. Coupling of theta activity and glucose metabolism in the human rostral anterior cingulate cortex: an EEG/PET study of normal and depressed subjects. Psychophysiology. 2003;40(6):939–49. doi: 10.1111/1469-8986.00112. [DOI] [PubMed] [Google Scholar]
- Pizzagalli DA, Peccoralo LA, Davidson RJ, Cohen JD. Resting anterior cingulate activity and abnormal responses to errors in subjects with elevated depressive symptoms: a 128-channel EEG study. Human Brain Mapping. 2006;27(3):185–201. doi: 10.1002/hbm.20172. [DOI] [PMC free article] [PubMed] [Google Scholar]
- Rauch SL, Jenike MA, Alpert NM, Baer L, Breiter HC, Savage CR, Fischman AJ. Regional cerebral blood flow measured during symptom provocation in obsessive-compulsive disorder using oxygen 15-labeled carbon dioxide and positron emission tomography. Archives of General Psychiatry. 1994;51(1):62–70. doi: 10.1001/archpsyc.1994.03950010062008. [DOI] [PubMed] [Google Scholar]
- Remijnse PL, Nielen MM, van Balkom AJ, Cath DC, van Oppen P, Uylings HB, Veltman DJ. Reduced orbitofrontal-striatal activity on a reversal learning task in obsessive-compulsive disorder. Archives of General Psychiatry. 2006;63(11):1225–36. doi: 10.1001/archpsyc.63.11.1225. [DOI] [PubMed] [Google Scholar]
- Rosenberg DR, Keshavan MS. A.E. Bennett Research Award. Toward a neurodevelopmental model of of obsessive--compulsive disorder. Biological Psychiatry. 1998;43(9):623–40. doi: 10.1016/s0006-3223(97)00443-5. [DOI] [PubMed] [Google Scholar]
- Rotge JY, Guehl D, Dilharreguy B, Tignol J, Bioulac B, Allard M, Burbaud P, Aouizerate B. Meta-analysis of brain volume changes in obsessive-compulsive disorder. Biological Psychiatry. 2009;65(1):75–83. doi: 10.1016/j.biopsych.2008.06.019. [DOI] [PubMed] [Google Scholar]
- Ruchsow M, Gron G, Reuter K, Spitzer M, Hermle L, Kiefer M. Error-related brain activity in patients with obsessive-compulsive disorder and in healthy controls. Journal of Psychophysiology. 2005;19(4):6. [Google Scholar]
- Santesso DL, Segalowitz SJ, Schmidt LA. Error-related electrocortical responses are enhanced in children with obsessive-compulsive behaviors. Developmental Neuropsychology. 2006;29(3):431–45. doi: 10.1207/s15326942dn2903_3. [DOI] [PubMed] [Google Scholar]
- Semlitsch HV, Anderer P, Schuster P, Presslich O. A solution for reliable and valid reduction of ocular artifacts, applied to the P300 ERP. Psychophysiology. 1986;23(6):695–703. doi: 10.1111/j.1469-8986.1986.tb00696.x. [DOI] [PubMed] [Google Scholar]
- Ullsperger M, von Cramon DY. Neuroimaging of performance monitoring: error detection and beyond. Cortex. 2004;40(4–5):593–604. doi: 10.1016/s0010-9452(08)70155-2. [DOI] [PubMed] [Google Scholar]
- Ursu S, Stenger VA, Shear MK, Jones MR, Carter CS. Overactive action monitoring in obsessive-compulsive disorder: evidence from functional magnetic resonance imaging. Psychological Science. 2003;14(4):347–53. doi: 10.1111/1467-9280.24411. [DOI] [PubMed] [Google Scholar]
- Valerius G, Lumpp A, Kuelz AK, Freyer T, Voderholzer U. Reversal learning as a neuropsychological indicator for the neuropathology of obsessive compulsive disorder? A behavioral study. Journal of Neuropsychiatry and Clinical Neuroscience. 2008;20(2):210–8. doi: 10.1176/jnp.2008.20.2.210. [DOI] [PubMed] [Google Scholar]
- van der Wee NJ, Stevens H, Hardeman JA, Mandl RC, Denys DA, van Megen HJ, Kahn RS, Westenberg HM. Enhanced dopamine transporter density in psychotropic-naive patients with obsessive-compulsive disorder shown by [123I]{beta}-CIT SPECT. American Journal of Psychiatry. 2004;161(12):2201–6. doi: 10.1176/appi.ajp.161.12.2201. [DOI] [PubMed] [Google Scholar]
- Weickert TW, Goldberg TE, Callicott JH, Chen Q, Apud JA, Das S, Zoltick BJ, Egan MF, Meeter M, Myers C, et al. Neural correlates of probabilistic category learning in patients with schizophrenia. Journal of Neuroscience. 2009;29(4):1244–54. doi: 10.1523/JNEUROSCI.4341-08.2009. [DOI] [PMC free article] [PubMed] [Google Scholar]
- Yucel M, Harrison BJ, Wood SJ, Fornito A, Wellard RM, Pujol J, Clarke K, Phillips ML, Kyrios M, Velakoulis D, et al. Functional and biochemical alterations of the medial frontal cortex in obsessive-compulsive disorder. Archives of General Psychiatry. 2007;64(8):946–55. doi: 10.1001/archpsyc.64.8.946. [DOI] [PubMed] [Google Scholar]