SUMMARY
In Petunia x hybrida cv ‘Mitchell Diploid’ (MD), floral fragrance is comprised of 13 volatile benzenoids/phenylpropanoids, which are derived from the aromatic amino acid phenylalanine. Several genes involved in the direct synthesis of individual floral volatile benzenoid/phenylpropanoid (FVBP) compounds, i.e. at the end of the pathway, have been isolated and characterized in petunia through reverse genetic and biochemical approaches. In an effort to understand the regulation of “upstream” components in the FVBP system, we have cloned and characterized two CHORISMATE MUTASE (PhCM1 and PhCM2) cDNAs from petunia. PhCM1 has a transcript accumulation profile consistent with known FVBP genes, while PhCM2 displayed a constitutive transcript accumulation profile. The plastid localized PhCM1 is allosterically regulated by tryptophan; but not phenylalanine and tyrosine. PhCM1 RNAi knockdown petunias are reduced in total FVBP emission by approximately 60–70 % and total CM activity in corolla tissue is reduced by 80–85 % compared to control plants. These results demonstrate that PhCM1 is the principal CM protein responsible for the coupling of metabolites from the shikimate pathway to the synthesis of FVBPs in the MD corolla.
Keywords: CHORISMATE MUTASE, Petunia, Benzenoid/Phenylpropanoid, Volatiles, Flower, Chloroplast
INTRODUCTION
Flowering plant species have developed several mechanisms for attracting pollinating organisms. Flower shape, color, and fragrance all contribute to an increased specialization of the floral phenotype aimed at the attraction of a pollinator (Fenster et al., 2004). Floral fragrance consists of an assortment of volatile organic molecules, which are commonly referred to as a scent bouquet. These volatile organic compounds are not only involved in plant reproductive processes, but also in plant-plant interactions, defense, and abiotic stress responses (Dudareva et al., 2006). The majority of volatile compounds are lipophilic liquids with high vapor pressures, which cross biological membranes freely in the epidermal cells of the petal (Pichersky et al., 2006). Floral volatiles are generally differentiated into three main groups; benzenoids/phenylpropanoids, terpenoids, and fatty acid derivatives.
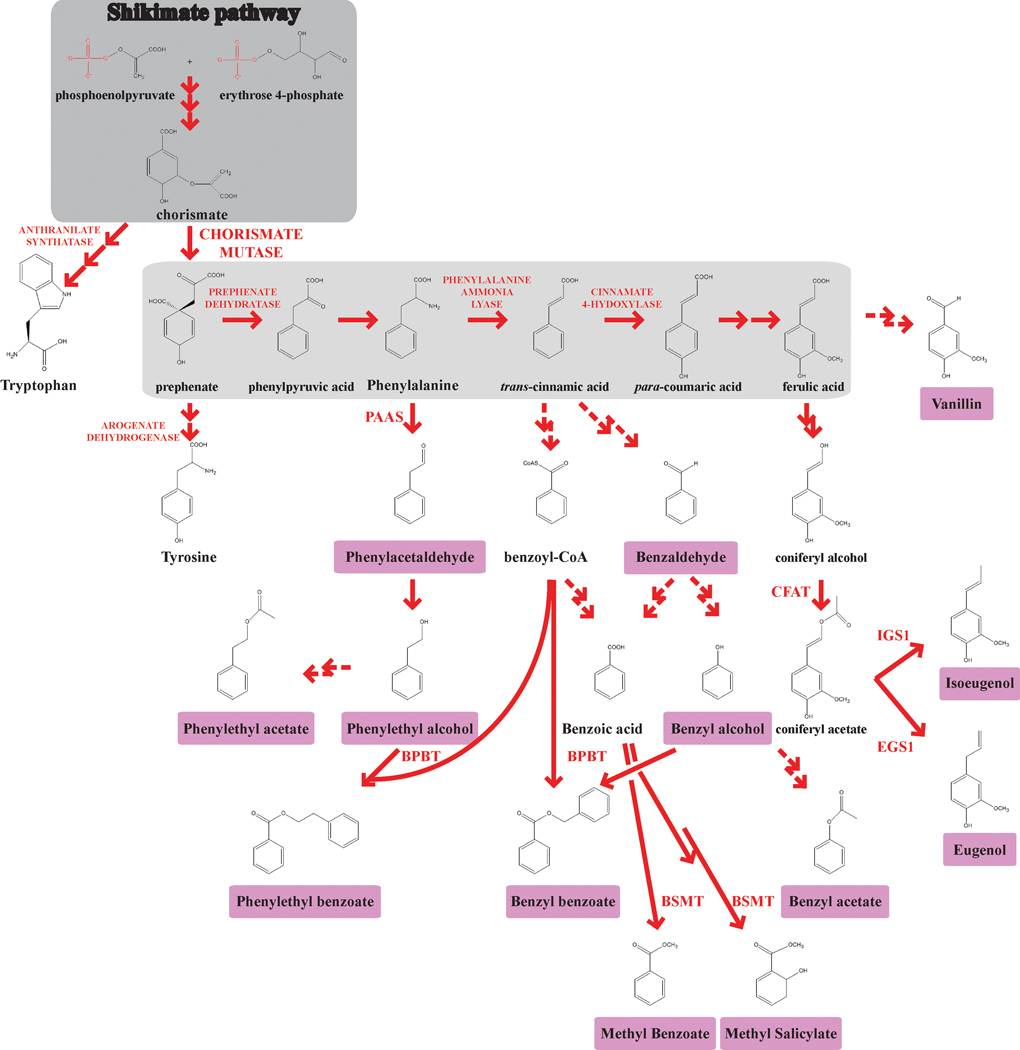
Petunia (Petunia x hybrida cv ‘Mitchell Diploid’ [MD]) synthesizes and emits 13 known floral volatile benzenoid/phenylpropanoid (FVBP) compounds (Kolosova et al., 2001; Verdonk et al., 2003; Boatright et al., 2004; Verdonk et al., 2005; Koeduka et al., 2006) [Figure 1]. The majority of FVBP compounds are derived from the aromatic amino acid phenylalanine (Boatright et al., 2004; Schuurink et al., 2006). Eight genes that are known to participate in FVBP synthesis have been isolated from petunia: PhBSMT1, PhBSMT2, PhBPBT, PhPAAS, PhIGS1, PhEGS1, PhCFAT, and PhODO1 (Negre et al., 2003; Boatright et al., 2004; Underwood et al., 2005; Verdonk et al., 2005; Kaminaga et al., 2006; Koeduka et al., 2006; Orlova et al., 2006; Dexter et al., 2007; Dexter et al., 2008; Koeduka et al., 2008) [Figure 1]. All of these gene products are involved in the direct formation of a FVBP compound except PhODO1 (Verdonk et al., 2005), which is a transcriptional regulator, and PhCFAT (Dexter et al., 2007), which produces substrate for PhIGS1 and PhEGS1.
Figure 1.
The floral volatile benzenoid/phenylpropanoid pathway in petunia. The shikimate pathway (dark grey) concludes with the formation of chorismate. CHORISMATE MUTASE catalyzes the rearrangement of chorismate to prephenate, directing the flux of metabolites to the production of phenylalanine and tyrosine. From the phenylpropanoid backbone (light grey), FVBP production consists of three main branch-points; phenylalanine, trans-cinnamic acid, and ferulic acid. Floral volatile compounds derived from each branch-point are highlighted in pink and known FVBP genes are abbreviated at the appropriate enzymatic positions. Enzymes are in red. Solid red arrows indicate established biochemical reactions. Multiple arrows indicate multiple biochemical steps. Dashed arrows indicate possible biochemical reactions.
Regulation of the petunia FVBP system is complex and very specific. Substantial emission of MD FVBPs is confined to the corolla limb tissue during open flower stages of development, which coincides with the presentation of the reproductive organs (Verdonk et al., 2003). MD FVBP internal substrate pool accumulation and emission is diurnal with the highest level detected during the dark period (Kolosova et al., 2001; Verdonk et al., 2003; Underwood et al., 2005; Verdonk et al., 2005; Orlova et al., 2006). FVBP synthesis and emission, FVBP gene transcript accumulation, and PhBSMT activity are greatly reduced following a successful pollination/fertilization event or exogenous treatment with ethylene (Hoekstra and Weges, 1986; Negre et al., 2003; Underwood et al., 2005). Subsequent to a successful fertilization event, the corolla tissue senesces as the petunia flower shifts from pollinator attraction to supporting seed set.
The shikimate pathway couples metabolism of carbohydrates to the formation of aromatic amino acids (Figure 1) [Herrmann and Weaver, 1999]. CHORISMATE MUTASE (CM) catalyzes an intramolecular, [3,3]-sigmatropic rearrangement of chorismic acid to prephenic acid, the initial committed step in phenylalanine and tyrosine biosynthesis (Haslem, 1993). In Arabidopsis thaliana, three CM genes have been identified and characterized: AtCM1, AtCM2, and AtCM3 (Eberhard et al., 1996b; Mobley et al., 1999). AtCM1 and AtCM3 encode putatively plastid localized CM isoforms, which are allosterically down-regulated by phenylalanine and tyrosine, but up-regulated by tryptophan. AtCM2 encodes a CM isoform not regulated by aromatic amino acids and appears to be located in the cytosol.
The majority of floral volatile studies in petunia have focused on identification of gene products involved in the formation of individual, emitted FVBP compounds (i.e. genes at the end of the FVBP pathway). Since the FVBPs are derived from phenylalanine and CM is the first committed step in phenylalanine biosynthesis, we identified and characterized two petunia CM cDNAs (PhCM1 and PhCM2). Additionally, we identified the principal CM responsible for the production of FVBP compounds in petunia.
RESULTS
Identification of two distinct CM cDNAs
To identify putative CM genes, we searched a publicly available petunia EST database (http://www.sgn.cornell.edu) and a petunia root EST collection (courtesy of Dr. Didier Reinhardt at the University of Fribourg) for sequences with homology to any of the three CM genes from Arabidopsis thaliana. The in silico analysis identified two partial ESTs whose full-length sequences were recovered by 5’ and 3’ RACE technology. These two sequences exhibited high similarity to AtCMs and were subsequently renamed CHORISMATE MUTASE1 (PhCM1) and CHORISMATE MUTASE2 (PhCM2), which were deposited in GenBank under accession numbers, EU751616 and EU751617, respectively (Figure S1).
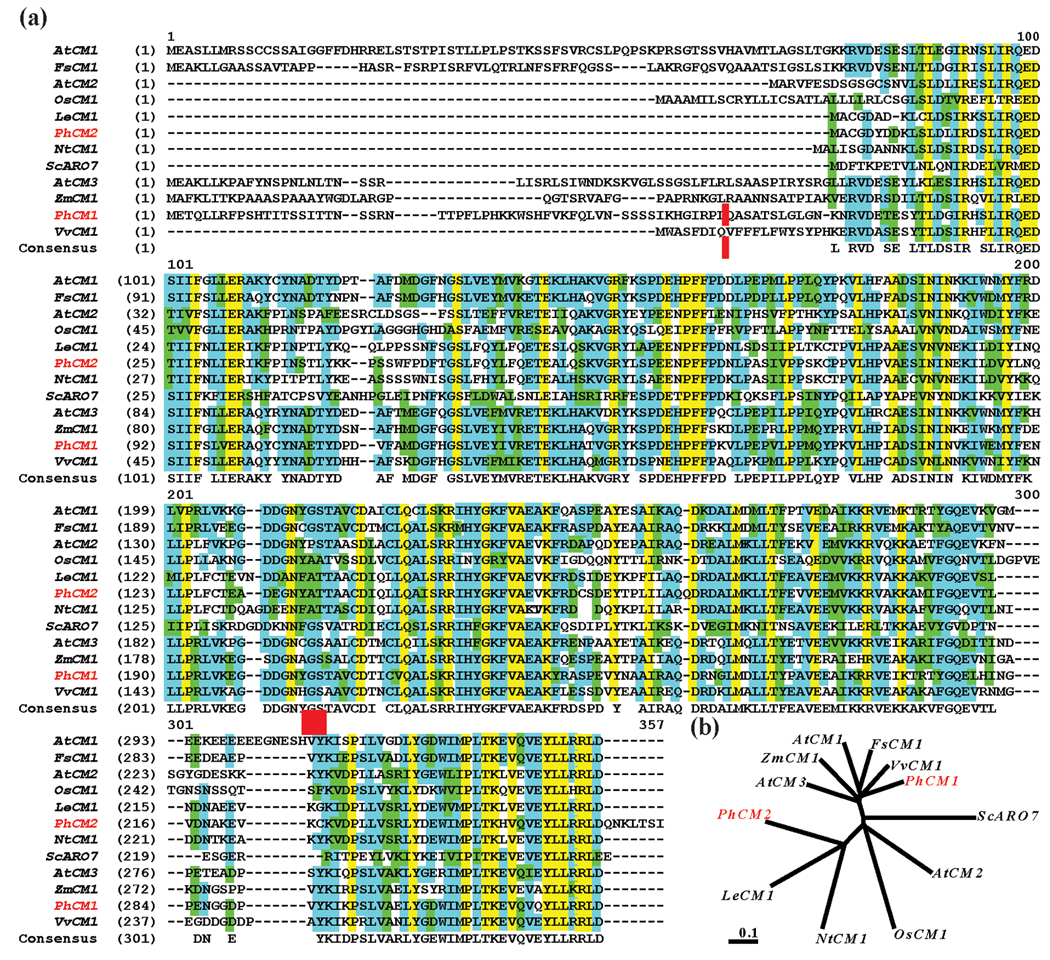
The predicted PhCM1 and PhCM2 proteins were 324 and 263 amino acids in length, respectively. PhCM1 contains a predicted N-terminal chloroplast transit peptide (cTP) of 56 amino acids (ChloroP 1.1) and is therefore predicted to be plastid localized (Predator v. 1.03), while PhCM2 is likely located in the cytosol (Benesova and Bode, 1992). The predicted mature PhCM1 and PhCM2 share 46.7 % amino acid identity. When aligned with CM amino acid sequences from Arabidopsis thaliana, Fagus sylvatica, Solanum lycopersicum, Nicotiana tabacum, Oryza sativa, Vitis vinifera, Zea mays, and Saccharomyces cerevisiae common sequence features including a CM_2 superfamily domain in the N-terminal half of the predicted proteins and a conserved C-terminal domain of 19 amino acids were observed (Figure 2a). Additionally, an allosteric regulatory site (GS marked by red box) was present in PhCM1, but not PhCM2, which would be consistent with aromatic amino acid regulation of the plastidic PhCM1. Phylogenetic analysis demonstrated that the three solanaceous cytosolic CMs closely associate in an unrooted neighbor-joining tree (Figure 2b). PhCM1 associates with CMs from multiple species containing both a predicted cTP and the allosteric regulatory site. PhCM1 shares 62.2 % identity with AtCM1.
Figure 2.
Predicted peptide sequence alignment and an unrooted neighbor-joining phylogenetic tree of CM proteins from various species. Sequences represented are from Arabidopsis thaliana (accession: NP_566846, NP_196648, and NP_177096), Fagus sylvatica (ABA54871), Solanum lycopersicum (AAD48923), Nicotiana tabacum (BAD26595), Oryza sativa (NP_001061910), Petunia x hybrida (EU751616, EU751617), Vitis vinifera (CAO15322), Zea mays (AY103806), and Saccharomyces cerevisiae (NP_015385). (a) Sequences were aligned using the AlignX program of the Vector NTI Advance 10.3.0 software (Invitrogen). Residues highlighted in: blue represent consensus residues derived from a block of similar residues at a given position, green represent consensus residues derived from the occurrence of greater than 50 % of a single residue at a given position, and yellow represent consensus residues derived from a completely conserved residue at a given position. Petunia sequences are highlighted in red to the left, a red vertical bar represents the beginning of the mature protein sequence used for PhCM1, and a red box indicates an allosteric regulatory site (GS). (b) TREEVIEW software with the nearest-joining method was used to create the resulting tree. Scale bar represents distance as the number of substitutions per site (i.e., 0.1 amino acid substitutions per site).
Chloroplast import assay
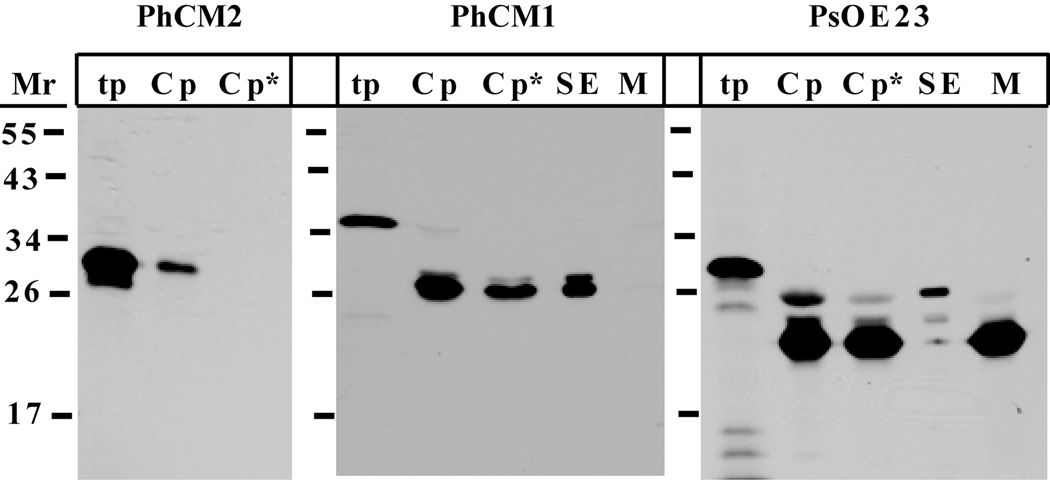
To test the predicted subcellular localization of PhCM1 and PhCM2, both full length coding sequences were cloned into a pGEM®-T Easy vector, in vitro transcribed and translated. The radiolabeled translation product was incubated with isolated chloroplasts (Pisum sativum) in a protein import assay (Figure 3). The radiolabeled PhCM2 translation product associated with the chloroplast fraction was equal in size to the original translation product and unprotected from the thermolysin protease treatment, indicating that PhCM2 did not enter the plastid. However, the PhCM1 translation product associated with the chloroplast fraction was processed to a smaller size and was protected from the thermolysin treatment, indicating PhCM1 is imported into the plastid and processed to a mature size. Furthermore, the radiolabeled PhCM1 was associated with the stromal fraction of separated chloroplasts. Together with primary amino acid sequence features, these results demonstrate PhCM1 is localized to the chloroplast stroma, while PhCM2 is most likely not located in the chloroplast.
Figure 3.
Plastid import assay. Radiolabeled PhCM1, PhCM2, and PsOE23 were individually incubated with isolated pea chloroplasts. After import, the isolated chloroplasts were treated with thermolysin as depicted in the figure. Proteolysis was terminated and the intact chloroplasts were then repurified, washed, lysed, and fractionated. PsOE23 is a thylakoid lumen protein with a stromal intermediate, which was used as a positive control. The translation products (tp), chloroplasts (Cp), thermolysin treated chloroplasts (Cp*), stromal extracts (SE), and total membranes (M) were analyzed with SDS-PAGE and fluorography. Positions of the molecular weight marker are depicted on the left.
PhCM1 and PhCM2 transcript abundance analysis
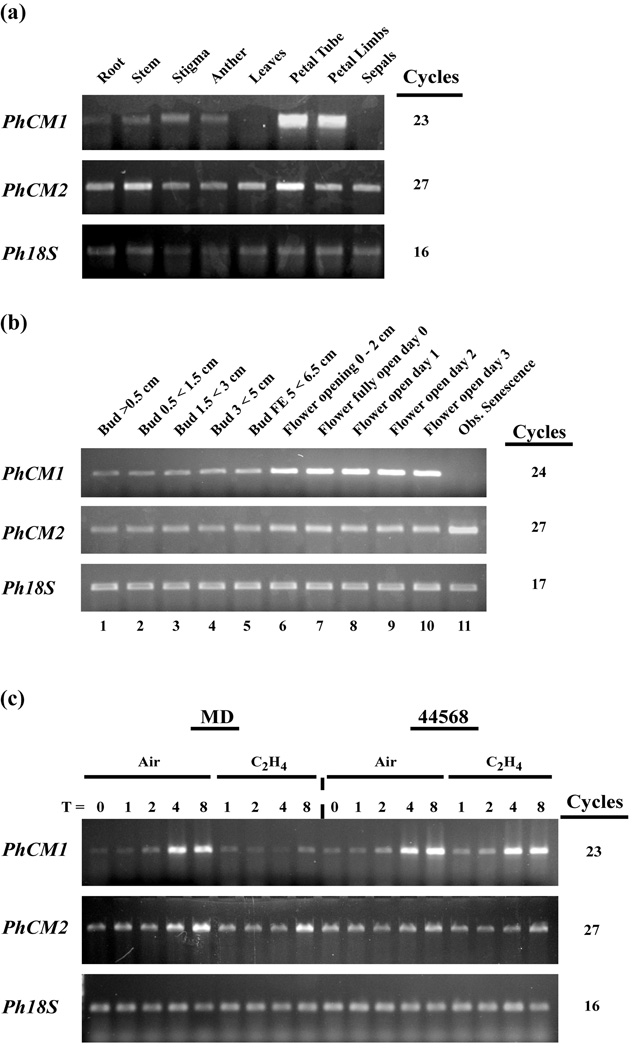
Because of the large drain on the free phenylalanine pool by the FVBP synthesis pathway, we hypothesized that a CM gene would be transcriptionally co-regulated with known FVBP genes. Three criteria of transcript accumulation spatial, flower development, and ethylene treated were chosen for analysis by semi-quantitative reverse transcriptase polymerase chain reaction (sqRT-PCR) and validated by quantitative (q)RT-PCR (Figures 4 and S2). The spatial analysis consisted of root, stem, stigma, anther, leaf, petal tube, petal limb, and sepal tissues (Figures 4a and S2a). PhCM1 transcripts were detected at high levels in the petal limb and tube, and to a much lesser extent in the sexual organs, stem, and root. PhCM2 transcripts were detected in all tissues examined with relatively high levels in the petal tube and stem tissues. The MD flower development series consisted of whole flowers collected at 11 consecutive stages (for a detailed explanation reference Experimental Procedures, under heading Transcript accumulation analysis) beginning from a small bud to floral senescence (Figures 4b and S2b). PhCM1 transcripts were detected at relatively low levels throughout the closed bud stages of development (stages 1–5). Relatively high levels of PhCM1 transcripts were detected at anthesis (stage 6) and throughout all open flower stages of development examined (stage 7–10). PhCM1 transcripts were detected at the lowest level in observably senescing flower tissue (stage 11). PhCM2 transcripts were detected at similar levels throughout all stages examined except for stage 11 (Figures 4b and S2b). The ethylene study used excised whole flowers from MD and an ethylene-insensitive (CaMV 35S::etr1–1) transgenic petunia line, 44568 (Wilkinson et al., 1997). All flowers were treated with air or ethylene (2 µL L−1) for 0, 1, 2, 4, and 8 hours beginning at 12:00 h with an experimental end time of 20:00 h (Figures 4c and S2c). PhCM1 transcripts were reduced in MD flowers after four hours of ethylene treatment compared to air treatments, while no change in PhCM1 transcript level was observed in experiments using 44568. In contrast, PhCM2 transcript levels were unchanged throughout the treatment conditions in both genetic backgrounds. Together, these results indicate the transcript accumulation profile for PhCM1 is similar to that of known FVBP genes and is therefore sufficient for FVBP production.
Figure 4.
sqRT-PCR transcript accumulation analysis of PhCM1 and PhCM2 in petunia. Spatial analysis used root, stem, stigma, anther, leaf, petal tube, petal limb, and sepal tissues of MD harvested at 16:00 h (a). Floral developmental analysis used MD flowers from 11 sequential stages at 16:00 h (b). Ethylene treatment (two µL L-1) analysis used excised MD and 44568 whole flowers treated for 0, 1, 2, 4, and 8 hours (c).The number of cycles used for amplification of each transcript is shown on the right. Ph18S was used as a loading control in all cases.
Total CM activity in petunia flowers
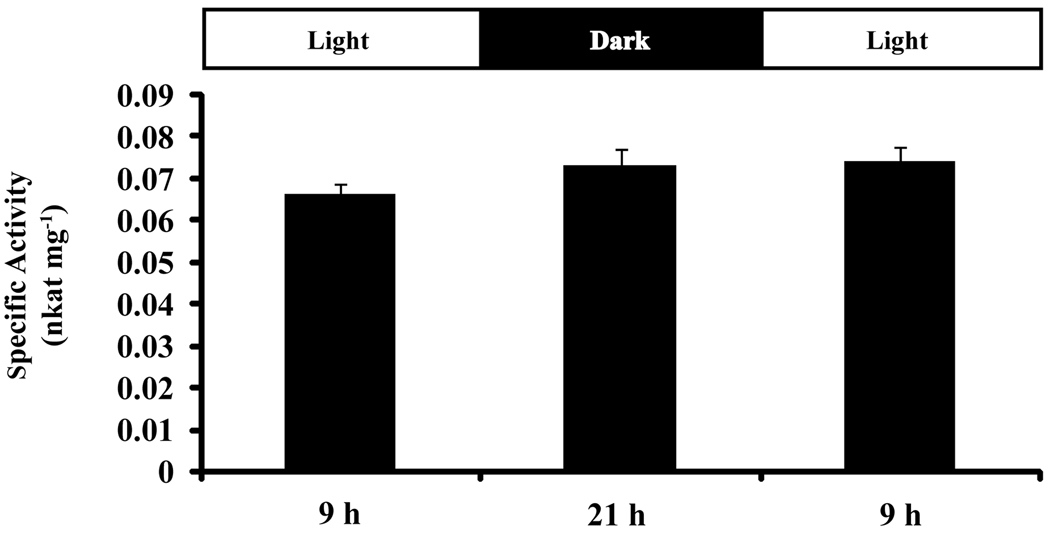
To investigate whether CM activity contributes to daily substrate pool oscillations (Underwood et al., 2005; Orlova et al., 2006) and concomitant rhythmic emission of FVBPs in MD (Verdonk et al., 2005), we developmentally staged MD flowers and collected whole corollas at three time points over the course of 24 h. Desalted crude protein extracts were obtained, and total CM activity was assayed for each time-point with close attention paid to non-enzymatic chorismic acid breakdown (Figure 5). Throughout the three daily time-points, total CM activity was unchanged with an approximate specific activity average of 0.07 nkat mg−1. Not discounting the presence of a regulatory molecule in vivo, which may be lost through the extraction process, total CM activity in crude protein extracts from stage 9 and 10 MD corollas, did not parallel that of FVBP emission profiles.
Figure 5.
Total CM activity in desalted crude protein extracts from MD whole corollas starting at 9 h of stage 9 in flower development. (mean ± se; n = 6)
Functional complementation and recombinant enzyme activity of PhCM1 and PhCM2
In spite of the high homology to other CMs at the amino acid level, it was necessary to test the biochemical function of both PhCM1 and PhCM2. The coding sequences for both genes were cloned into a pET-32 vector and transformed into the CM-deficient E. coli transformant KA12/pKIMP-UAUC, which was provided by Dr. Peter Kast at the Swiss Federal Institute of Technology Zurich. The KA12/pKIMP-UAUC system requires the complementation of both phenylalanine and tyrosine auxotrophies while under a double antibiotic selection and has been well characterized (Kast et al., 1996; Kast et al., 2000). Both pET-32-PhCM1 (without the cTP sequence) and pET-32-PhCM2 complemented KA12/pKIMP-UAUC when grown on minimal media without the addition of phenylalanine and tyrosine as compared to all controls (Table S1). This result indicates both PhCM1 and PhCM2 encode proteins that are sufficient for the enzymatic, intramolecular conversion of chorismic acid to prephenic acid.
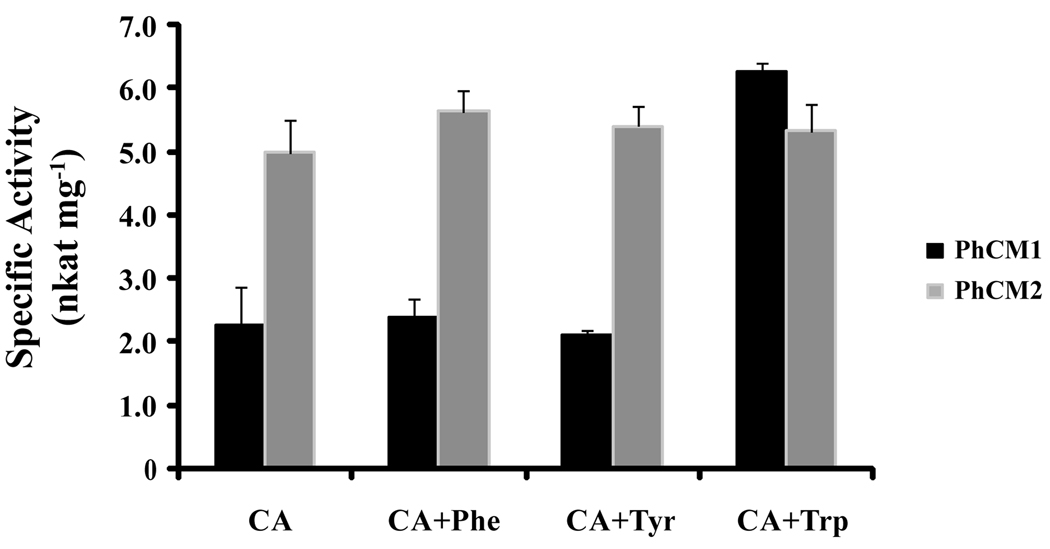
We then utilized the pET-32-CM vectors to transform E. coli strain BL21(DE3)pLysS with the aim of generating recombinant proteins for PhCM1 and PhCM2. PhCM1 and PhCM2 proteins were purified by Ni2+ affinity chromatography and assayed for CM activity with and without the addition of the aromatic amino acids (Figure 6). PhCM2 had a specific activity of approximately 5.0 nkat mg−1 and was not affected by the presence of aromatic amino acids. However, PhCM1 specific activity was close to 2.2 nkat mg−1 and increased approximately three-fold in the presence of tryptophan. As is the case in Arabidopsis, opium poppy, and tomato (Benesova and Bode, 1992; Eberhard et al., 1996a; Eberhard et al., 1996b; Mobley et al., 1999), the cytosolic PhCM2 is not allosterically regulated by the aromatic amino acids. In contrast to allosteric regulation patterns found for plastidic CMs in Arabidopsis and poppy, phenylalanine and tyrosine had no effect on PhCM1 enzymatic activity, but tryptophan regulation is similar in magnitude to AtCM1 (Eberhard et al., 1996b).
Figure 6.
Enzyme activity of and effects of aromatic amino acids on petunia CMs. Recombinant protein was assayed for enzymatic activity in 50 mM KPO4 buffer pH 7.6 with 0.5 mM chorismic acid (CA) as a substrate and 50 uM phenylalanine (Phe), tyrosine (Tyr), and tryptophan (Trp) as allosteric effectors. (mean ± se; n = 4)
Suppression of PhCM1 by RNAi
Because the transcript accumulation profile for PhCM1 is similar to known FVBP genes (Figures 4 and S2) and the subcellular location for PhCM1 is in the plastidial stroma (Figures 2a and 3), PhCM1 was chosen for RNAi mediated gene silencing. A 213 bp fragment at the 3’ end of the PhCM1 coding sequence was used for the RNAi inducing fragment (Figure S3). Since the PhCM1 RNAi fragment was less than 60 % homologous to the corresponding region of PhCM2, we hypothesized PhCM2 expression and possibly any other gene family members would be unaffected by the PhCM1 silencing construct driven by a constitutive promoter (pFMV).
Fifty independent PhCM1 RNAi (ir-PhCM1) plants were generated by leaf disc transformation, and analyzed for reduced levels of PhCM1 transcripts when compared to MD by sqRT-PCR. Eight plants were chosen for further analysis and self-pollinated to produce T1 seeds. Five transgenic T1 ir-PhCM1 lines segregated in an expected 3:1 manner for the transgene, and these lines were more extensively studied for gene transcript accumulation and FVBP emission differences compared to MD. Representative individuals from three independent T1 ir-PhCM1 lines (2–4, 24–9, and 33–9) showed reduced PhCM1 transcript levels, but PhCM2 transcript levels were unchanged (Figure S4). Additionally, when transcript levels of multiple other genes in the shikimate, phenylpropanoid, and FVBP pathways were analyzed, no differences were observed (Figure S4).
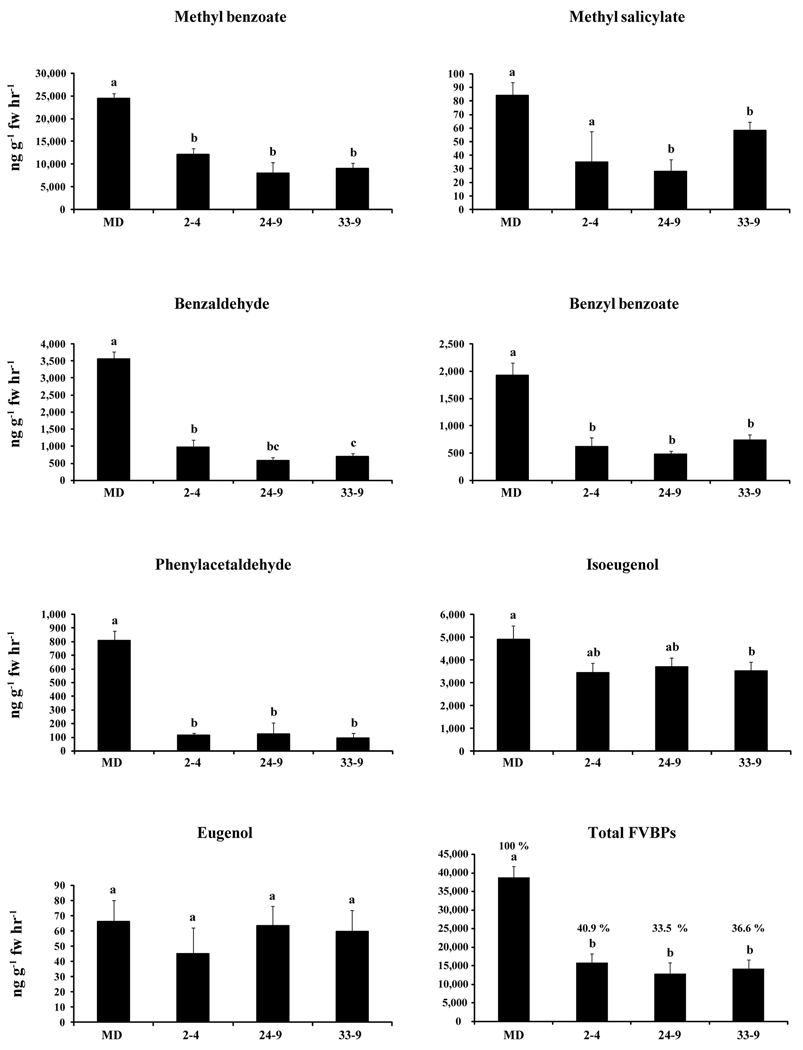
All three selected T1 ir-PhCM1 lines showed similar FVBP emission profiles. Using MD FVBP emission levels as a reference, phenylacetaldehyde was reduced 85 to 89 % in the ir-PhCM1 lines (Figure 7). The emissions of three volatile compounds derived from t-cinnamic acid (benzaldehyde, benzyl benzoate, and methyl benzoate) were reduced by 73 to 84 %, 62 to 75 %, and 50 to 68 %; respectively. Isoeugenol emission was modestly lower in the ir-PhCM1 lines when compared to MD, but was not reduced as much as the rest of the major FVBPs analyzed here. Total FVBP emissions were abated by 33.5 to 40.9 % in the T1 ir-PhCM1 lines as compared to MD (Figure 7). Taken together, these data suggest the lower level of PhCM1 transcripts in the ir-PhCM1 lines resulted in lower levels of prephenic acid available for phenylalanine synthesis, and thus, concomitant FVBP emission.
Figure 7.
Floral volatile emission analysis from three independent T1 PhCM1 RNAi lines (mean ± se; n = 3). Major volatile compounds shown from MD, ir-PhCM1 2–4, ir-PhCM1 24–9, ir-PhCM1 33–9 flowers. Statistical analysis was performed using a Duncan’s multiple range test (P < 0.05) in the SAS® 9.2 software.
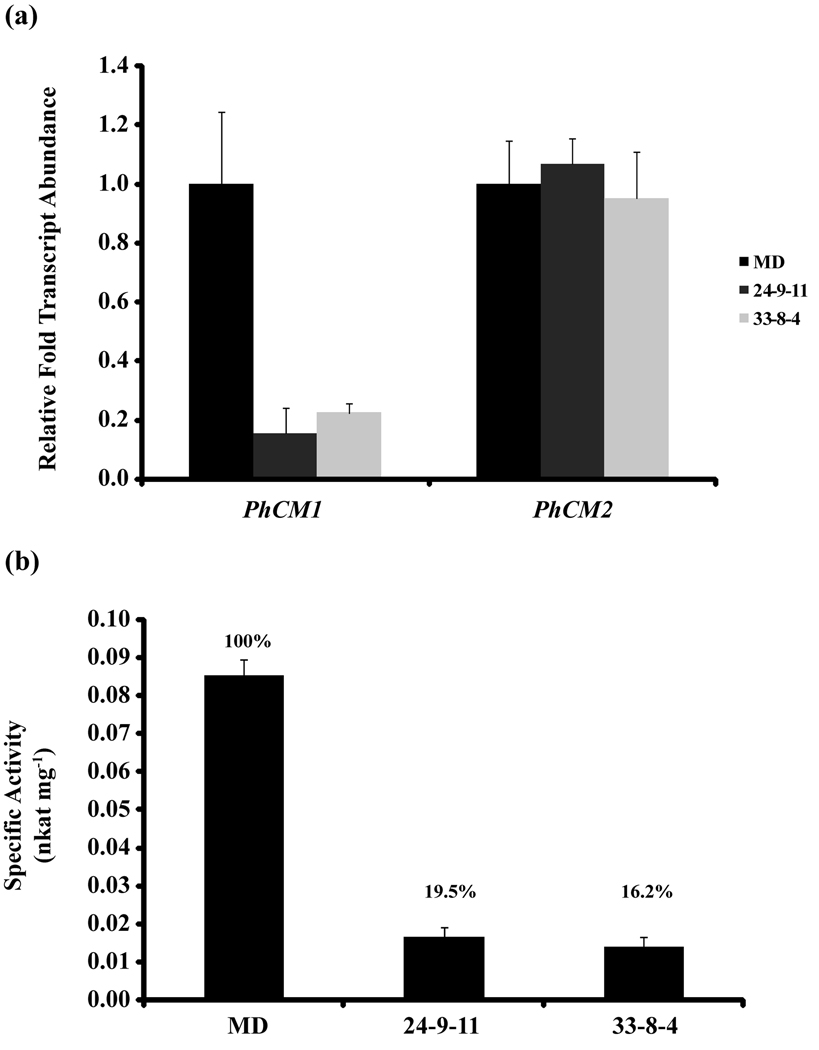
All T1 ir-PhCM1 lines were self-pollinated and T2 generation plants were screened for homozygosity. The screen resulted in two homozygous T2 ir-PhCM1 lines, termed 24–9 and 33–8 (Figure S5). Whole corollas from stage 9 MD, 24–9, and 33–8 plants were used for qRT-PCR transcript accumulation and quantitative total CM activity assays (Figure 8). Compared to MD, transcript accumulation for PhCM1 was reduced in 24–9 and 33–8 by 80 to 85 %, while PhCM2 transcript accumulation was unaffected (Figure 8a). Total CM specific activity from desalted crude extracts from 24–9 and 33–8 was reduced by 81 to 84 % compared to MD (Figure 8b). Together, these results indicate the reduction of PhCM1 transcript and subsequent total CM activity are sufficient for the reduction in total FVBP emission in the ir-PhCM1 lines compared to MD.
Figure 8.
Comparative transcript analysis and total CM activity between MD and representative individuals from independent homozygous T2 ir-PhCM1 lines. (a) qRT-PCR was carried out with two biological replicates and three technical replicates per biological replicate. The entire experiment was done in duplicate, and analyzed by ΔΔCt method with PhFBP1 and Ph18S as the internal references. (b) Total CM activity in desalted crude protein extracts from whole corollas of MD and representative individuals from two independent homozygous T2 ir-PhCM1 lines, 24–9 and 33–8.
24–9 and 33–8 were grown side-by-side with MD numerous times and no observable phenotypic differences were noted. There were no significant differences between MD, 24–9, and 33–8 in seed germination, nor in fresh weight, number of true leaves, aerial height (of nine week old plants), or stem lignin content (Figures S6 and S7).
DISCUSSION
CHORISMATE MUTASE (CM) has been extensively studied in prokaryotes and fungi, but comparatively less is known about CM in higher plants. The enzymatic reaction of CM is the initial committed step in synthesis of the aromatic amino acids phenylalanine and tyrosine (Haslem, 1993), and MD corollas synthesize and emit large quantities of volatile benzenoid/phenylpropanoid compounds, which are derived from phenylalanine (Boatright et al., 2004). Therefore, we chose to investigate CM in petunia flowers through reverse genetic, molecular, biochemical, and metabolic approaches. The results indicate that PhCM1 has a major role in the production of FVBPs in petunia flowers.
In petunia, two CM cDNAs have been isolated. PhCM1 is plastid localized based on a cTP sequence and a chloroplast import assay (ChloroP 1.1; Zybailov et al., 2008) [Figure 3]. Of the two putative plastidic Arabidopsis CMs, PhCM1 shares the highest identity to AtCM1 (Figure 2b). Transcript accumulation suggests that AtCM1 possesses a distinct role in the supply of phenylalanine and tyrosine under stressed conditions, while AtCM3 activity can produce requisite levels of prephenic acid under non-stressed growing conditions (Eberhard et al., 1996b; Mobley et al., 1999). PhCM2 is likely to be located in the cytosol due to the lack of a signal peptide (Figure 2a), inability to be imported into a chloroplast (Figure 3), and the lack of allosteric amino acid regulation (Figures 2a and 6) similar to the cytosolic isoforms in Arabidopsis, tomato, and poppy (AtCM2, LeCM1, and CM2 from poppy) [Benesova and Bode, 1992; Eberhard et al., 1996a; and Eberhard et al., 1996b]. Recently, a subcellular localization study in Arabidopsis leaf tissue with all six arogenate dehydratases and two arogenate dehydrogenases showed these proteins, which are responsible for the ultimate production of phenylalanine and tyrosine (respectively), are plastidic proteins. Furthermore, pathway intermediates are confined to the plastid (Rippert et al., 2009). This indicates cytosolic isoforms of CM are separated from substrate and other pathway proteins under normal growing conditions. Therefore, PhCM2 most likely does not have a major role in the production of prephenic acid during non-stressed growing conditions, as proposed for AtCM3. We searched extensively for additional CM sequences in petunia, but did not isolate a potential PhCM3. That said, two lines of evidence support the existence of other plastidic CM family members in non floral tissues of petunia and at the same time illustrate the biological specificity of PhCM1. (1) The ir-PhCM1 transgenic plants are not observably impaired in vegetative growth compared to MD plants (Figures S6 and S7), but show a specific FVBP phenotype (Figures 7 and 8). (2) Relative transcript accumulation for PhCM1 is extremely low in all tissues examined except the corolla (Figures 4a and S2a). However, production of the aromatic amino acids phenylalanine and tyrosine are essential for cellular processes throughout the plant.
The PhCM1 transcript accumulation profile is congruent with several other known FVBP genes in petunia. High levels of transcripts are detected in corollas from anthesis to senescence, and are reduced by ethylene exposure, which mimics the pollination event (Figure 4). PhCM2 transcript accumulation follows a more constitutive profile with a noticeable exception in senescing floral tissue of MD (stage 11) where transcript accumulates to relatively high levels (Figures 4b and S2b). However, PhCM2 transcript accumulation does not appear to be affected by exogenous ethylene exposure (Figures 4c and S2c). This result implies that an increase in PhCM2 transcript abundance during senescence is not a direct effect of ethylene perceived at that developmental stage, and may provide a favorable situation to examine the biological function of cytosolic CM isoforms in planta.
Since FVBP emission is rhythmic, transcript accumulation from FVBP biosynthetic genes are rhythmic, and intermediate substrate pools in the FVBP pathway oscillate from low to high in the evening (Underwood et al., 2005; Verdonk et al., 2005; Orlova et al., 2006), it is reasonable to hypothesize enzyme activity of one or more proteins in the FVBP pathway oscillate on a daily cycle. However, like PhBSMT activity (Kolosova et al., 2001) total CM activity is not significantly changed from morning to night in desalted crude extracts (Figure 5). In vitro, recombinant PhCM1 activity is increased in the presence of tryptophan (Figure 6), and so oscillations in the free tryptophan pool in vivo cannot be discounted as a regulatory mechanism affecting rhythmic FVBP emission.
AtCM1 and AtCM3 activities are allosterically down-regulated by phenylalanine and tyrosine (Eberhard et al., 1996b; Mobley et al., 1999), but recombinant PhCM1 is unaffected by these aromatic amino acids (Figure 6). Petunia corolla limb tissue accumulates a large free phenylalanine pool in the evening with a calculated concentration of 5.5 mM (Boatright et al., 2004; Kaminaga et al., 2006). Therefore, PhCM1 is sufficient to direct the flux of chorismic acid to the production of phenylalanine without feedback inhibition in the petunia flower. However, it must be noted that the phenylalanine concentration reported in petunia flowers is a whole tissue measurement, and compartmentalization of the free phenylalanine pool and PhCM1 at a subcellular level remains a plausible mechanism allowing for the large phenylalanine pool. That said, Arabidopsis thaliana tissues may not have a biological need for such a large phenylalanine pool, and it would be of interest to assay allosteric regulation of CMs from Arabidopsis lyrata ssp. Petraea, an outcrossing perennial, which emits relatively high levels of benzaldehyde and phenylacetaldehyde from floral tissues (Abel et al., 2009).
RNAi mediated gene silencing produced transgenic petunia plants (ir-PhCM1) reduced in PhCM1 transcript, but not PhCM2 (Figure 8a), and total CM enzyme activity (Figure 8b) with a concomitant reduction of FVBP emission (Figure 7). Therefore, PhCM1 has a central role in the production of FVBPs in a petunia flower. Interestingly, total FVPB emission is reduced in ir-PhCM1 lines to about 40 % compared to MD and recombinant PhCM1 activity is increased over two fold in the presence of tryptophan (Figure 6). Therefore it is plausible the 20 % total CM activity would be increased in vivo by a presumably high level of tryptophan in the flowers of the RNAi lines.
Metabolic analysis of the ir-PhCM1 lines (Figure 7) may illustrate the “demand” for substrate at each branch of the FVBP pathway. FVBPs derived directly from phenylalanine are the most affected by limiting substrate conditions, while the benzenoids formed from t-cinnamic acid are affected significantly but to a lesser extent (Figure 7). In contrast, the phenylpropanoids derived from coniferyl acetate are the FVBPs least affected in the ir-PhCM1 lines. However, too many variables may exist in the regulation at each branch point of the pathway, and therefore we can only speculate. PhCM1 RNAi lines in conjugation with metabolite labeling experiments may aid in delineating the flux through the FVBP pathway in the future.
EXPERIMENTAL PROCEDURES
Plant materials
Inbred Petunia x hybrida cv ‘Mitchell Diploid’ (MD) plants were utilized as a ‘wild-type’ control in all experiments. The ethylene-insensitive CaMV 35S:etr1–1 line 44568, generated in the MD genetic background (Wilkinson et al., 1997), was utilized as a negative control for ethylene sensitivity where applicable. MD, 44568, and PhCM1 RNAi plants were grown as previously described (Dexter et al., 2007). Ethylene treatments used two µL L−1 of ethylene with air treatments for controls.
cDNA isolation
Partial sequences from the SGN (http://www.sgn.cornell.edu) petunia EST database (Unigene: SGN-U208050) and from a petunia root EST collection (EST ID: dr001P0018N07_F.ab1), courtesy of Didier Reinhardt at the University of Fribourg, were used as references to obtain full-length cDNAs by 5’ and 3’ race with the SMART™ RACE cDNA Amplification Kit (Clontech Laboratories, Inc., Mountain View, CA) as per manufacturer’s protocol. A resulting 1257 bp cDNA had a 975 bp coding sequence (GenBank accession number: EU751616) for a predicted 324 amino acid protein and was termed PhCM1, while another 913 bp cDNA had a 792 bp coding sequence (EU751617) for a predicted 263 amino acid protein termed PhCM2. Both PhCM1 and PhCM2 coding sequences were amplified by Phusion™ Hot Start High-Fidelity DNA Polymerase (New England Biolabs, Inc., Ipswich, MA) and were cloned into a pGEM®T-EASY vector (Promega Corp., Madison, WI), which were extensively sequenced and checked for errors. These constructs were used as template to clone the predicted mature PhCM1 and PhCM2 coding sequences into a pET-32 EK/LIC vector (Novagen, Gibbstown, NJ).
Transcript accumulation analysis
All experiments were conducted with at least two biological replicates with equivalent results observed. In all cases, total RNA was extracted as previously described (Verdonk et al., 2003) and subjected to TURBO™ DNase treatment (Ambion Inc., Austin, TX) followed by total RNA purification with RNeasy® Mini protocol for RNA cleanup (Qiagen, Valencia, CA). Total RNA was then quantified on a NanoDrop™ 1000 spectrophotometer (Thermo Scientific, Wilmington, DE) and 50 ng/µl dilutions were prepared and stored at −20°C.
Semi-quantitative (sq)RT-PCR was performed on a Veriti™ 96-well thermal cycler (Applied Biosystems, Foster City, CA). All sqRT-PCR reactions used a Qiagen One-step RT-PCR kit with 50 ng total RNA template. To visualize RNA loading concentrations, samples were amplified with Ph18S primers and analyzed on an agarose gel. Gene specific primers were designed and utilized for the visualization of the relative transcript accumulation levels (Table S2).
The spatial transcript accumulation series consisted of total RNA isolated from root, stem stigma, anther, leaf, petal tube, petal limb, and sepal tissues of three individual MD plants at 16:00 h on multiple occasions over the course of a year. The developmental transcript accumulation series consisted of MD floral tissue collected at eleven different stages; floral bud < 0.5 cm (stage 1), bud 0.5 < 1.5 cm (2), bud 1.5 < 3.0 cm (3), bud 3.0 < 5.0 cm (4), bud fully elongated 5.0 < 6.5 cm (5), flower opening 0 < 2 cm limb diameter (anthesis) [6], flower fully open day 0 (7), day 1 (8), day 2 (9), day 3 (10), and observably senescing flower (flower open day 7 for MD), stage 11. All tissues were collected at 16:00 h on the same day, and total RNA was isolated from all samples collected. The developmental tissue collections were conducted multiple times over the course of a year. The exogenous ethylene series consisted of excised MD and 44568 stage 9 flowers (placed in tap water) placed into eight tanks, four for ethylene treatments and four for air treatments. Air and ethylene treatments were conducted for 0, 1, 2, 4, and 8 hours starting at 12:00 h. Immediately following treatment, each of the flower samples were collected, stored at −80°C, and total RNA was isolated from all corolla tissues once all samples had been collected. The ethylene treatment experiment consisted of two biological replicates and was conducted twice. For all tissue collections individual samples consisted of three flowers.
Quantitative (q)RT-PCR was performed and analyzed on a MyIQ real-time PCR detection system (Bio-Rad Laboratories Inc., Hercules, CA). Stage 9, whole corolla tissue was collected from MD and two independent homozygous T2 PhCM1 RNAi lines at 16:00 h. Total RNA was isolated from all samples as described earlier and transcript accumulation was initially analyzed by sqRT-PCR. For subsequent qRT-PCR analysis the Power SYBR® Green RNA-to-Ct™ 1-Step Kit (Applied Biosystems, Foster City, CA) was used to amplify and detect resulting products following the manufacturer’s protocol. qRT-PCR primers (Table S2) were constructed with Primer Express® software v2.0 (Applied Biosystems, Foster City, CA), demonstrated gene specificity during melt curve analysis, and then optimized.
Protein extraction, overproduction, and purification
Desalted crude protein extracts were obtained from whole corolla tissue by grinding in a mortar and pestle with liquid Nitrogen until a fine powder, addition of chilled extraction buffer (50 mM Bis Tris HCl pH 6.9, 10 mM B-mercaptoethanol, 5 mM Na2S2O5, 1 % PVP, 1:100 protease inhibitor cocktail [Sigma, P9599], and 10 % glycerol), centrifugation at 4°C (Beckman Coulter™, Avanti™ J-25) to separate cellular debris, and further separation of low molecular weight substances with a PD-10 desalting column (GE Healthcare, Piscataway, NJ). Total crude protein concentration was determined by the Bradford method using BSA as a standard (Rio-Rad).
Biologically active pET-32-PhCM1 and pET-32-PhCM2 were expressed in E. coli BL21(DE3)/pLysS with an induction of 1 mM IPTG overnight at 37°C. Induction was analyzed from crude cellular extracts on a 10 % polyacrylamide, Tris-HCl Ready Gel (Bio-Rad). Soluble protein was obtained from induced cells lysed with BugBuster® protein extract reagent and affinity purified with His-Band® resin chromatography (Novagen). The resulting recombinant proteins were then separated from any low molecular weight compounds and concentrated with 30,000 NMWL Amicon® Ultra-4 centrifugal filter devices (Millipore, Billerica, MA). Recombinant protein concentration was determined by the Bradford method using BSA as a standard.
Chorismate Mutase enzyme activity assays
Specific activities in vitro were resolved by carefully following the absorbance of chorismic acid spectrophotometrically (Bio-Rad, SmartSpec™ 3000) at 274 nm (ε = 2630 M−1 cm−1) (Gilchrist and Connelly, 1987; Kast et al., 1996). All assays were conducted at 30°C with 0.5 mM chorismic acid (> 90 %, Sigma, C1761) in 50 mM KPO4 buffer, pH 7.6. Where stated, 50 uM phenylalanine, tyrosine, and tryptophan (Sigma: P2126, T3754, and T0254; respectively) were used to assay for allosteric regulation of enzyme activity. Non-enzymatic chorismic acid breakdown along with inactive protein controls were used to normalize all data generated. Additionally, no activity was detected when purified tag fusion proteins from the empty pET-32 vector were used. Multiple biological replicates and corresponding technical replicates were used to generate all data shown.
Chloroplast import assay
Full-length coding sequences for PhCM1 and PhCM2 were cloned into a pGEM®-T Easy (Promega, Madison, WI) vector in the SP6 orientation. The chloroplast import assay was conducted as described previously (Martin et al., 2009). Briefly, in vitro transcription and translation with wheat germ TNT (Promega, Madison, WI) resulted in radiolabeled PhCM1, PhCM2, and PsOE23, which were individually incubated with isolated pea chloroplasts for 15 min. After import, the isolated chloroplasts were treated with 100 µg ml−1 thermolysin for 40 min at 4°C as depicted in the figure. Proteolysis was terminated by the addition of EDTA to a final concentration of 10 mM, and the intact chloroplasts were then repurified by centrifugation through 35 % Percoll. Chloroplasts were washed, lysed, and fractionated into total membranes and stromal extracts by centrifugation for 18 min at 15,000 × g. The translation products, chloroplasts, thermolysin treated chloroplasts, stromal extracts, and total membranes were analyzed with SDS-PAGE and fluorography. In figure 3, PhCM2 and PsOE23 are from a 20 hour exposure. PhCM1 is from a 4 day exposure. These are from two different gels of the same samples loaded the same. The panels have been cropped and contrast adjusted, but no other modifications.
Volatile emission
For all volatile emission experiments, emitted floral volatiles from excised flowers were collected at 17:00 h and quantified as previously described (Underwood et al., 2005; Dexter et al., 2007).
Generation of ir-PhCM1 transgenic petunia
The generation of ir-PhCM1 transgenic plants was as describe earlier (Dexter et al., 2007), but with two fragments of the PhCM1 cDNA (Figure S3) amplified and ligated end to end in a sense/antisense orientation with additional sequence information used for an inter-fragment intron (hairpin).
Supplementary Material
ACKNOWLEDGEMENTS
This work was supported by grants from the USDA Nursery and Floral Crops Initiative (grant #: 00058029), the Fred C. Gloeckner Foundation (grant #: 00070429), Florida Agricultural Experiment Station (grant #: 00079097), and in part by National Institutes of Health (grant #: R01 GM46951 to KC). The authors wish to thank Dr. Harry Klee (Horticultural Sciences Department, University of Florida) for critically reviewing the manuscript and Dr. Peter Kast (Swiss Federal Institute of Technology Zurich, Switzerland) for providing the CM-deficient E. coli transformant KA12/pKIMP-UAUC.
Footnotes
REFERENCES
- Abel C, Clauss M, Schaub A, Gershenzon J, Tholl D. Floral and insect-induced volatile formation in Arabidopsis lyrata ssp. petraea, a perennial, outcrossing relative of A. thaliana. Planta. 2009 doi: 10.1007/s00425-009-0921-7. 10.1007/s00425-009-0921-7. [DOI] [PMC free article] [PubMed] [Google Scholar]
- Achnine L, Blancaflor EB, Rasmussen S, Dixon RA. Colocalization of L-phenylalanine ammonia-lyase and cinnamate 4-hydroxylase for metabolic channeling in phenylpropanoid biosynthesis. Plant Cell. 2004;16:3098–3109. doi: 10.1105/tpc.104.024406. [DOI] [PMC free article] [PubMed] [Google Scholar]
- Benesova M, Bode R. Chorismate Mutase Isoforms from Seeds and Seedlings of Papaver-Somniferum. Phytochemistry. 1992;31:2983–2987. [Google Scholar]
- Boatright J, Negre F, Chen X, Kish CM, Wood B, Peel G, Orlova I, Gang D, Rhodes D, Dudareva N. Understanding in vivo benzenoid metabolism in petunia petal tissue. Plant Physiol. 2004;135:1993–2011. doi: 10.1104/pp.104.045468. [DOI] [PMC free article] [PubMed] [Google Scholar]
- Dexter R, Qualley A, Kish CM, Ma CJ, Koeduka T, Nagegowda DA, Dudareva N, Pichersky E, Clark DG. Characterization of a petunia acetyltransferase involved in the biosynthesis of the floral volatile isoeugenol. Plant J. 2007;49:265–275. doi: 10.1111/j.1365-313X.2006.02954.x. [DOI] [PubMed] [Google Scholar]
- Dexter RJ, Verdonk JC, Underwood BA, Shibuya K, Schmelz EA, Clark DG. Tissue-specific PhBPBT expression is differentially regulated in response to endogenous ethylene. J Exp Bot. 2008;59:609–618. doi: 10.1093/jxb/erm337. [DOI] [PubMed] [Google Scholar]
- Dudareva N, Negre F, Nagegowda D, Orlova I. Plant volatiles: Recent advances and future perspectives. CRIT REV PLANT SCI. 2006;25:417–440. [Google Scholar]
- Eberhard J, Bischoff M, Raesecke HR, Amrhein N, Schmid J. Isolation of a cDNA from tomato coding for an unregulated, cytosolic chorismate mutase. Plant Mol. Biol. 1996a;31:917–922. doi: 10.1007/BF00019479. [DOI] [PubMed] [Google Scholar]
- Eberhard J, Ehrler TT, Epple P, Felix G, Raesecke HR, Amrhein N, Schmid J. Cytosolic and plastidic chorismate mutase isozymes from Arabidopsis thaliana: molecular characterization and enzymatic properties. Plant J. 1996b;10:815–821. doi: 10.1046/j.1365-313x.1996.10050815.x. [DOI] [PubMed] [Google Scholar]
- Fenster C, Armbruster W, Wilson P, Dudash M, Thomson J. Pollination syndromes and floral specialization. ANNU REV ECOL EVOL S. 2004;35:375–403. [Google Scholar]
- Gilchrist DG, Connelly JA. Chorismate Mutase from Mung Bean and Sorghum. Methods Enzymol. 1987;142:450–463. [Google Scholar]
- Haslam E. Shikimic Acid: Metabolism and Metabolites. New York: Wiley; 1993. [Google Scholar]
- Herrmann KM, Weaver LM. The Shikimate Pathway. Annu Rev Plant Physiol Plant Mol Biol. 1999;50:473–503. doi: 10.1146/annurev.arplant.50.1.473. [DOI] [PubMed] [Google Scholar]
- Hoekstra F, Weges R. Lack of control by early pistillate ethylene of the accelerated wilting of petunia -hybrida flowers. Plant Physiol. 1986;80:403–408. doi: 10.1104/pp.80.2.403. [DOI] [PMC free article] [PubMed] [Google Scholar]
- Kaminaga Y, Schnepp J, Peel G, Kish CM, Ben-Nissan G, Weiss D, Orlova I, Lavie O, Rhodes D, Wood K, Porterfield DM, Cooper AJ, Schloss JV, Pichersky E, Vainstein A, Dudareva N. Plant phenylacetaldehyde synthase is a bifunctional homotetrameric enzyme that catalyzes phenylalanine decarboxylation and oxidation. J. Biol. Chem. 2006;281:23357–23366. doi: 10.1074/jbc.M602708200. [DOI] [PubMed] [Google Scholar]
- Kast P, Asif-Ullah M, Jiang N, Hilvert D. Exploring the active site of chorismate mutase by combinatorial mutagenesis and selection: the importance of electrostatic catalysis. Proc. Natl. Acad. Sci. U. S. A. 1996;93:5043–5048. doi: 10.1073/pnas.93.10.5043. [DOI] [PMC free article] [PubMed] [Google Scholar]
- Kast P, Grisostomi C, Chen IA, Li S, Krengel U, Xue Y, Hilvert D. A strategically positioned cation is crucial for efficient catalysis by chorismate mutase. J. Biol. Chem. 2000;275:36832–36838. doi: 10.1074/jbc.M006351200. [DOI] [PubMed] [Google Scholar]
- Koeduka T, Louie GV, Orlova I, Kish CM, Ibdah M, Wilkerson CG, Bowman ME, Baiga TJ, Noel JP, Dudareva N, Pichersky E. The multiple phenylpropene synthases in both Clarkia breweri and Petunia hybrida represent two distinct protein lineages. Plant J. 2008;54:362–374. doi: 10.1111/j.1365-313X.2008.03412.x. [DOI] [PMC free article] [PubMed] [Google Scholar]
- Koeduka T, Fridman E, Gang DR, Vassao DG, Jackson BL, Kish CM, Orlova I, Spassova SM, Lewis NG, Noel JP, Baiga TJ, Dudareva N, Pichersky E. Eugenol and isoeugenol, characteristic aromatic constituents of spices, are biosynthesized via reduction of a coniferyl alcohol ester. Proc. Natl. Acad. Sci. U. S. A. 2006;103:10128–10133. doi: 10.1073/pnas.0603732103. [DOI] [PMC free article] [PubMed] [Google Scholar]
- Kolosova N, Gorenstein N, Kish CM, Dudareva N. Regulation of circadian methyl benzoate emission in diurnally and nocturnally emitting plants. Plant Cell. 2001;13:2333–2347. doi: 10.1105/tpc.010162. [DOI] [PMC free article] [PubMed] [Google Scholar]
- Martin JR, Harwood JH, McCaffery M, Fernandez DE, Cline K. Localization and integration of thylakoid protein translocase subunit cpTatC. Plant J. 2009;58:831–842. doi: 10.1111/j.1365-313X.2009.03816.x. [DOI] [PMC free article] [PubMed] [Google Scholar]
- Mobley EM, Kunkel BN, Keith B. Identification, characterization and comparative analysis of a novel chorismate mutase gene in Arabidopsis thaliana. Gene. 1999;240:115–123. doi: 10.1016/s0378-1119(99)00423-0. [DOI] [PubMed] [Google Scholar]
- Negre F, Kish CM, Boatright J, Underwood B, Shibuya K, Wagner C, Clark DG, Dudareva N. Regulation of methylbenzoate emission after pollination in snapdragon and petunia flowers. Plant Cell. 2003;15:2992–3006. doi: 10.1105/tpc.016766. [DOI] [PMC free article] [PubMed] [Google Scholar]
- Orlova I, Marshall-Colon A, Schnepp J, Wood B, Varbanova M, Fridman E, Blakeslee JJ, Peer WA, Murphy AS, Rhodes D, Pichersky E, Dudareva N. Reduction of benzenoid synthesis in petunia flowers reveals multiple pathways to benzoic acid and enhancement in auxin transport. Plant Cell. 2006;18:3458–3475. doi: 10.1105/tpc.106.046227. [DOI] [PMC free article] [PubMed] [Google Scholar]
- Pichersky E, Noel JP, Dudareva N. Biosynthesis of plant volatiles: nature's diversity and ingenuity. Science. 2006;311:808–811. doi: 10.1126/science.1118510. [DOI] [PMC free article] [PubMed] [Google Scholar]
- Rippert P, Puyaubert J, Grisollet D, Derrier L, Matringe M. Tyrosine and Phenylalanine Are Synthesized within the Plastids in Arabidopsis. Plant Physiol. 2009;149:1251–1260. doi: 10.1104/pp.108.130070. [DOI] [PMC free article] [PubMed] [Google Scholar]
- Schuurink RC, Haring MA, Clark DG. Regulation of volatile benzenoid biosynthesis in petunia flowers. Trends Plant Sci. 2006;11:20–25. doi: 10.1016/j.tplants.2005.09.009. [DOI] [PubMed] [Google Scholar]
- Underwood BA, Tieman DM, Shibuya K, Dexter RJ, Loucas HM, Simkin AJ, Sims CA, Schmelz EA, Klee HJ, Clark DG. Ethylene-regulated floral volatile synthesis in petunia corollas. Plant Physiol. 2005;138:255–266. doi: 10.1104/pp.104.051144. [DOI] [PMC free article] [PubMed] [Google Scholar]
- Verdonk JC, Haring MA, van Tunen AJ, Schuurink RC. ODORANT1 Regulates Fragrance Biosynthesis in Petunia Flowers. Plant Cell. 2005;17:1612–1624. doi: 10.1105/tpc.104.028837. [DOI] [PMC free article] [PubMed] [Google Scholar]
- Verdonk JC, Ric de Vos CH, Verhoeven HA, Haring MA, van Tunen AJ, Schuurink RC. Regulation of floral scent production in petunia revealed by targeted metabolomics. Phytochemistry. 2003;62:997–1008. doi: 10.1016/s0031-9422(02)00707-0. [DOI] [PubMed] [Google Scholar]
- Wilkinson JQ, Lanahan MB, Clark DG, Bleecker AB, Chang C, Meyerowitz EM, Klee HJ. A dominant mutant receptor from Arabidopsis confers ethylene insensitivity in heterologous plants. Nat. Biotechnol. 1997;15:444–447. doi: 10.1038/nbt0597-444. [DOI] [PubMed] [Google Scholar]
- Zybailov B, Rutschow H, Friso G, Rudella A, Emanuelsson O, Sun Q, van Wijk KJ. Sorting signals, N-terminal modifications and abundance of the chloroplast proteome. PLoS ONE. 2008;3:e1994. doi: 10.1371/journal.pone.0001994. [DOI] [PMC free article] [PubMed] [Google Scholar]
Associated Data
This section collects any data citations, data availability statements, or supplementary materials included in this article.


