

Abstract
Recent studies have implicated the cell surface receptor Programmed Death-1 (PD-1) in numerous models of T cell anergy, though the specific mechanisms by which the PD-1 signal maintains tolerance is not clear. We demonstrate that the depletion of PD-1 with siRNA results in a complete reversal of clonal anergy in the A.E7 T cell model, suggesting that the mechanism by which PD-1 maintains the anergic phenotype is a T-cell-intrinsic phenomenon, and not one dependent on other cell populations in vivo. We have also shown that the neutralization of IL-2 during restimulation abrogates the effect of PD-1 depletion, suggesting that tolerance mediated by PD-1 is wholly IL-2 dependent, and likewise intrinsic to the tolerized cells.
1. Introduction
The immunosuppressive agents used in current transplantation protocols are known to increase the risk of infection and neoplasia due to their nonspecific dampening of the immune response [1–3]. One alternative to generalized suppression of the immune system is a more tailored approach that seeks to induce a state of selective peripheral tolerance specifically to transplanted grafts [4–7]. Inducing an allo-specific tolerant state would permit the introduction of an organ graft into an otherwise fully competent immune environment, capable of immune surveillance and pathogen eradication. The mechanisms that generate peripheral transplantation tolerance are not yet fully elucidated, but it is known that grafts are rejected as the result of both acute and chronic immune activation [8], processes that involve numerous immune mechanisms [9–11]. It is well accepted that CD4+ T lymphocytes are central to the rejection of allografts and that they are also necessary for the successful induction of tolerance [4, 12]. A number of immune processes discovered in animal models that are posited to result in immunological tolerance include clonal deletion, suppression of reactive lymphocyte subsets by regulatory T cells, and T cell anergy [13, 14].
CD4+ T lymphocytes require two signals for optimal activation and production of IL-2, which drive entry into the cell cycle and subsequent clonal expansion [15, 16]. Signal 1 is delivered through the TCR upon encounter with antigen. When signal 1 is delivered in the absence of a costimulatory signal, known as signal 2, the levels of IL-2 produced are not sufficient to drive clonal expansion. Instead, the T cell acquires a phenotype characterized by antigen unresponsiveness defined as clonal anergy [17]. After a T cell is rendered anergic, it is unable to produce IL-2 or proliferate, even when provided a signal through the TCR in the presence of costimulation. Early studies demonstrated that anergy is an active phenotype that in vitro requires protein synthesis and can be prevented by treatment with cycloheximide and cyclosporine A [18]. These findings suggest that anergy is established through a TCR-dependent signal transduction pathway.
The search for factors that participate in this putative anergy pathway is ongoing. A number of genes that are upregulated early in the course of anergy induction in T cells have been identified. These include the transcription factor Egr-2 [19, 20] and the E3-ubiquitin ligases Cbl-b [21, 22] and GRAIL [23, 24]. Recent studies have shown that the products of these genes are each necessary for establishing the anergic phenotype. We have previously shown that Egr-2 is necessary for the induction of anergy, but does not appear to have a role in maintaining unresponsiveness once the anergic phenotype is established [19].
The aims of this study were to identify genes that are differentially expressed during the maintenance phase of anergy and to determine whether they contribute to the anergic phenotype. We show that PD-1, a known negative costimulatory receptor [25], is upregulated in anergic cells for at least five days after anergy induction, and that depletion of PD-1 protein levels with RNAi at this time results in complete, IL-2-dependent reversal of the anergic phenotype. We further show that, at this late time point, the effect of PD-1 depletion is specific to anergic cells, as treatment of fully costimulated cells with siRNA directed against PD-1 does not increase antigen responsiveness.
2. Methods
2.1 Mice
B10.BR (H2k) and BALB/c (H2d) mice were purchased from The Jackson Laboratory (Bar Harbor, ME). All animals were certified to be free of Sendai virus, pneumonia virus of mice, murine hepatitis virus, minute virus of mice, ectromelia, LDH elevating virus, mouse poliovirus, Reo-3 virus, mouse adenovirus, lymphocytic choriomeningitis virus, polyoma, Mycoplasma pulmonis, and Encephalitozoon cuniculi. They were housed in a specific pathogen free facility in microisolator cages, and given autoclaved food and acidified water ad libitum. All animal use was in accordance with the guidelines of the Institutional Animal Care and Use Committee (IACUC) of the University of Massachusetts Medical School and recommendations in the Guide for the Care and Use of Laboratory Animals (Institute of Laboratory Animal Resources, National Research Council, National Academy of Sciences, 1996).
2.2 In vitro T cell line
The pigeon cytochrome c (PCC)-specific, and I-Ek restricted CD4+ murine helper T cell clone A.E7 was the gift of R. Schwartz (NIH, Bethesda, MD), and the cultivation of these cells has been described [18]. Briefly, A.E7 T cells were stimulated with irradiated B10.BR (H2k) splenocytes and 8 M whole PCC (Sigma-Aldrich, St. Louis, MO) for 48 hours, expanded 20:1 in 15 U/ml of recombinant IL-2, and cultured for a minimum of 12 days before use in all experiments.
2.3 Anergy induction
A.E7 T cells were isolated over a Ficoll gradient (Lympholyte M, Accurate Chemical & Scientific Corp., Westbury, NY) and anergy was induced by overnight incubation of 20–40×106 cells in a T75 or 100×106 cells in a T175 tissue culture flask (BD Falcon, Bedford, MA) that had previously been coated with anti-CD3 monoclonal antibody (clone 145-2C11, BD Biosciences Pharmingen, San Diego, CA) at a concentration of 1 g/ml. Fully stimulated cell cultures were supplemented with soluble anti-CD28 monoclonal antibody (clone 37.51, BD Biosciences Pharmingen) at a concentration of 1 g/ml. Mock stimulated cultures received no stimulatory antibodies (untreated). After 12 hours, cells were removed from the stimulatory medium, washed, and cultured in fresh medium for varying times as indicated.
2.4 Proliferation assay
Proliferation was assayed by [3H]-thymidine incorporation into DNA. Briefly, cells were cultured with irradiated syngeneic (B10.BR) splenocytes plus increasing doses of PCC antigen for 64–70 hours and pulsed during the final 16 hours with 1 Ci of [3H]-thymidine.
2.5 Microarray Procedures
Microarray analysis on mock-stimulated, anergized, or fully activated A.E7 T cells has been described [19].
2.6 Quantitative Real Time PCR
Total RNA was prepared using an RNeasy kit (Qiagen). cDNA was synthesized using oligo-dT primers and reverse transcriptase AMV (Roche, Indianapolis, IN) according to manufacturer’s instructions. Quantitative real-time PCR was performed in a Light Cycler (Roche) using a LightCycle DNA Master SYBR Green I PCR kit (Roche) and TaqStart Antibody (Clonetech, Mountain View, CA). Primers used were: PD-1: sense: 5′-CCGCTTCCAGATCATACAG-3′, antisense: 5′ CTCTGGCCTCTGACATACTTG-3′, product = 329 bp; and HPRT: sense: 5′ TTAGCGATGATGAACCAGGTTAT-3′, antisense: 5′ TGGCCTGTATCCAACACTTC-3′, product = 490 bp.
2.7 Western Blotting
Cells were washed once in cold PBS, lysed in SDS gel-loading buffer without 2-mercaptoethanol (2-ME) or bromophenol blue, boiled for 5 minutes, and quantified by BCA protein assay (Pierce, Rockford, IL). 2-ME and bromophenol blue were then added to the lysates and 20 g of protein was run on a 10% SDS gel. Protein was transferred to a PVDF membrane and blots were probed with anti-PD-1 antibody (R&D Systems, Minneapolis, MN) (0.1 μg/ml) followed by anti-goat secondary antibody conjugated to horseradish peroxidase (Chemicon Int., Temecula, CA) diluted 1:50,000 and developed for visualization by enhanced chemiluminescence (Pierce, Rockford, IL). Blots were probed for actin with anti-actin antibody (Sigma-Aldrich)(1:50,000), goat anti-mouse secondary antibody (1:10,000 dilution, Chemicon Int.), and developed by enhanced chemiluminescence (Perkin Elmer, Boston, MA).
2.8 siRNA Transfection
SMARTpool siRNA duplex cocktails were purchased from Dharmacon, Inc (Lafayette, CO) corresponding to the GenBank nucleotide sequences for Pdcd1 (PD-1) (NM_008798) and Egr-2 (NM_010118). The PD-1 SMARTpool was composed of the siRNA duplexes (sense strand): duplex 1: uau cau gag ugc ccu agu guu; duplex 2: gau gcc cgc uuc cag auc auu; duplex 3: gaa cug gaa ccg ccu gag uuu; duplex 4: gca agg acg aca cuc uga auu. An siRNA duplex with the sequence cag ucg cgu uug cga cug gdt dt that does not correspond to any sequence published in GenBank was used as a control in each of the experiments. The Egr-2 siRNA SMARTpool sequences have been previously published [19].
A.E7 T cells were electroporated with 20 nmoles of siRNA duplexes in 0.5 ml complete growth medium at a density of 60×106/ml in a 0.4 cm GenePulser cuvette (BioRad, Hercules, CA). The electroporation was performed with a GenePulser electroporator II (BioRad) at 310 mV, 950 mF. Cells were allowed to recover for 10 minutes on ice, then added to complete growth medium.
2.9 IL-2 Neutralization
To block autocrine IL-2 signaling, 10 μg/ml of IL-2 neutralizing antibody (Clone S4B6, BD Biosciences Pharmingen) was included in the challenge culture. As a control, an equal concentration of rat IgG2a isotype control antibody was used. Proliferation was assessed as described above.
3. Results
3.1 TCR stimulation alone renders T cells unresponsive to antigenic rechallenge
It is well established that antibody stimulation of T cell clones through the CD3 subunit of the TCR (signal 1) results in the induction of the anergic phenotype, and that anergy can be prevented if an agonist anti-CD28 antibody (signal 2) is added to the cell culture [17]. A.E7 CD4+ Th1 T cells respond to stimulation with the pigeon cytochrome C (PCC) peptide (residues 81–103) and have been shown to be a useful model in which both anergy and full stimulation can be investigated [17–19,26]. We have previously identified optimal culture conditions for the identification of genes with unique expression profiles in anergic A.E7 T cells [19]. A.E7 T cells were either left untreated, anergized with immobilized anti-CD3 monoclonal antibody alone, or stimulated with anti-CD3 plus anti-CD28 monoclonal antibodies for 12 hours. The cells were then washed and recultured for an additional five days prior to challenge with PCC-pulsed, APCs. As shown in Figure 1A, anergic T cells demonstrated an impaired ability to proliferate in response to antigenic challenge compared to either untreated or stimulated T cells, consistent with our previous findings [19]. In contrast, untreated or stimulated T cells had the ability to respond to increasing concentrations of PCC in a dose-dependent manner. When each group was cultured with IL-2 instead of PCC-pulsed APCs (Figure 1B), all groups responded equally, demonstrating that the failure of the anergized cells to respond to antigen is not due to cell death, consistent with previous reports [26].
Figure 1. Proliferation of untreated, stimulated, and anergic A.E7 CD4+ T lymphocytes.
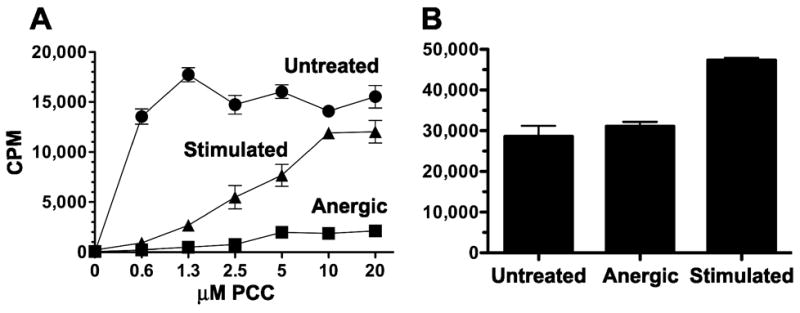
A) Proliferative response of A.E7 T cells challenged with PCC-pulsed syngeneic splenocytes. Cells were left untreated (circles), treated with immobilized anti-CD3 monoclonal antibody (Anergic, squares), or treated with anti-CD3 plus anti-CD28 monoclonal antibodies (Stimulated, triangles) for 12 hours. Five days later they were challenged with PCC-pulsed, syngeneic splenocytes and assayed for proliferation as described in Materials and Methods. B) Untreated, Anergic, and Stimulated populations of T cells described Panel A were cultured with 15 units of exogenous IL-2/ml instead of PCC-pulsed APCs. Data from both panels are representative of at least three independent experiments. Data are expressed as the mean [3H]-thymidine incorporation ± SEM (N=3).
3.2 PD-1 mRNA and protein levels are increased in anergic cells
We previously employed Affymetrix GeneChip technology to identify genes differentially expressed in anergic A.E7 CD4 T cells [19]. These studies determined that Egr-2 is required for anergy induction in A.E7 T cells but is not required for anergy maintenance. Because Egr-2 and other anergy genes have been implicated in the induction phase of anergy, we sought to utilize our database to identify genes responsible for anergy maintenance. We identified Programmed Death-1 (PD-1) as having an expression profile that is consistent with maintenance of the anergic state. To confirm our Affymetrix data, total RNA from previously untreated, fully stimulated, or anergic A.E7 T cell populations was isolated and PD-1 message was amplified by quantitative, real-time RT-PCR. As shown in Figure 2A, the level of PD-1 message was higher in anergic cells than in previously untreated or costimulated populations at the day 5 time point. To determine if this increase in mRNA expression resulted in increased protein expression, PD-1 protein levels was assessed from lysates of untreated, anergic, or stimulated A.E7 T cells. Figure 2B shows that PD-1 protein level was also higher in the anergic populations than in untreated or costimulated populations.
Figure 2. Anergic A.E7 T cells express high levels of PD-1 message and protein.

A.E7 T cells populations were left untreated, stimulated, or anergized, and then cultured for five days. A) Total RNA was analyzed by quantitative RT-PCR for PD-1 and HPRT expression. Data are expressed as the mean ± SD of three separate reactions. B) Cell lysates were assayed by Western analysis for PD-1 and actin proteins. Data are representative of at least three experiments.
3.3 PD-1 siRNA restores antigenic responsiveness in anergic T cells
To determine the extent to which PD-1 contributes to the anergic phenotype in this model, subpopulations of anergic cells were transfected with an siRNA SMARTPool designed to silence PD-1. The cells were transfected five days after anergy induction and challenged with antigen two days later to assess their responsiveness. The anergic cells in which PD-1 message was targeted demonstrated complete restoration of antigenic responsiveness (Figure 3). To establish continuity with our previous studies [19], we also examined the effect of Egr-2 depletion in these cells, and confirmed that targeting Egr-2 at late time points does not restore the antigenic responsiveness of anergic cells (Figure 3).
Figure 3. Antigenic responsiveness is restored in anergic A.E7 T cells transfected with siRNA against PD-1.

A.E7 T cells were anergized for 12 hours followed by five days of rest as described in Materials and Methods. The cells were then transfected with siRNA SMARTPools (open squares) targeting the gene transcripts indicated on each panel. Anergic cells transfected with a non-specific siRNA duplex (closed squares). Non-transfected, fully stimulated non-anergized populations of A.E7 T cells (triangles) were used as controls and are shown in each panel for comparison. The cells were allowed to recover for two days in growth media, and then challenged with PCC-pulsed, syngeneic splenocytes. Data are expressed as the mean [3H]-thymidine incorporation ± SEM (N=3). Results shown are from a single experiment and are representative of at least three experiments.
3.4 siRNA directed against PD-1 increases antigenic responsiveness in anergic A.E7 T cells, but not in untreated or fully stimulated populations
PD-1 engagement has previously been shown to negatively regulate recently stimulated T cells [27]. Having determined that PD-1 protein levels are increased in anergic A.E7 T cells, we next sought to determine whether the increased proliferation observed after silencing of PD-1 is specific to anergic T cell populations. To do this, we transfected previously untreated, anergized, or fully stimulated A.E7 T cells with PD-1-specific siRNA and challenged these populations two days after transfection to assess their antigenic responsiveness. We found that anergic A.E7 T cells challenged with PCC proliferated vigorously following PD-1 siRNA treatment. In contrast, previously untreated A.E7 T cells and fully stimulated T cells showed no increase in their proliferative response (Figure 4A), even though PD-1 protein levels were reduced in all three cell populations (Figure 4B). These data show that, in this model system, only the proliferation of anergic T cells is negatively regulated by PD-1.
Figure 4. The effectiveness of PD-1 RNAi is specific to anergic populations of A.E7 T cells.

A) A.E7 T cells were anergized (open squares), stimulated (closed triangles), or left untreated (closed circles) followed by 5 days of culture. The cells were then transfected with PD-1 siRNA or control scrambled siRNA (SCR). The cells were allowed to recover for two days in growth media and then challenged with PCC-pulsed, syngeneic splenocytes. Antigenic responsiveness is represented as the ratio of [3H]-thymidine incorporation in PD-1 siRNA-transfected cells divided by that same population of cells treated with control siRNA. Data are representative of at least three experiments. B) The same populations were assayed by Western analysis for PD-1 and actin proteins.
3.5 PD-1 depletion restores anergic cell responsiveness in an IL-2 dependent fashion
The primary growth cytokine for Th1 CD4+ T cells is IL-2. It has been shown that engagement of PD-1 by its receptor, PD-L2, inhibits IL-2 production by naïve human T cells stimulated with anti-CD3 [28]. To determine if PD-1 siRNA restores the responsiveness of anergic cells by allowing them to produce IL-2, we transfected anergized cells with PD-1 siRNA and then challenged them with PCC in the presence of a neutralizing anti-IL-2 antibody or an isotype control antibody. As shown in Figure 5, neutralizing IL-2 activity completely abrogates the effect of PD-1 siRNA silencing. In contrast, cells incubated with an isotype control immunoglobulin proliferated to a degree comparable to that observed in the fully stimulated positive control cells.
Figure 5. Proliferation of PD-1-depleted anergic cells is dependent on IL-2.

A.E7 T cells were anergized as described and 5 days later treated with PD-1 siRNA. The cells were allowed to recover for two days in growth media and then challenged with PCC-pulsed splenocytes in the presence of neutralizing IL-2 antibody (closed squares) or IgG2a isotype control antibody (open squares). Fully stimulated cells (closed triangles) were not treated with either siRNA or antibody. Data are expressed as the mean [3H]-thymidine incorporation ± SEM (N=3). Data are representative of at least three experiments.
4. Discussion
The role of PD-1 as a negative costimulatory molecule is currently the focus of numerous studies whose goal is to further describe the mechanisms of immune tolerance [29]. We have demonstrated that PD-1 expression is increased after anergy induction in A.E7 CD4+ T cells, in agreement with data previously described from in vivo models. In the A.E7 model, PD-1 expression remains high for at least five to seven days, during the period at which the cells are hyporesponsive to restimulation with antigen. In contrast, fully stimulated A.E7 T cells that initially received both signal 1 and signal 2 downregulate PD-1 levels by this time point, and proliferate in response to antigen. We have further demonstrated complete dependence of the anergic phenotype on PD-1, as depletion of PD-1 with siRNA duplexes at late times results in a total reversal of anergy. The same treatment had no effect on fully activated A.E7 T cells, suggesting that in the A.E7 model this optimally stimulated population is not susceptible to negative regulation by this pathway. This is likely explained by the fact that, prior to restimulation, expression levels of PD-1 mRNA and protein are at or below even the background levels seen in control unstimulated cells (Figure 2) and that due to this low expression, they exhibit maximal proliferation that cannot be further enhanced.
A hallmark of anergic T cells is a block in the signal transduction pathway responsible for IL-2 upregulation [17], and previous studies have demonstrated a relationship between PD-1 engagement and decreased IL-2 production [30]. To determine the effect of PD-1 depletion on IL-2 signaling in the A.E7 model, we included a neutralizing IL-2 monoclonal antibody in the anergic cultures stimulated with PCC. We found that, neutralization of IL-2 completely abrogates the restored responsiveness of PD-1 depletion. This result suggests that the decreased IL-2 production seen in the context of PD-1 engagement is intrinsic to the anergic cell population itself, rather than being the extrinsic effect of conditions of the lymphatic microenvironment or other factors. The precise mechanisms by which PD-1 inhibits IL-2 production are still being elucidated, but studies to date indicate that they clearly involve the recruitment of the phosphatases SHP-1 and SHP-2 [28,31] and the inhibition of PI3K activation and subsequent phosphorylation of Akt [28,32].
The role of PD-1 in T cell signalling is currently the subject of intense scrutiny. Studies have shown that PD-1 is capable of delivering both a costimulatory signal and an inhibitory signal [27, 30, 33], depending on the signaling context. PD-1 has also been found to be an integral part of the signaling repertoires of B cells, CD4+ T cells, and CD8+ T cells [30, 34, 35]. The specific mechanisms by which PD-1 contributes to the anergic phenotype have yet to be fully described [25, 36–39], and we propose that the A.E7 anergy model serves as a useful tool to investigate this relationship. A recent review discusses the numerous models in which the relationship between T cell anergy and PD-1 have been demonstrated, and remarks that there have been no in vitro models that have recapitulated the data [29]. We show that the A.E7 T cell model recapitulates data previously reported from various in vivo models, and thus is a precise and versatile tool for more detailed investigation of the role of PD-1 in T cell anergy.
Acknowledgments
The authors thank Mary Lively for technical assistance with quantitative RT-PCR and Juerg Straubhaar for Affymetrix GeneChip data analysis.
Footnotes
Publisher's Disclaimer: This is a PDF file of an unedited manuscript that has been accepted for publication. As a service to our customers we are providing this early version of the manuscript. The manuscript will undergo copyediting, typesetting, and review of the resulting proof before it is published in its final citable form. Please note that during the production process errors may be discovered which could affect the content, and all legal disclaimers that apply to the journal pertain.
References
- 1.Akl A, Luo S, Wood KJ. Induction of transplantation tolerance-the potential of regulatory T cells. Transplantation Immunology. 2005;14:225–30. doi: 10.1016/j.trim.2005.03.011. [DOI] [PubMed] [Google Scholar]
- 2.Larsen JL. Pancreas transplantation: indications and consequences. Endocrine Reviews. 2004;25:919–46. doi: 10.1210/er.2002-0036. [DOI] [PubMed] [Google Scholar]
- 3.Rossini AA, Mordes JP, Greiner DL, Stoff JS. Islet cell transplantation tolerance. Transplantation. 2001;72:S43–6. [PubMed] [Google Scholar]
- 4.Rossini AA, Greiner DL, Mordes JP. Induction of immunologic tolerance for transplantation. Physiological Reviews. 1999;79:99–141. doi: 10.1152/physrev.1999.79.1.99. [DOI] [PubMed] [Google Scholar]
- 5.Sakaguchi S, Sakaguchi N, Shimizu J, Yamazaki S, Sakihama T, Itoh M, Kuniyasu Y, Nomura T, Toda M, Takahashi T. Immunologic tolerance maintained by CD25+ CD4+ regulatory T cells: their common role in controlling autoimmunity, tumor immunity, and transplantation tolerance. Immunological Reviews. 2001;182:18–32. doi: 10.1034/j.1600-065x.2001.1820102.x. [DOI] [PubMed] [Google Scholar]
- 6.Wekerle T, Kurtz J, Bigenzahn S, Takeuchi Y, Sykes M. Mechanisms of transplant tolerance induction using costimulatory blockade. Current Opinion in Immunology. 2002;14:592–600. doi: 10.1016/s0952-7915(02)00378-3. [DOI] [PubMed] [Google Scholar]
- 7.Quezada SA, Jarvinen LZ, Lind EF, Noelle RJ. CD40/CD154 interactions at the interface of tolerance and immunity. Annual Review of Immunology. 2004;22:307–28. doi: 10.1146/annurev.immunol.22.012703.104533. [DOI] [PubMed] [Google Scholar]
- 8.Allison AC, Eugui EM. Mechanisms of action of mycophenolate mofetil in preventing acute and chronic allograft rejection. Transplantation. 2005;80:S181–90. doi: 10.1097/01.tp.0000186390.10150.66. [DOI] [PubMed] [Google Scholar]
- 9.Li X. The common gammac-cytokines and transplantation tolerance. Cellular & Molecular Immunology. 2004;1:167–72. [PubMed] [Google Scholar]
- 10.Clarkson MR, Sayegh MH. T-cell costimulatory pathways in allograft rejection and tolerance. Transplantation. 2005;80:555–63. doi: 10.1097/01.tp.0000168432.60022.99. [DOI] [PubMed] [Google Scholar]
- 11.Wood KJ. Is B cell tolerance essential for transplantation tolerance? Transplantation. 2005;79:S40–2. doi: 10.1097/01.tp.0000153300.22231.a1. [DOI] [PubMed] [Google Scholar]
- 12.Zelenika D, Adams E, Humm S, Lin CY, Waldmann H, Cobbold SP. The role of CD4+ T-cell subsets in determining transplantation rejection or tolerance. Immunological Reviews. 2001;182:164–79. doi: 10.1034/j.1600-065x.2001.1820113.x. [DOI] [PubMed] [Google Scholar]
- 13.Charlton B, Auchincloss H, Jr, Fathman CG. Mechanisms of transplantation tolerance. Annual Review of Immunology. 1994;12:707–34. doi: 10.1146/annurev.iy.12.040194.003423. [DOI] [PubMed] [Google Scholar]
- 14.Walker LS, Abbas AK. The enemy within: keeping self-reactive T cells at bay in the periphery. Nature Reviews Immunology. 2002;2:11–9. doi: 10.1038/nri701. [DOI] [PubMed] [Google Scholar]
- 15.Bretscher P, Cohn M. A theory of self-nonself discrimination. Science. 1970;169:1042–9. doi: 10.1126/science.169.3950.1042. [DOI] [PubMed] [Google Scholar]
- 16.Schwartz RH. Costimulation of T lymphocytes: the role of CD28, CTLA-4, and B7/BB1 in interleukin-2 production and immunotherapy. Cell. 1992;71:1065–8. doi: 10.1016/s0092-8674(05)80055-8. [DOI] [PubMed] [Google Scholar]
- 17.Schwartz RH. T Cell Anergy. Annual Review of Immunology. 2003;21:305–334. doi: 10.1146/annurev.immunol.21.120601.141110. [DOI] [PubMed] [Google Scholar]
- 18.Powell JD, Lerner CG, Schwartz RH. Inhibition of cell cycle progression by rapamycin induces T cell clonal anergy even in the presence of costimulation. Journal of Immunology. 1999;162:2775–84. [PubMed] [Google Scholar]
- 19.Harris JE, Bishop KD, Phillips NE, Mordes JP, Greiner DL, Rossini AA, Czech MP. Early Growth Response Gene-2, a Zinc-Finger Transcription Factor, Is Required for Full Induction of Clonal Anergy in CD4+ T Cells. Journal of Immunology. 2004;173:7331–7338. doi: 10.4049/jimmunol.173.12.7331. [DOI] [PubMed] [Google Scholar]
- 20.Safford M, Collins S, Lutz MA, Allen A, Huang CT, Kowalski J, Blackford A, Horton MR, Drake C, Schwartz RH, Powell JD. Egr-2 and Egr-3 are negative regulators of T cell activation. Nature Immunology. 2005;6:472–480. doi: 10.1038/ni1193. [DOI] [PubMed] [Google Scholar]
- 21.Heissmeyer V, Macian F, Im SH, Varma R, Feske S, Venuprasad K, Gu H, Liu YC, Dustin ML, Rao A. Calcineurin imposes T cell unresponsiveness through targeted proteolysis of signaling proteins. Nature Immunology. 2004;5:255–65. doi: 10.1038/ni1047. [DOI] [PubMed] [Google Scholar]
- 22.Jeon MS, Atfield A, Venuprasad K, Krawczyk C, Sarao R, Elly C, Yang C, Arya S, Bachmaier K, Su L, Bouchard D, Jones R, Gronski M, Ohashi P, Wada T, Bloom D, Fathman CG, Liu YC, Penninger JM. Essential role of the E3 ubiquitin ligase Cbl-b in T cell anergy induction. Immunity. 2004;21:167–77. doi: 10.1016/j.immuni.2004.07.013. [DOI] [PubMed] [Google Scholar]
- 23.Anandasabapathy N, Ford GS, Bloom D, Holness C, Paragas V, Seroogy C, Skrenta H, Hollenhorst M, Fathman CG, Soares L. GRAIL: an E3 ubiquitin ligase that inhibits cytokine gene transcription is expressed in anergic CD4+ T cells. Immunity. 2003;18:535–47. doi: 10.1016/s1074-7613(03)00084-0. [DOI] [PubMed] [Google Scholar]
- 24.Seroogy CM, Soares L, Ranheim EA, Su L, Holness C, Bloom D, Fathman CG. The Gene Related to Anergy in Lymphocytes, an E3 Ubiquitin Ligase, Is Necessary for Anergy Induction in CD4 T Cells. Journal of Immunology. 2004;173:79–85. doi: 10.4049/jimmunol.173.1.79. [DOI] [PubMed] [Google Scholar]
- 25.Keir ME, Butte MJ, Freeman GJ, Sharpe AH. PD-1 and Its Ligands in Tolerance and Immunity. Annual Review of Immunology. 2008;26:677–704. doi: 10.1146/annurev.immunol.26.021607.090331. [DOI] [PMC free article] [PubMed] [Google Scholar]
- 26.Jenkins MK, Chen CA, Jung G, Mueller DL, Schwartz RH. Inhibition of antigen-specific proliferation of type 1 murine T cell clones after stimulation with immobilized anti-CD3 monoclonal antibody. Journal of Immunology. 1990;144:16–22. [PubMed] [Google Scholar]
- 27.Freeman GJ, Long AJ, Iwai Y, Bourque K, Chernova T, Nishimura H, Fitz LJ, Malenkovich N, Okazaki T, Byrne MC, Horton HF, Fouser L, Carter L, Ling V, Bowman MR, Carreno BM, Collins M, Wood CR, Honjo T. Engagement of the PD-1 Immunoinhibitory Receptor by a Novel B7 Family Member Leads to Negative Regulation of Lymphocyte Activation. Journal of Experimental Medicine. 2000;192:1027–1034. doi: 10.1084/jem.192.7.1027. [DOI] [PMC free article] [PubMed] [Google Scholar]
- 28.Saunders PA, Hendrycks VR, Lidinsky WA, Woods ML. PD-L2:PD-1 involvement in T cell proliferation, cytokine production, and integrin-mediated adhesion. European Journal of Immunology. 2005;35:3561–9. doi: 10.1002/eji.200526347. [DOI] [PubMed] [Google Scholar]
- 29.Fife BT, Bluestone JA. Control of peripheral T-cell tolerance and autoimmunity via the CTLA-4 and PD-1 pathways. Immunological Reviews. 2008;224:166–182. doi: 10.1111/j.1600-065X.2008.00662.x. [DOI] [PubMed] [Google Scholar]
- 30.Carter L, Fouser LA, Jussif J, Fitz L, Deng B, Wood CR, Collins M, Honjo T, Freeman GJ, Carreno BM. PD-1:PD-L inhibitory pathway affects both CD4(+) and CD8(+) T cells and is overcome by IL-2. European Journal of Immunology. 2002;32:634–43. doi: 10.1002/1521-4141(200203)32:3<634::AID-IMMU634>3.0.CO;2-9. [DOI] [PubMed] [Google Scholar]
- 31.Chemnitz JM, Parry RV, Nichols KE, June CH, Riley JL. SHP-1 and SHP-2 Associate with Immunoreceptor Tyrosine-Based Switch Motif of Programmed Death 1 upon Primary Human T Cell Stimulation, but Only Receptor Ligation Prevents T Cell Activation. Journal of Immunology. 2004;173:945–954. doi: 10.4049/jimmunol.173.2.945. [DOI] [PubMed] [Google Scholar]
- 32.Parry RV, Chemnitz JM, Frauwirth KA, Lanfranco AR, Braunstein I, Kobayashi SV, Linsley PS, Thompson CB, Riley JL. CTLA-4 and PD-1 Receptors Inhibit T-Cell Activation by Distinct Mechanisms. Molecular and Cellular Biology. 2005;25:9543–9553. doi: 10.1128/MCB.25.21.9543-9553.2005. [DOI] [PMC free article] [PubMed] [Google Scholar]
- 33.del Rio ML, Penuelas-Rivas G, Dominguez-Perles R, Ramirez P, Parrilla P, Rodriguez-Barbosa JI. Antibody-mediated signaling through PD-1 costimulates T cells and enhances CD28-dependent proliferation. European Journal of Immunology. 2005;35:3545–60. doi: 10.1002/eji.200535232. [DOI] [PubMed] [Google Scholar]
- 34.Probst HC, McCoy K, Okazaki T, Honjo T, van den Broek M. Resting dendritic cells induce peripheral CD8+ T cell tolerance through PD-1 and CTLA-4. Nature Immunology. 2005;6:280–6. doi: 10.1038/ni1165. [DOI] [PubMed] [Google Scholar]
- 35.Nishimura H, Minato N, Nakano T, Honjo T. Immunological studies on PD-1 deficient mice: implication of PD-1 as a negative regulator for B cell responses. International Immunology. 1998;10:1563–72. doi: 10.1093/intimm/10.10.1563. [DOI] [PubMed] [Google Scholar]
- 36.Smith P, Walsh CM, Mangan NE, Fallon RE, Sayers JR, McKenzie ANJ, Fallon PG. Schistosoma mansoni Worms Induce Anergy of T Cells via Selective Up-Regulation of Programmed Death Ligand 1 on Macrophages. Journal of Immunology. 2004;173:1240–1248. doi: 10.4049/jimmunol.173.2.1240. [DOI] [PubMed] [Google Scholar]
- 37.Hatachi S, Iwai Y, Kawano S, Morinobu S, Kobayashi M, Koshiba M, Saura R, Kurosaka M, Honjo T, Kumagai S. CD4+ PD-1+ T cells accumulate as unique anergic cells in rheumatoid arthritis synovial fluid. Journal of Rheumatology. 2003;30:1410–9. [PubMed] [Google Scholar]
- 38.Park HB, Paik DJ, Jang E, Hong S, Youn J. Acquisition of anergic and suppressive activities in transforming growth factor-beta-costimulated CD4+CD25- T cells. International Immunology. 2004;16:1203–13. doi: 10.1093/intimm/dxh123. [DOI] [PubMed] [Google Scholar]
- 39.Selenko-Gebauer N, Majdic O, Szekeres A, Hofler G, Guthann E, Korthauer U, Zlabinger G, Steinberger P, Pickl WF, Stockinger H, Knapp W, Stockl J. B7-H1 (Programmed Death-1 Ligand) on Dendritic Cells Is Involved in the Induction and Maintenance of T Cell Anergy. Journal of Immunology. 2003;170:3637–3644. doi: 10.4049/jimmunol.170.7.3637. [DOI] [PubMed] [Google Scholar]