Abstract
To quantitatively predict the mechanical response and mechanically induced remodeling of red blood cells, we developed a multiscale method to correlate distributions of internal stress with overall cell deformation. This method consists of three models at different length scales: in the complete cell level the membrane is modeled as two distinct layers of continuum shells using finite element method (Level III), in which the skeleton-bilayer interactions are depicted as a slide in the lateral (i.e. in-plane) direction (caused by the mobility of the skeleton-bilayer pinning points) and a normal contact force; the constitutive laws of the inner layer (the protein skeleton) are obtained from a molecular-based model (Level II); the mechanical properties of the spectrin (Sp, a key component of the skeleton), including its folding/unfolding reactions, are obtained with a stress-strain model (Level I). Model verification is achieved through comparisons with existing numerical and experimental studies in terms of the resting shape of the cell as well as cell deformations induced by micropipettes and optical tweezers. Detailed distributions of the interaction force between the lipid bilayer and the skeleton that may cause their dissociation and lead to phenomena such as vesiculation are predicted. Specifically, our model predicts correlation between the occurrence of Sp unfolding and increase in the mechanical load upon individual skeleton-bilayer pinning points. Finally a simulation of the necking process after skeleton-bilayer dissociation, a precursor of vesiculation, is conducted.
1 INTRODUCTION
Among all types of cells, erythrocyte (red blood cell, or RBC) possesses one of the simplest and best characterized molecular architectures. Without a nucleus, a mature erythrocyte contains a cytosol enclosed within a highly flexible yet surprisingly strong membrane. Essential to its structural integrity and stability is this composite membrane consisting of a lipid bilayer supported from inside by a protein skeleton. The connection between the skeleton and the lipid bilayer is achieved at pinning points made of transmembrane proteins.
Despite extensive investigations in the past few decades, there are still many remaining questions about the mechanics of erythrocyte. For example, it is still not fully understood what determines its resting shape (this is the first of eight mysteries about RBC proposed by Hoffman [1]). Herein a pivotal issue is the effect of the protein skeleton upon cell shape. Although a stomatocyte-discocyte-echinocyte sequence was obtained numerically based on the bilayer-coupled hypothesis [2] and the stabilizing function of the skeleton in maintaining the biconcave shape was explored [3], the relaxed reference shape of the skeleton remains controversial. Indeed, if a spherically relaxed skeleton is applied, to obtain the biconcave shape the elasticity of the skeleton must be significantly reduced [4]. Otherwise, nonspherical (e.g. biconcave [5] or oblate [2, 3]) relaxed shapes must be assumed. These are beyond the state-of-the-art knowledge about RBC. Moreover, much is unknown about responses of the cell in large deformations. One remaining issue is the strength of the skeleton-bilayer linkage [6]. Under sufficiently large dissociation forces this linkage may rupture, causing cell remodelings such as vesiculation. The recent understanding is based upon the adhesion energy theory [7]. Being essentially phenomenological, this theory does not offer much insight upon the molecular origin of the lipid-skeleton dissociation. In large deformations, the effects of Sp unfolding [8] and dissociation of Sp head-to-head connections [9] upon the mechanical behavior of the cell are also unexplored.
These problems are important not only because RBC serves as a model system for general cell biomechanics, but also because many diseases are related to defects of the inter-protein and protein-to-lipid linkages in the cell membrane [10]. Some of these defects will change the mechanical properties of the cell and its resting shape. Others may induce structural failures of the cell under large loading. For example, in hereditary elliptocytosis (HE), the weakening of the skeleton network reshapes the cell to be elliptical. Cells with abnormal shapes are often destroyed by the spleen, leading to anemia. Mechanically induced cell damage is more pronounced within artificially created flow fields associated with mechanical circulatory support systems [11].
To pave the way for a molecular-level understanding of mechanical responses of erythrocytes as well as the underlying conditions for mechanically triggered structural remodeling and failure, it is vital to quantitatively characterize the mechanical forces acting on the interprotein and protein-to-lipid linkages within the membrane. Toward this end there is also the need to describe the process whereby the protein skeleton, while vertically connected to the lipid bilayer, alters its lateral morphology and density as it deforms. Thus the coupled phenomena of skeletal rearrangements during deformations and skeleton-bilayer interaction are of first order importance to overall mechanical response as well as remodeling processes such as vesiculation, which involves a separation of the skeleton from the bilayer, and related protein sorting events.
In this study we explore a finite element method (FEM) to simulate the membrane as two distinct layers. Although energy minimization methods have been successfully used in membrane mechanics [2, 4, 12], FEM is still a good candidate with many advantages, e.g. the robustness for contact/adhesion calculation and time-dependent problems, the high computational efficiency, as well as the simplicity in coupling with other methods [5, 13, 14]. Unlike the coarse-grained models [4, 12], in our model we explicitly compute the interaction between the bilayer and the skeleton. Since we aim at molecular-detailed prediction of force distribution within the cell with maximum accuracy at large deformations, we use a multiscale representation that accounts for a molecular-level understanding of the Sp/actin junctional complex (JC) in the protein skeleton and the force-induced Sp unfolding. A specific aim of this study is to evaluate the normal association or dissociation force between the lipid bilayer and the protein skeleton – a sufficiently large dissociation force may trigger phenomena such as vesiculation and tether formation (in both cases segregation of the skeleton from the bilayer is observed) [6, 15, 16, 17, 18].
This paper is organized as follows. In the next section we summarize the development of a set of multiscale models, including a constitutive model of the Sp, a molecular-detailed model of the protein skeleton, and a double-layer FEM model of the complete cell. This set of models is then applied to predict the resting shape and simulate two experiments, micropipette aspiration and cell stretching with optical tweezers. In these studies, we not only compare our predictions with benchmark results, but also document the contact force between the bilayer and the skeleton as well as the post-dissociation behavior. Finally, conclusions and discussion are provided.
2 PROBLEM DESCRIPTION
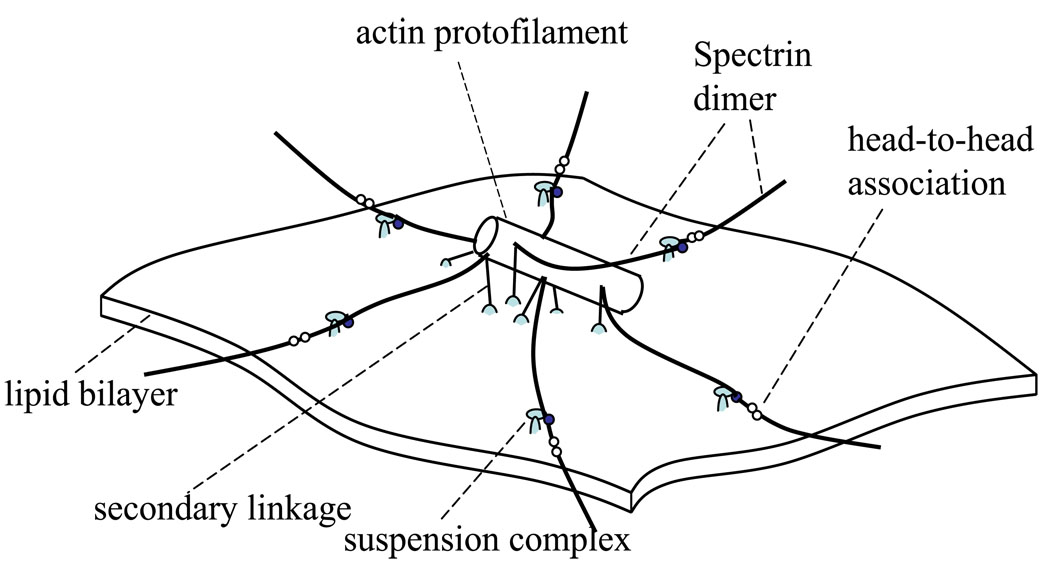
An erythrocyte possesses a thin skeletal network coupled with a lipid bilayer. The network is composed primarily of flexible Sp dimers and relatively rigid actin protofilaments, and structurally organized into approximately 33,000 JCs. As shown in Fig. 1, each JC contains a central piece of actin protofilament as well as (up to) six Sp dimers. Horizontally, the JCs are linked via the Sp dimer/tetramer reaction (i.e. the head-to-head association that connects two dimers into a tetramer). Vertically, this membrane skeleton is connected to the lipid bilayer at pinning points called suspension complexes (SC). Each SC consists of ankyrin, protein 4.2, and band 3 (a transmembrane protein). In addition, the actin protofilaments are also connected to the lipid bilayer through protein 4.1 and glycophorin C (another transmembrane protein). This linkage is usually referred to as the secondary connection. Both band 3 and glycophorin C can drift within the lipid bilayer, rendering a horizontal mobility of the skeleton-bilayer connection.
Figure 1.
Schematic of a JC.
Inter- and intra-protein reactions are essential to the structural integrity and mechanical response of the cell [19]. In the erythrocyte membrane there exists a dynamic equilibrium as a result of dynamic balances between associated and dissociated states of many inter-protein and protein-to-lipid linkages. These balances are directly affected by mechanical loads. The connections that may rupture under mechanical loads include: the head-to-head association between Sp dimers that links the neighboring JCs [20, 21], the band 3–ankyrin “bridge” that is the connection between the SC and the lipid bilayer [22], the protein 4.1–band 3 connection [23], and the band 3–lipid bilayer connection [18]. These dissociations will dramatically change the mechanical properties of the membrane, causing structural instability and even permanent damage. For example, as suggested by micropipette aspirations and flow channel experiments, the rupture of the band 3–lipid linkage will cause detachment of the skeleton from the lipid bilayer, leading to creation of vesicles (vesiculation) or tethers [16, 18]. Vesiculation is associated with membrane loss, and usually with changes in the shape and physiology of the cell. To understand conditions related with these cell remodelings, numerical models are required to correlate cell deformations to the mechanical loads on these connections.
3 Multiscale formulations
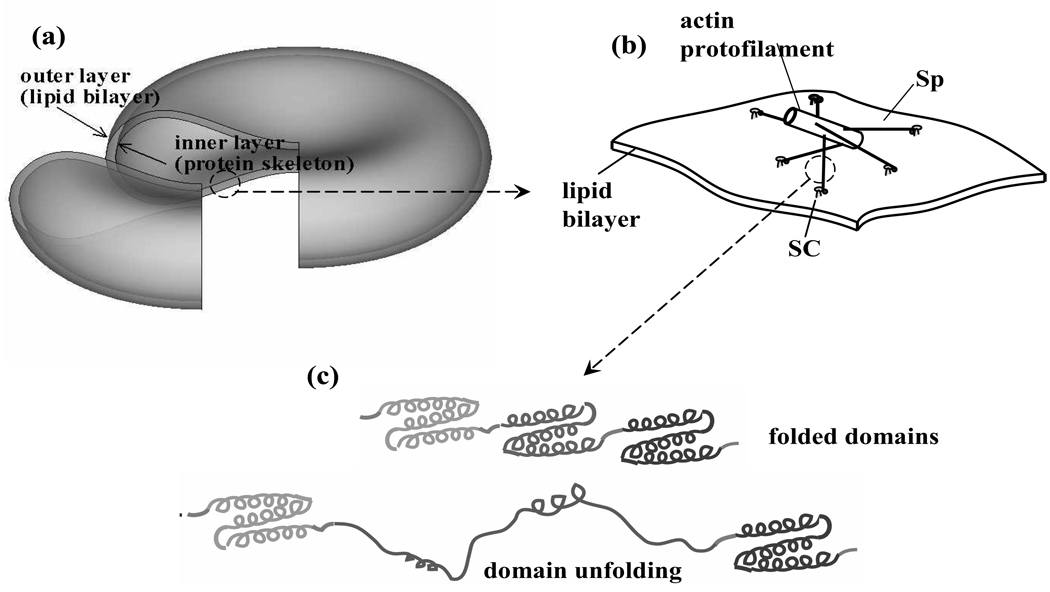
A multiscale model is illustrated in Fig. 2. At the complete cell level (Level III) (Fig. 2a), the membrane is modeled as two vertically connected layers (vertical to the mean plane of the membrane), the lipid bilayer and the protein skeleton. Both layers are modeled as continuum shells. The constitutive properties of the inner layer (the protein skeleton) are evaluated by using a molecular-detailed model of a JC (Level II). As depicted in Fig. 2b, in this JC description the skeleton is composed of a quasi-hexagonal network of roughly 6 Sp dimers (the “spokes”) joined to an actin protofilament. Furthermore, we apply a constitutive model (Level I) to calculate the tension-strain relation of each Sp including its folding/unfolding reactions (Fig. 2c).
Figure 2.
Multiscale models of an erythrocyte: (a) the double-layer continuum shell model (Level III), (b) the molecular-detailed JC model (Level II. For clarity, the secondary connections with glycophrin C/protein 4.1 are not shown), and (c) the constitutive model of a Sp including the folding/unfolding reactions (Level I). (b) and (c) are modified from [8]
In the following we provide detailed descriptions for each of these models.
3.1 Sp model with folding/unfolding reactions (Level I)
Multidomain proteins such as Sp can undergo overstretching due to unfolding of domains or multiple repeats [24, 25, 26, 27, 28] (ref. Fig. 2c). As illustrated in AFM experiments, the transient force-extension curve of Sp displays a trademark sawtooth pattern related to unfolding of the domains [24]. Each peak in this curve corresponds to the unfolding of one or more than one domain [26]. The exact characteristic of this curve is dependent on the rate of extension. With an infinitely slow extension rate, the quasi-static (equilibrium) force-extension curve contains a strain-stiffening part before the first unfolding event. Afterwards, a distinctive plateau appears, where the extension force remains almost a constant due to the successive unfolding of domains.
Based on this description, we have developed a dynamic/quasi-static model of a Sp [8]. In this model, we consider a Sp with N domains stretched by a force F. When there is Nf folded domains and Nu unfolded domains in a Sp (note that N = Nu + Nf), the projected end-to-end distance x (i.e. the end-to-end distance projected to the direction of F) is given as x = Nfxf + Nuxu, where xf and xu are the projected extensions of folded and unfolded domains, respectively. Let ϕu = Nu/N, we have
| (1) |
In the equilibrium state, by considering the balance between the unfolding and the folding processes via an Arrhenius rate relation we express ϕu as
| (2) |
where ΔΔx* = Δxf→u−Δxu→f, the difference between the activation length of the unfolding process and that of the refolding process. F1/2 is the force F corresponding to the state when half of the domains are unfolded. kB is the Boltzmann constant, and T is the temperature (assumed to be 300K in our simulations). With pf and pu as the persistence lengths of each domain in folded and unfolded states, respectively, xf/Lf and xu/Lu can be evaluated via the wormlike-chain (WLC) model.
Using this model,we have quantitatively reproduced the experimentally measured force-extension relation of a Sp [8].
3.2 Junctional complex (JC) model (Level II)
Our model of a JC is based upon the three-dimensional description of a single JC unit by Sung and Vera [29] (also see [30]) and implemented within the mechanical model of Zhu et al. [31] and Zhu and Asaro [8]. According to this depiction (Fig. 1), in a JC the protofilament functions as a mechanical axis, anchoring 3 pairs of Sp. Each Sp pair is arranged in a back-to-back fashion and the force-extension relation comes from previous Sp model (Level I). The result is a quasi-hexagonal network composed of JCs.
The dynamic and quasi-static responses of individual and multiple JCs interacting with the lipid bilayer have been studied via a hybrid scheme that simulated the response to thermal fluctuations and applied displacements or stresses [8, 31].
3.3 Complete cell model (Level III)
In the complete cell model, both the lipid bilayer and the protein skeleton are modeled as continuum shells (Fig. 2a). The elastic properties of the skeleton layer comes from the JC model (Level II).
Following Evans and Skalak [32], we calculate the constitutive properties of a JC undergoing finite deformations based upon the strain energy Φ stored in the Sp. In this approach, an arbitrary in-plane deformation is achieved by stretching along two orthogonal axes, axis 1 and axis 2, with stretching ratios λ1 and λ2 (λ1 ≥ λ2). Two independent deformation parameters, α = λ1λ2 − 1 and are also defined. It is seen that α represents area change, and β a change of aspect ratio or eccentricity. The shear modulus of the skeleton, µs, is then given as
| (3) |
where A0 is the projected area without deformation occupied by the JC (i.e. the area of the hexagon formed by the six SCs). As α is constant, it corresponds to an anisotropic deformation. The potential energy stored inside each Sp dimer is calculated by integrating its internal tension times the extension, starting from the natural state. Φ is then evaluated by summing up the total potential energy in the six dimers.
The isotropic tension T̄ in an equibiaxial deformation (β = constant) can be expressed as (see [32])
| (4) |
where the second term corresponds to a steric effect in the form suggested by [12] (see also [33]), i.e. the compression of the network causes a repulsive force due to interactions among components of the protein skeleton. The initial isotropic tension (prestress) at natural state is denoted by . The linear area modulus Ks is given as
| (5) |
Using the single-JC model we performed simulations of the quasi-static and ensemble-averaged response of a JC in in-plane deformations. Thermal fluctuations, which may have potential impact on local dynamic responses and cause phenomena such as mode switching [31], are not included in this simulation. The shear and linear area moduli of the protein skeleton are extracted by using Eqns. 3 to 5.
The lipid bilayer consists of a nearly incompressible fluid-like membrane. It therefore possesses large area modulus and a quite small shear modulus. For numerical stability we take µb, the shear stiffness of the lipid bilayer, to be a finite value 10−3 µN/m, which is about three orders of magnitude smaller than that of the protein skeleton. The area stiffness of the bilayer is taken to be Kb ≐ 5 × 10⁵ µN/m [19].
The mechanical response of the two continuum layers and their interactions are solved using the finite element method. Detailed description of this method is in the Appendix.
4 Results
In the following sections we apply our model to study problems involving mechanical responses of RBC, including the resting shapes as well as cell deformations and skeleton-bilayer interactions in two canonical tests: optical tweezer stretching and micropipette aspiration.
4.1 Resting shape
It is well accepted that the resting shapes of RBC are related to the mechanical properties of the composite membrane consisting of the lipid bilayer and the skeleton network. However, the roles played by each of these components are unclear. On the one hand, by washing away the lipid bilayer using non-ionic surfactants, Svoboda et al. [34] showed that the remaining protein skeleton was no longer biconcave. On the other hand, in some diseases (e.g. hereditary elliptocytosis) a weakened skeleton network changes the cell to an elliptical shape. The implication is that both the skeleton and the lipid bilayer contribute to the resting shape.
Accordingly, an important factor is the relaxed (zero shear energy) reference state of the protein skeleton. The simplest choice is to use a spherical shape as the reference state. However, it was shown that under this assumption the cell rested at a cup shape [4]. To recover the biconcave shape the elasticity of the skeleton has to be significantly reduced [4]. Although the biconcave shape can be stabilized by using the biconcave shape itself [5] or an oblate ellipsoidal shape [2, 3] as the relaxed skeleton reference, experiments are needed to explain why red cells have those nonspherical relaxed skeletons.
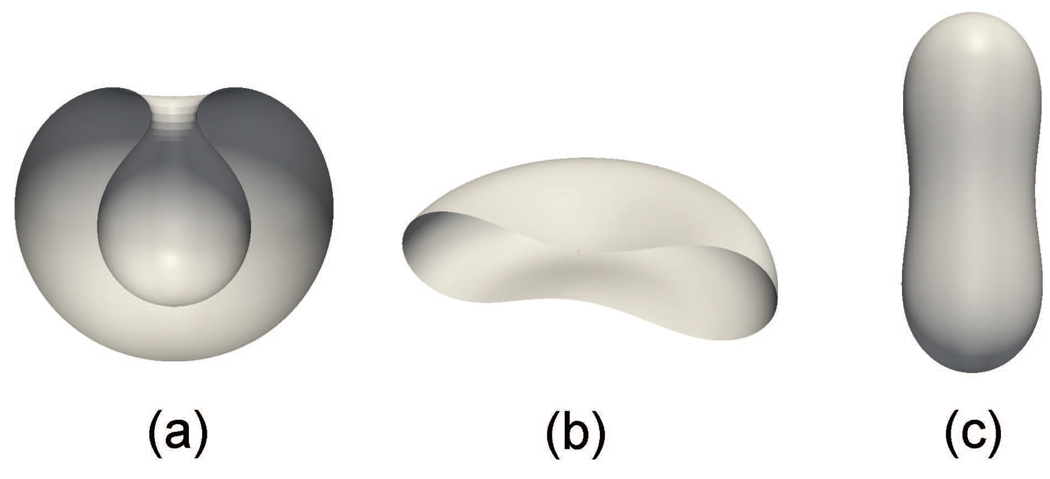
Using our model, we simulate the resting shapes of RBC and compare with predictions made in existing studies. We first neglect the effects of the protein skeleton and study the dependence of the cell shape upon its internal volume V. By assuming that the spontaneous curvature C0 = 0, we plot the cell shapes at three different values of V/Vsphere in Fig. 3 (Vsphere is the volume of a sphere with the same surface area as the cell). It is seen that with our model we can accurately duplicate the stomatocyte-oblate-prolate sequence and its dependence upon V obtained by Seifert et al. [35].
Figure 3.
Resting shapes of a RBC when the lipid bilayer is considered: (a) stomatocyte (V/Vsphere=0.59), (b) oblate (V/Vsphere=0.65) and (c) prolate (V/Vsphere=0.8).
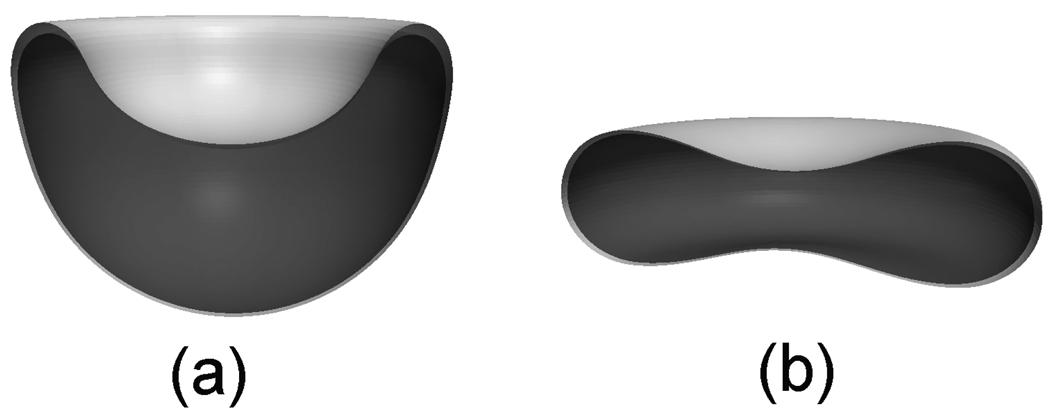
We then take into account the protein skeleton and re-simulate the case with pf=5.625nm, Lf=6.257nm, kc = 8.3×10⁻²⁰J, and C0 = 0. Following Li et al. [4], we start with a spherical shell of radius 3.27 µm (which also serves as the relaxed reference state of the skeleton) and gradually reduce the volume to 65% of its original value. Instead of a biconcave shape, a cup shape is obtained (Fig. 4a). After we reduce the shear stiffness of the skeleton by one hundred times, biconcave shape is recovered. This is consistent with the report by Li et al. [4].
Figure 4.
Resting shapes of the RBC when both the lipid bilayer (light color) and the skeleton network (dark color) are considered: (a) cup shape (c0 = 0, µs = 11 pN/µm, V/Vsphere=0.65), (b) biconcave shape (c0 = 2.6, µs = 0.4 pN/µm, V/Vsphere=0.65). The gap between lipid bilayer and skeleton is exaggerated.
To explain the paradox about the shear stiffness of the skeleton, Li et al. [4] proposed that over large time scales the skeleton might be fluidic due to remodeling and possesses a much smaller shear stiffness than measured under finite deformation rates. This appears to be reasonable. However, it fails to explain why weakened skeleton causes dramatic shape change such as observed in elliptocytosis (at C0 = 0, the biconcave shape is the ground state for µs → 0 at V/Vsphere=0.65 as demonstrated in Fig. 3b).
Alternatively, we find that with some positive spontaneous curvature the biconcave shape can be obtained with a small skeleton shear stiffness. For example, if we assume that the reduced spontaneous curvature c0 = 2.6 (c0 is the reduced spontaneous curvature defined as c0 = C0 · R0 and R0 = 3.27µm is the radius of the initial sphere), the biconcave shape is achieved at a skeleton shear stiffness of 0.4 pN/µm as shown in Fig. 4b. This is consistent with the behavior of elliptocytosis because the lipid bilayer with such a positive spontaneous curvature tends to be prolate if the shear stiffness of skeleton approaches zero due to the weakened skeleton, while the small shear stiffness (0.4 pN/µm) of a normal red cell can be rationalized under the theory by Li et al. [4] (additional evidence can be found in the experimental work of membrane fluctuation by Peterson et al. [36] and the theoretical study by Boal et al. [37], both suggesting that the shear modulus may be considerably smaller than that determined by micropipette experiments (6 ~ 9 pN/µm) [38]).
Complete phase diagram with respect to shear stiffness and spontaneous curvature should be explored further, which is beyond the scope of this paper.
Through comparisons with benchmark results, the aforementioned simulations confirm the validity and accuracy of our models (especially the Level III FEM model). They have also demonstrated that additional studies, both theoretical and experimental, are required to explain the resting shape of RBC.
In the following we concentrate upon mechanically induced deformations of the cell in two canonical experiments, optical tweezer stretching and micropipette aspiration. In these simulations, we consider the bilayer with a spontaneous curvature C0 = 0 for simplicity and use the initial configuration as the relaxed reference state (shear-free state) of the skeleton. Following Discher et al. [12], two different scenarios are considered. In the first scenario the skeleton has no initial tension inside it (stress-free case with T̄0 = 0). In this case pf=5.625 nm, Lf=6.257 nm. In the second scenario the skeleton is prestressed with nonzero T̄0. Here we use pf=11.118 nm, Lf=6.388 nm. Note that all these parameters are from Ref. [12]. Two different levels of prestress are considered, T̄0 = −15 pN/µm (following Ref. [12]) and T̄0 = −30 pN/µm (which provides best comparison with experiments). Unless otherwise specified, for all the following cases we use: N = 19, Lu = 39 nm, pu = 0.8 nm, ΔΔx* = 12.6 nm, and F1/2 = 12 pN.
4.2 Cell stretching by optical tweezer
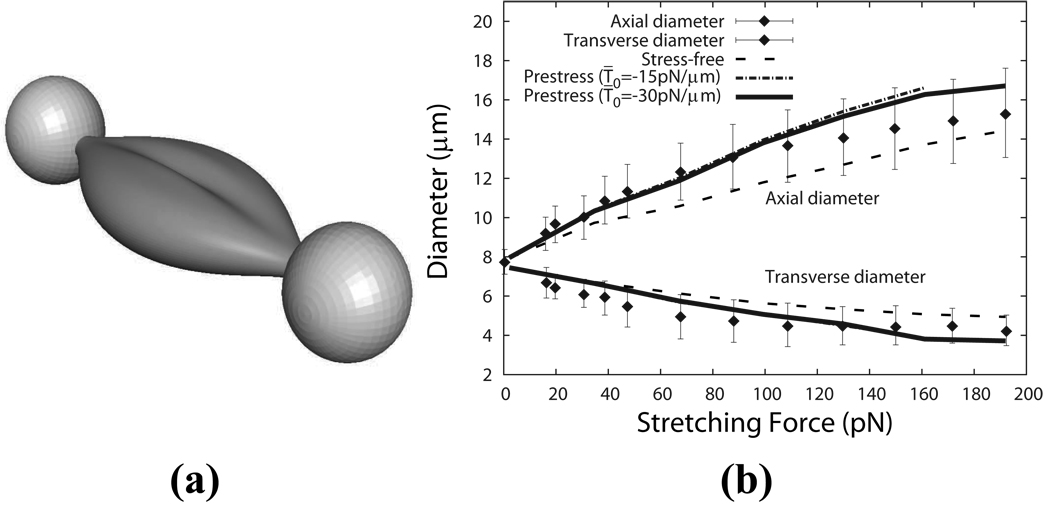
We test the model through comparisons with experimental measurements of RBC deformability through optical tweezers. In this setup, an erythrocyte is stretched by two attached beads, whose motions are optically controlled by laser beams. In our model, the initial shape of the cell is biconcave and is mathematically depicted as [39],
| (6) |
where C1 = 0.21, C2 = 2.03, C3 = −1.12, and R0 = 3.91 µm. (x, y, z) is a Cartesian coordinate system with its origin located at the centroid of the undeformed cell. As reported by Dao et al. [33], the stretching force is applied by two silica beads, which are attached at the opposite ends of the cell over a small oval region with a diameter of 1~2 µm (Fig. 5a). In our simulation, this diameter is chosen to be 1.5 µm.
Figure 5.
(a) Cell deformation stretched by the optical tweezers as predicted by our multiscale model (stress-free case). (b) Axial and transverse diameters of the cell as functions of the stretching force for the stress-free and the prestress cases as compared with experimental results by Dao et al. [33] (the error bars represent experimental uncertainty).
The force versus displacement curve is shown in Fig. 5b. As we see, the model predictions match well with the experimental measurements. The prestress cases are softer than the stress-free case because the persistence length is larger. The case with T̄0 = −30 pN/µm is a little bit stiffer than the case with T̄0 = −15 pN/µm. It also provides best comparison with the experiment among the three cases.
4.3 Micropipette aspirations
4.3.1 Aspiration length vs. pressure
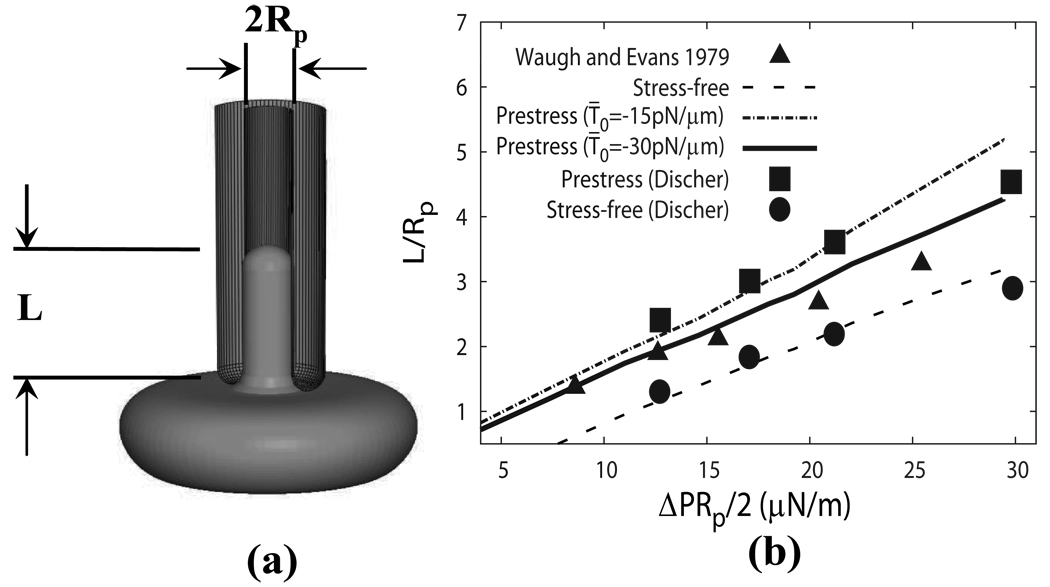
We simulate the canonical micropipette aspirations and obtain the correlation between the applied pressure and the aspiration length L (i.e. the length of the cell sucked into the pipette). In this simulation, a rigid cylindrical surface is employed to represent the pipette. The interaction between the outer layer of the RBC and the pipette is simulated by using a master-slave algorithm similar to the one used to study the bilayer-skeleton interaction (see the Appendix). As indicated in experiments [40], during the aspiration the membrane is usually separated from the pipette by a small gap of fluid so that the friction between them is insignificant and thus not considered in our model. We further simplify the fluid pressure distribution inside the pipette as a uniform pressure difference ΔP applied on the cap region of the lipid bilayer and a linear distribution along the aspiration length (the pressure difference equals zero at the entrance).
Following Waugh and Evans [38], we study a flaccid, unswollen cell aspired from the dimple region (Fig. 6a). The initial shape of the cell is depicted by Eq. (6). The cell is aspirated into a pipette with an inner radius Rp of 0.668 µm.
Figure 6.
(a) Schematic of a micropipette aspiration. (b) The aspiration length as a function of the applied pressure difference ΔP as compared with the experiment [38] and the coarse-grained model[12].
In Fig. 6b, it is seen that the normalized aspiration length L/Rp depends almost linearly on the two-dimensional pressure defined as ΔPRp/2. Also plotted in the figure are the experimental measurements by Waugh and Evans [38] and the results of the coarse-grained model by Discher et al.[12]. Good agreements are achieved with the coarse-grained model. The prestress case with T̄0 = −30 pN/µm provides the best agreement with the experiment.
4.3.2 Skeleton density
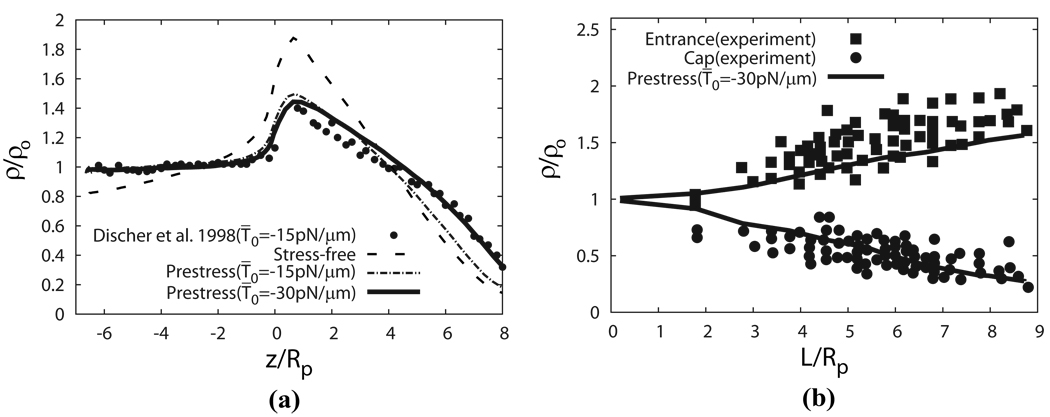
To further test the capacity of our model, we use it to study areal deformation of the skeleton and compare with experimental measurements as well as predictions by the coarse-grained model. The areal variation of the protein skeleton can be denoted as the density ratio ρ/ρ0, i.e. the density of skeleton-attached proteins ρ normalized by its value ρ0 in the undeformed state. This ratio is related to λ1 and λ2 by ρ/ρ0 = 1/(λ1λ2).
In Fig. 7a we plot the density profiles predicted by the current model for stress-free and prestress cases, and compare them with the reported result using the coarse-grained model for prestress case with T̄0 = −15 pN/µm [12]. In Fig. 7b we plot how the skeleton density changes with L/Rp at the cap and the entrance regions predicted by the prestress case with T̄0 = −30 pN/µm, and compare it with experimental data by Discher et al. [41]. To match the setup utilized in [12], in this particular simulation at the initial state the cell is slightly swollen and its initial shape is depicted as a sphere with diameter 5.34 µm, while in all other simulations a flaccid biconcave shape as described in Eq. 6 is used as the initial shape. The radius of the pipette is 0.668 µm. Based upon the tendency demonstrated in Fig. 7, it is clear that our prediction of the density profile is consistent with experimental measurements [41], i.e. the skeleton is expanded near the cap and compressed near the neck.
Figure 7.
(a) The density profile of the protein skeleton as predicted by the FEM model in comparison with the results obtained by using a coarse-grained molecular dynamics model at L = 8Rp [12]. (b) The skeleton density predicted by our model with T̄0 = −30 pN/µm compared with experimental data [41].
Fig. 7a demonstrates that for the same prestress level (T̄0 = −15 pN/µm), the skeleton density of the cap region predicted by our model is lower than that by the coarse-grained model [12]. This is partially attributed to the fact that in the coarse-grained model the deformed shape of the cell is artificially assumed (perfect semi-sphere is assumed for the cap), but in our model the deformed shape is directly computed based on continuum mechanics. Although our computed deformed shape is just slightly different from the assumed shape by Discher et al., additional constraints usually make the structure stiffer. The difference is also due to another fact that at L/Rp = 8 the number of junctional complexes is relatively small in the cap region where the surface is curved so that the difference between our continuum description and the discretized description in the coarse-grained model may be pronounced. Since in reality there are approximately 33,000 JCs in the cell while 18,434 JCs are considered in the coarse-grained model [12], the real density profile should be between our result and that of the coarse-grained model.
Fig. 7a also shows that the prestress level influences the skeleton density significantly. In fact, the accurate prestress level, even the type of the prestress (precompression or pretension), is still controversial [12, 34, 42]. In our following simulations we use T̄0 = −30 pN/µm, which matches the experimental data as shown in Fig. 7b (and also in Figs. 5b and 6b).
As mentioned in the Appendix, in this case the initial shape of the cell is spherical and it is thus impossible to simultaneously conserve area and volume. Indeed, if we assume that the cap area is semi-spherical and the part outside of the pipette remains spherical during aspiration, it can be geometrically proven that when the surface area is conserved the volume loss in this case should be 27% as L = 8Rp, a value consistent with our numerical simulation.
For all simulations below we use the following parameters: pf=11.118 nm, Lf=6.388 nm, and T̄0 = −30 pN/µm. Through numerical simulations we have shown that this set of parameters provides consistently good comparisons with experiments in terms of cell deformations induced by micropipettes and optical tweezers, as well as density variations of the protein skeleton during micropipette aspirations.
4.3.3 Contact force and the effect of Sp unfolding
Hereafter we concentrate upon the vertical contact force between the two layers during the micropipette aspiration of a cell from its biconcave state.
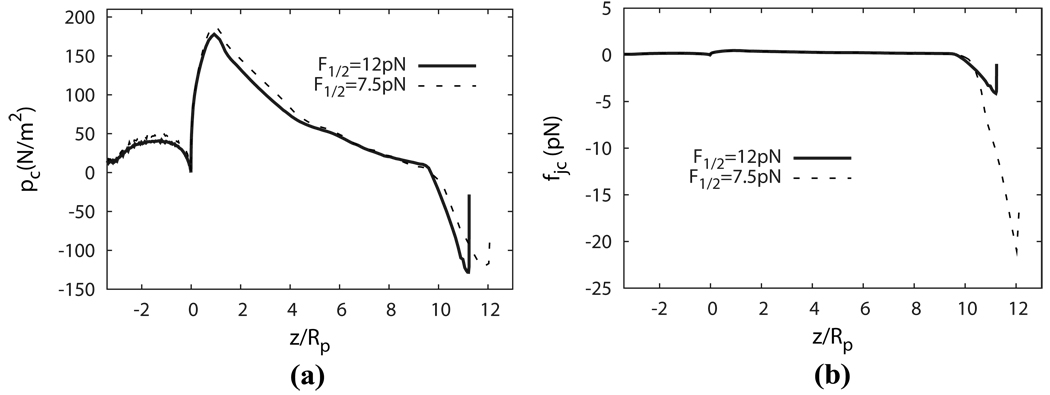
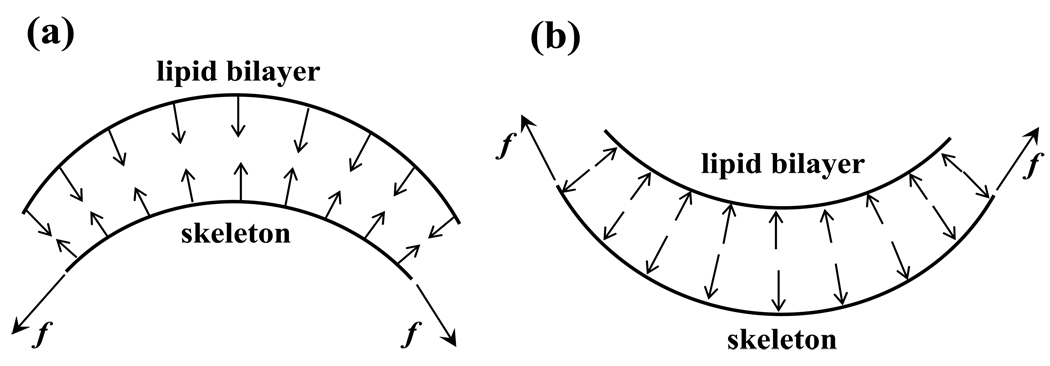
Fig. 8a displays the distributions of the contact pressure pc between the two layers during a micropipette aspiration with an applied pressure of 256 pN/µm2. By definition, a negative contact pressure refers to a scenario in which the two layers are pulled apart (dissociation tendency), and a positive contact force means that the layers are pushed together (adhesion/association tendency). It is seen that positive (association) contact pressure is concentrated close to the entrance, and negative (dissociation) contact pressure exists mostly near the cap. This phenomenon can be explained by considering the local curvature of the inner layer: due to its own internal tension, the protein skeleton is pulled away from the lipid bilayer at places where it has a convex shape (Fig. 9a) and is pulled towards the lipid bilayer at places where it is concave (Fig. 9b).
Figure 8.
(a) Distributions of contact pressure and (b)Distributions of contact force upon a JC.
Figure 9.
To overcome the effect of internal tension f inside the protein skeleton, there must exist (a) negative (disassociation) contact force between the protein skeleton and the lipid bilayer in locations with convex shape, or (b) positive (association) contact force in locations with concave shape.
In our simulation, negative (dissociation) contact pressure with peak value of about −130 pN/µm2 is recorded in the area close to the cap. To relate the contact pressure pc to mechanical loading on the molecular structure of the protein skeleton, it is convenient to define a contact force per JC as fjc = pcA (i.e. the total contact force acting on the area covered by the hexagon formed by the six SCs in a JC). fjc takes into account variations of the density distribution of the pinning points between the protein skeleton and the lipid bilayer. The distribution of fjc along the cell is also plotted in Fig. 8b. It is seen that near the cap the decreased skeleton density amplifies the concentration of dissociation force.
Sp unfolding may play an important role in determining the skeleton density, and subsequently fjc, near the cap region. Unfolding will unstiffen the skeleton, causing larger area expansion and thus increasing fjc even if pc remains unchanged. To understand this effect, we recalculate the case above by using a smaller F1/2 (F1/2 = 7.5 pN), which encourages the occurrence of unfolding. In this case, since the Sp domains will successively unfold under constant external pressure (256 pN/µm2), the skeleton will deform continuously until structural failures happen, e.g. the skeleton-bilayer dissociation. In practice we terminate the simulation when the deformation reaches L/Rp = 12. As shown in Fig. 8b, with F1/2 = 7.5 (and the same aspiration pressure) the unfolding effect greatly increases the magnitude of fjc near the cap area, which may increase the possibility of vertical skeleton-bilayer dissociation. Consequently, our simulation suggests that F1/2 (which is not considered in any other models) is a key parameter in RBC remodeling, which deserves dedicated experimental investigation.
4.3.4 Post-dissociation behavior – necking
In the previous section, we studied the contact force between the two layers before the dissociation. Our model is also capable of exploring the subsequent response after skeleton/bilayer dissociation. When the negative pressure in micropipette aspiration is sufficiently high, a vesicle will be separated from the cell. A vesicle is an entity formed by part of the cell membrane which is deficient in skeleton proteins such as band 3 [16], suggesting a scenario wherein its formation is caused by the skeleton separating from the lipid bilayer. It was observed in experiments that before a vesicle is created a region of reduced caliber, i.e. a neck, was formed in the middle section between the cap and the entrance [16]. The location of the neck may appear to be at odds with the fact the skeleton-bilayer dissociation should first occur close to the cap, where the maximum dissociation force occurs.
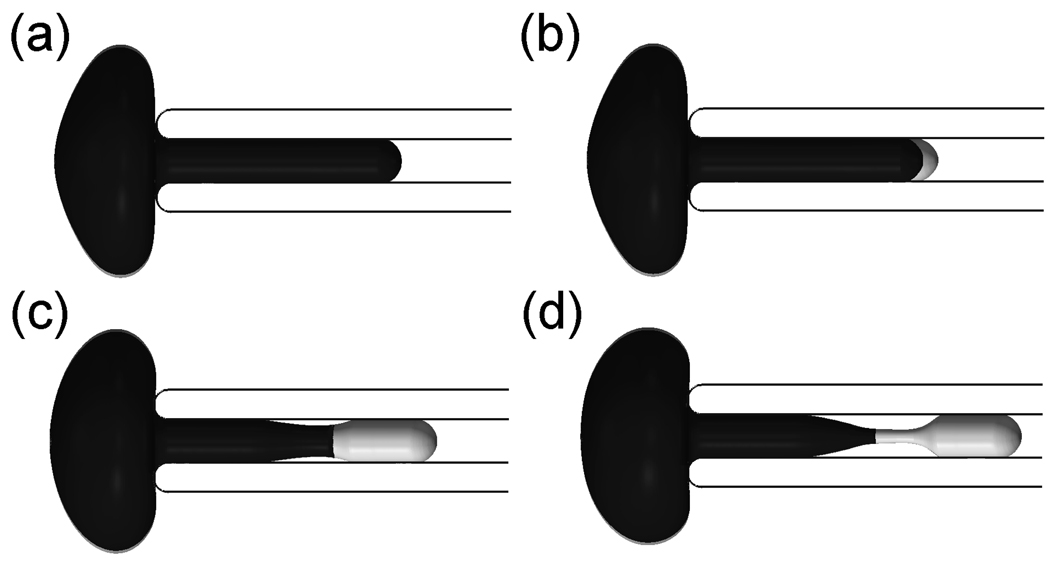
To shed light on this phenomenon, we simulate the post-dissociation behavior by assuming that the two layers separate when the magnitude of the dissociation force per JC reaches a critical value f̃jc=20 pN for the case with F1/2=7.5 pN in the previous section. We note that the choice of f̃jc does not affect the qualitative simulations that follow. However, further experiments are required to pinpoint its exact value. As shown in Fig. 10b, the separation is first observed in the cap region, consistent with the distribution of the dissociation force. Subsequently in Fig. 10c, when the skeleton network shrinks to certain extent, a separation between the lipid bilayer and the pipette inner surface begins, which eventually leads to formation of a neck (Fig. 10d). The tendency for necking is primarily due to two factors: 1) After the separation, the resultant force applied on the bilayer is significantly increased. For a cylindrical tether of lipid bilayer, Waugh and Hochmuth [43] showed that f0 = 2πkc/Rt, where f0 is the resultant force applied on the tether, Rt is the radius of the cylindrical tether and kc is the bending stiffness. For the lipid bilayer part without skeleton in Fig. 10c, we can also qualitatively apply this relation. When f0 is increased, Rt (here Rt is the radius of the cylindrical bilayer part) must decrease and it may lead to necking; 2) The skeleton at the cap region is significantly expanded before separation. After separation, it tends to contract, generating a large pulling force on the lipid bilayer in the radical direction toward the center of the pipette, which encourages the necking of the bilayer.
Figure 10.
FEM simulation of the necking process before vesiculation (lipid bilayer in light color and skeleton in dark color)
We also found that under the aforementioned conditions (i.e. external pressure of 256 pN/µm2 and F1/2=7.5 pN) the skeleton/bilayer dissociation occurs before Sp unfolding only if f̃jc <~4.0 pN, otherwise the separation occurs after Sp unfolding. Therefore, Sp unfolding may play a critical role in skeleton/bilayer separation. Additional experiments (especially the experiments to determine key parameters such as f̃jc and F1/2) are necessary to illustrate the role of Sp unfolding on skeleton/bilayer separation.
It is necessary to point out that this simulation is qualitative rather than quantitative – to accurately capture the dynamic separation process an accurate evaluation of the damping matrix C (see the Appendix) is required. This matrix summarizes the effect of the viscosity of the lipid bilayer and the protein skeleton, the friction between these two, and the effects of the surrounding fluid. Studies in this direction are underway and will be included in future reports.
5 CONCLUSIONS AND DISCUSSION
By using a multiscale modeling technique we have quantitatively studied the resting shape of erythrocyte, the quasi-static mechanical response prompted by mechanical loads, as well as the interaction force between the protein skeleton and the lipid bilayer. The primary purpose of this study is to build a framework for understanding erythrocyte mechanics upon which new knowledge from future experiments can be incorporated. Such a model analysis will also help us design new experiments to illustrate the exact mechanisms of mechanically induced membrane morphological changes, and to achieve quantitative predictions of the occurrence of remodeling (such as vesiculation) of normal or defected erythrocytes.
Compared with existing models of the RBC membrane [4, 12, 44, 45], our model has the following characteristics: (1) Our multiscale approach not only delivers accurate predictions of complete cell response (due to the involvement of the detailed molecular structure and responses at different levels), but also allows us to address physical mechanisms at different length scales and to correlate mechanical loads on the cell with detailed stress distributions within the composite structure. This model has predicted phenomena that had never been found by other models (e.g. bifurcation, mode switching, and stress-induced unstiffening due to unfolding) [31, 8]; (2) our model explicitly incorporates the local interactions between the skeleton and the bilayer, as well as the inter- and intra-molecule interactions inside the skeleton; (3) This model is inherently dynamic and capable of studying time-dependent responses at different length scales.
One possible application of this model is the prediction of the critical contact force between the lipid bilayer and the protein skeleton that triggers dissociation, leading to physiologically important phenomena such as vesiculation and tether formation. Among the existing experiments, observations of tether formations from erythrocytes inside flow channels (see for example [46]) or induced by cantilevers [6, 17] provide the only measure to quantitatively predict this critical dissociation process. In a typical flow channel setup, erythrocytes are allowed to sediment inside a channel consisting of two parallel plates. The substrate is coated with bovine serum albumin (BSA) so that most cells do not adhere to the bottom with large attaching areas. When external flows are introduced the cells deform while one (in some cases more than one) point remains attached to the substrate. Long membrane strands (tethers) may appear when the fluidic shear surpasses a threshold value (~1.5 dyn/cm2, or 0.15 pN/µm2) [46]. Although it is possible to duplicate deformations of the erythrocyte inside the flow channel and extract the contact force by using our model, these simulations suffer from uncertainties about the location and the detailed configuration of the contact area between the cell membrane and the substrate. In this context, the accuracy of a continuous complete cell model is also questionable due to the small size of the contact area between the cell and the substrate. A better approach will be to simulate a set of systematic micropipette aspirations by slowly increasing the negative pressure inside the pipette (to enforce the quasi-static condition) till vesiculation occurs. On the other hand, tangential forces between the skeleton and the bilayer associated with dynamic mechanisms may play an important role in the dissociation process (see for example, the tether formation experiments reported by Borghi and Brochard-Wyart [47]). To take this into account, it is critical to simulate the time-dependent viscoelastic behavior, rather than the quasi-static response, of the cell.
Other improvements of the model are also required. Rather than a rough view of total vertical loads on each JC achievable by our current model, a detailed distribution of mechanical loads among various skeleton-bilayer pinning points, as well as mechanical load on each inter-protein or protein-to-lipid connection are needed. A possible measure to achieve these is by concurrent multiscale models. For example, by modeling in molecular detail a piece of the skeleton while representing the rest of the skeleton as continuum shell, we will be able to relate lateral tension inside the protein skeleton to forces on the connection points. Besides Sp unfolding, other processes such as dissociation of Sp head-to-head linkages may also play important roles in determining structural responses of the cell in large deformations [9]. For comprehensive modeling these mechanisms should also be considered. In addition, more sophisticated thermal fluctuation model and fluid-skeleton-bilayer interaction model are required to accurately study close-coupling between the skeleton and the bilayer [48].
Acknowledgements
This work was supported by the National Heart, Lung, and Blood Institute under award number R01HL092793 .
Appendix. Finite element formulations
Numerically, we employ the finite element method to solve the mechanical response of the continuum shells in the complete cell model. The development of this finite element model is summarized below.
For nonlinear solid mechanics problem in small length scales (i.e. the inertia effect is negligible), the momentum equation governing the mechanical response of either one of these layers can be stated with updated Lagrangian description as:
| (7) |
with boundary conditions
| (8) |
where c is the viscous damping coefficient. u is the displacement vector. ∇ is the spatial gradient operator. Θ is the Cauchy stress. ΓD is the Dirichlet part of the boundary. Γext,N is the Neumann part of the boundary where external forces are applied. Γcnt,N is the Neumann part of the boundary where contact interaction forces are applied. n is the normal vector to the surface. fext represents the external forces (e.g. the pressure force inside a micropipette). fcnt is the contact force between the two layers, and between the outer layer and boundaries (e.g. micropipettes). g is the specified displacements on the boundary. Generally speaking, c, Θ, fext, fcnt and g are functions of u, v and t, where v = ∂u/∂t is the velocity.
We model both the outer layer (the lipid bilayer) and the inner layer (the protein skeleton) as congregations of shell elements. Although the C1-conforming thin shell elements are more accurate [49] (also see [13, 14] for an application of this method to model the lipid bilayer), for simplicity and numerically robustness, in our current study we choose the C0 explicit Hughes-Liu elements [50]. In some special cases, e.g. aspiration of an erythrocyte into a cylindrical micropipette from its dimple region, the configuration is axisymmetric so that axisymmetric Hughes-Liu shell elements can be employed to reduce computational effort.
After finite element discretization (detailed formulation of this method can be found in [50] and axisymmetric formulation can be found in [51]), the governing equation (7) is re-expressed in matrix form as
| (9) |
where C is the assembled damping matrix. In this study, we concentrate upon quasi-static cases so that C is a numerical parameter which affects the convergence via dynamic re-laxation but not the final result. Specifically, we use a lumped damping matrix based on row-sum technique [52]. vg represents the assembled velocity vector. is the global external force vector and is the global contact force vector. is the global internal force vector related to constitutive equations.
Based upon Eq. (9), the configuration of the thin layer is updated via a forward Euler algorithm.
Constitutive equations
To close our finite element formulations, we relate the in-plane components of stress Θ with the deformation via the constitutive law provided by Evans and Skalak [32]. For the inner layer (skeleton network), we use
| (10) |
is the in-plane Jacobian, where Fij (i, j = 1, 2) are the deformation gradients [53]. are components of the in-plane left Cauchy-Green deformation tensor.T̄ and µs are the isotropic tension and the shear modulus, which are defined in Eqs. (3) and (4). h is the thickness of the shell.
For the outer layer (lipid bilayer), since it is nearly incompressible, we use
| (11) |
where Kb = 5×10⁵ pN/µm is the area modulus of the outer layer. Although the outer layer is a fluidic and its shear modulus is nearly zero, for numerical stability we choose a small but nonzero value. In practice this value is chosen to be three orders of magnitude smaller than the shear modulus of the inner layer. Through sensitivity tests it has been shown that its actual value has no influence upon the results.
Finally, we update the transverse shear stresses Θ23 and Θ31 by using the linear elastic model expressed as
| (12) |
where γ̇23 and γ̇31 are the relevant strain rates related to the local deformation. G is the transverse shear stiffness (different for the inner layer and the outer layer). In our model, since both the inner layer and the outer layer are very thin, the transverse shear should be negligibly small. We find that as long as the transverse shear stiffness is sufficiently large, its actual value has no influence on the results.
Bending stiffness and spontaneous curvature
Considering a shell with thickness h described by Evans and Skalak [32], its bending stiffness kc and area modulus K are related by
| (13) |
This formula is implied in the previous finite element formulation. For the lipid bilayer, we use h = 2.2 nm and K = Kb = 5 × 10⁵pN/µm (see §3.3), then kc = 2 × 10⁻¹⁹ J. This is the same as the value used in [19]. It is also within the range of the reported bending stiffness (from 4 × 10⁻²⁰ to 3 × 10⁻¹⁹ J) [6, 12, 19, 54, 55, 56]. The discrepancy between the bilayer thickness used herein and its actual value (4 ~ 5nm) is attributed to the fact that in our study the bilayer is simplified as a continuous (but anisotropic) shell without considering its detailed molecular architecture.
The bending stiffness of the protein skeleton is negligibly small (experiments show that the persistence length of a Sp is only around O(1) nm [24], indicating that it has a small bending stiffness). It is found that if its thickness h is chosen to be comparable to that of the bilayer (in our simulations we choose h = 2 nm), this characteristics can be duplicated in our model. For example, with small deformations a typical value of the area modulus of the skeleton is around 20 pN/µm, leading to a bending stiffness of 6.67 × 10⁻²⁴ J, which is five orders of magnitude smaller than that of the lipid bilayer.
In its free state the lipid bilayer may also possess a spontaneous curvature C0, referring to the naturally formed curvature of a free patch of bilayer [57]. To account for it, we replace the deformation gradient tensor F, defined as , with F̂F̃, where F̂ is the deformation gradient caused by external loading and F̃ is the initial deformation gradient caused by the spontaneous curvature, which is defined initially before the simulation.
Interaction between outer layer and inner layer
The interaction between the outer layer and the inner layer in the vertical direction is modeled as uniformly distributed penalty springs. Tangentially, the two layers are allowed to slide viscously against each other (herein the exact magnitude of the viscous drag in the tangential direction rendered by the mobility of the transmembrane proteins band 3 and glycophorin C is irrelevant since we consider quasi-static cases through dynamic relaxation). A master-slave penalty contact formulation is employed [58]. The outer layer is treated as the master surface and the nodes on it are called master nodes, whereas the inner layer is considered as the slave surface and the nodes on it are called slave nodes. All the slave nodes are projected to the master surface, and the distances between the slave nodes and the master surface are calculated. The contact stress depends linearly upon these distances with a penalty stiffness. The contact force, defined as the contact stress times the area of the element, is distributed to the slave nodes and the master nodes. The penalty stiffness is tested numerically so that it is sufficiently large to enforce the contact constraint accurately, and small enough so that it does not introduce numerical instability during time integration.
Cell volume conservation
The internal volume of the cell is conserved through the following penalty algorithm
| (14) |
where ΔV is the volume change of the cell and ΔPi is the internal pressure against this change. ΔPi is uniformly distributed upon the outer layer. A large penalty parameter kv enforces volume conservation so that in all of our simulations the volume change is less than 3%. One exception is the deformation of a cell from a spherical shape. With the overall surface area fixed, a sphere encloses the maximum possible volume and it is impossible to deform it without volume loss.
References
- 1.Hoffman J. Blood Cells Mol. Dis. 2001;27:57. doi: 10.1006/bcmd.2000.0351. [DOI] [PubMed] [Google Scholar]
- 2.Lim GHW, Wortis M, Mukhopadhyay R. Proc. Natl. Acad. Sci. 2002;99:16767. doi: 10.1073/pnas.202617299. [DOI] [PMC free article] [PubMed] [Google Scholar]
- 3.Khairy K, Foo J, Howard J. Celluar and Molecular Bioengr. 2008;1:173. [Google Scholar]
- 4.Li J, Dao M, Lim CT, Suresh S. Biophys. J. 2005;88:3707. doi: 10.1529/biophysj.104.047332. 2005. [DOI] [PMC free article] [PubMed] [Google Scholar]
- 5.Zarda PR, Chien S, Skalak R. J. Biomechanics. 1977;10:211. doi: 10.1016/0021-9290(77)90044-6. [DOI] [PubMed] [Google Scholar]
- 6.Hwang WC, Waugh RE. Biophys. J. 1997;72:2669. doi: 10.1016/S0006-3495(97)78910-0. [DOI] [PMC free article] [PubMed] [Google Scholar]
- 7.Hochmuth R, Marcus WD. Biophys. J. 2002;82:2964. doi: 10.1016/S0006-3495(02)75637-3. [DOI] [PMC free article] [PubMed] [Google Scholar]
- 8.Zhu Q, R. Asaro R. Biophys. J. 2008;94:2529. doi: 10.1529/biophysj.107.119438. [DOI] [PMC free article] [PubMed] [Google Scholar]
- 9.Li J, Lykotrafitis G, Dao M, Suresh S. Proc. Natl. Acad. Sci. 2007;104(12):4937. doi: 10.1073/pnas.0700257104. [DOI] [PMC free article] [PubMed] [Google Scholar]
- 10.Mohandas N, Gallagher PG. Blood. 2008;112:3939. doi: 10.1182/blood-2008-07-161166. [DOI] [PMC free article] [PubMed] [Google Scholar]
- 11.Deutsch S, Tarbell JM, Manning KB, Rosenberg G, Fontaine AA. Annu. Rev. Fluid Mech. 2006;38:656. [Google Scholar]
- 12.Discher DE, Boal DH, Boey SK. Biophys. J. 1998;75:1584. doi: 10.1016/S0006-3495(98)74076-7. [DOI] [PMC free article] [PubMed] [Google Scholar]
- 13.Feng F, Klug WS. J .Comput. Phys. 2006;220:394. [Google Scholar]
- 14.Ma L, Klug WS. J .Comput. Phys. 2008;227:5816. [Google Scholar]
- 15.Berk DA, Hochmuth RM. Biophys. J. 1992;61:9. doi: 10.1016/S0006-3495(92)81811-8. [DOI] [PMC free article] [PubMed] [Google Scholar]
- 16.Knowles DW, Tilley L, Mohandas N, Chasis JA. Proc. Natl. Acad. Sci. USA. 1997;94:12969. doi: 10.1073/pnas.94.24.12969. [DOI] [PMC free article] [PubMed] [Google Scholar]
- 17.Waugh RE, R.G. Bauserman RG. Annals Biomed. Engr. 1995;23:308. doi: 10.1007/BF02584431. [DOI] [PubMed] [Google Scholar]
- 18.Butler J, Mohandas N, Waugh RE. Biophy. J. 2008;95:1826. doi: 10.1529/biophysj.108.129163. [DOI] [PMC free article] [PubMed] [Google Scholar]
- 19.Mohandas N, Evans EA. Annu. Rev. Biophys. Biomol. Struct. 1994;23:787. doi: 10.1146/annurev.bb.23.060194.004035. [DOI] [PubMed] [Google Scholar]
- 20.DeSilva TM, Peng K-C, Speicher KD, Speicher DW. Biochemistry. 1992;31:10872. doi: 10.1021/bi00159a030. [DOI] [PubMed] [Google Scholar]
- 21.An X, Lecomte MC, Chasis JA, Mohandas N, Gratzer W. J. Bio. Chem. 2002;277(35):31796. doi: 10.1074/jbc.M204567200. [DOI] [PubMed] [Google Scholar]
- 22.Anong WA, Weis TL, Low PS. J. Biol. Chem. 2006;281:22360. doi: 10.1074/jbc.M513839200. [DOI] [PubMed] [Google Scholar]
- 23.An X, Takakuwa Y, Nunomura W, Manno S, Mohandas N. J. Biol. Chem. 1996;271:33187. doi: 10.1074/jbc.271.52.33187. [DOI] [PubMed] [Google Scholar]
- 24.Rief M, Pascual J, Saraste M, Gaub HE. J. Mol. Biol. 1999;286:553. doi: 10.1006/jmbi.1998.2466. [DOI] [PubMed] [Google Scholar]
- 25.Lee JCM, Discher DE. Biophys. J. 2001;81:3178. doi: 10.1016/S0006-3495(01)75954-1. [DOI] [PMC free article] [PubMed] [Google Scholar]
- 26.Law R, Carl P, Harper S, Dalhaimer P, Speicher DW, Discher DE. Biophys. J. 2003;84:533. doi: 10.1016/S0006-3495(03)74872-3. [DOI] [PMC free article] [PubMed] [Google Scholar]
- 27.Paramore S, Voth GA. Biophys. J. 2006;91:3436. doi: 10.1529/biophysj.106.091108. [DOI] [PMC free article] [PubMed] [Google Scholar]
- 28.Rief M, Gautel M, Oesterhelt F, Fernandez JM, Gaub HE. Science. 1997;276:1109. doi: 10.1126/science.276.5315.1109. [DOI] [PubMed] [Google Scholar]
- 29.Sung LA, Vera C. Ann. Biomed. Eng. 2003;31:1314. doi: 10.1114/1.1635820. [DOI] [PubMed] [Google Scholar]
- 30.Vera C, Skelton R, Bossens F, Sung LA. Ann. Biomed. Eng. 2005;33:1387. doi: 10.1007/s10439-005-4698-y. [DOI] [PubMed] [Google Scholar]
- 31.Zhu Q, Vera C, Asaro R, Sche P, Sung LA. Biophys. J. 2007;93:386. doi: 10.1529/biophysj.106.094383. [DOI] [PMC free article] [PubMed] [Google Scholar]
- 32.Evans EA, Skalak R. Mechanics and thermodynamics of biomembranes. Boca Raton, FL: CRC Press; 1980. [Google Scholar]
- 33.Dao M, Li J, Suresh S. Mater. Sci. Engr. 2006;C26:1232. [Google Scholar]
- 34.Svoboda K, Schmidt CF, Branton D, Block SM. Biophys. J. 1992;63:784. doi: 10.1016/S0006-3495(92)81644-2. [DOI] [PMC free article] [PubMed] [Google Scholar]
- 35.Seifert U, Berndl K, Lipowsky R. Physical Review. A. 1991;44(2):1182. doi: 10.1103/physreva.44.1182. [DOI] [PubMed] [Google Scholar]
- 36.Peterson MA, Strey H, Sackmann E. J. Phys. II (France) 1992;2:1273. [Google Scholar]
- 37.Boal DH, Seifert U, Zilker A. Phys. Rev. Lett. 1992;69:3405. doi: 10.1103/PhysRevLett.69.3405. [DOI] [PubMed] [Google Scholar]
- 38.Waugh RE, Evans EA. Biophys. J. 1979;26:11532. doi: 10.1016/S0006-3495(79)85239-X. [DOI] [PMC free article] [PubMed] [Google Scholar]
- 39.Evans EA, Fung YC. Microvasc. Res. 1972;4:335. doi: 10.1016/0026-2862(72)90069-6. [DOI] [PubMed] [Google Scholar]
- 40.Discher DE, Mohandas N. Biophys. J. 1996;71:1680. doi: 10.1016/S0006-3495(96)79424-9. [DOI] [PMC free article] [PubMed] [Google Scholar]
- 41.Discher DE, Mohandas N, Evans EA. Science. 1994;266:1032. doi: 10.1126/science.7973655. [DOI] [PubMed] [Google Scholar]
- 42.Kozlov MM, Markin VS. Contemporary Problems of Biomechanics. CRC Press; 1990. p. 11. [Google Scholar]
- 43.Waugh RE, Hochmuth RM. Biophys. J. 1987;52:391. doi: 10.1016/S0006-3495(87)83227-7. [DOI] [PMC free article] [PubMed] [Google Scholar]
- 44.Mukhopadhyay R, Lim GHW, Wortis M. Biophys. J. 2002;82:1756. doi: 10.1016/s0006-3495(02)75527-6. [DOI] [PMC free article] [PubMed] [Google Scholar]
- 45.Svetina S, Kuzman D, Waugh RE, Ziherl P, Zêkŝ B. Bioelectrochemistry. 2004;62:107113. doi: 10.1016/j.bioelechem.2003.08.002. [DOI] [PubMed] [Google Scholar]
- 46.Hochmuth RM, Mohandas N, Blackshear JR PL. Biophys. J. 1973;13:747. doi: 10.1016/S0006-3495(73)86021-7. [DOI] [PMC free article] [PubMed] [Google Scholar]
- 47.Borghi N, Brochard-Wyart F. Biophys. J. 2007;93:1369. doi: 10.1529/biophysj.106.087908. [DOI] [PMC free article] [PubMed] [Google Scholar]
- 48.Heinrich V, Ritchie K, Mohandas N, Evans E. Biophys. J. 2001;81(3):1452. doi: 10.1016/S0006-3495(01)75800-6. [DOI] [PMC free article] [PubMed] [Google Scholar]
- 49.Cirak F, Ortiz M, Schröder P. Int. J. Num. Meths. Engr. 2000;47:2039. [Google Scholar]
- 50.Hughes TJR, Liu WK. Comput. Meths. Appl. Mech. Engr. 1981;26:331. [Google Scholar]
- 51.Hughes TJR, Liu WK. Comput. Meths. Appl. Mech. Engr. 1981;27:167. [Google Scholar]
- 52.Belytschko T, Liu W, Moran B. Nonlinear Finite Elements for Continua and Structures. New York: John Wiley; 2000. [Google Scholar]
- 53.Asaro RJ, Lubarda V. Mechanics of Solids and Materials. Cambridge Univ. Press; 2006. [Google Scholar]
- 54.Lin LC, Brown FL. Phys. Rev. E. 2005;72:011910. doi: 10.1103/PhysRevE.72.011910. [DOI] [PubMed] [Google Scholar]
- 55.Marcelli G, Parker KH, Winlove CP. Biophys. J. 2005;89:2473. doi: 10.1529/biophysj.104.056168. [DOI] [PMC free article] [PubMed] [Google Scholar]
- 56.Bo L, Waugh RE. Biophys. J. 1989;55:509. doi: 10.1016/S0006-3495(89)82844-9. [DOI] [PMC free article] [PubMed] [Google Scholar]
- 57.Helfrich W. Z. Naturforsch. 1973;C28:693. doi: 10.1515/znc-1973-11-1209. [DOI] [PubMed] [Google Scholar]
- 58.Malone JG, Johnson NL. Int. J. Num. Meths. Engr. 1994;37(4):559. [Google Scholar]


