Abstract
Mitochondria are crucial organelles in the production of energy and in the control of signalling cascades. A machinery of pro-fusion and fission proteins regulates their morphology and subcellular localization. In muscle this results in an orderly pattern of intermyofibrillar and subsarcolemmal mitochondria. Muscular atrophy is a genetically controlled process involving the activation of the autophagy-lysosome and the ubiquitin–proteasome systems. Whether and how the mitochondria are involved in muscular atrophy is unknown. Here, we show that the mitochondria are removed through autophagy system and that changes in mitochondrial network occur in atrophying muscles. Expression of the fission machinery is per se sufficient to cause muscle wasting in adult animals, by triggering organelle dysfunction and AMPK activation. Conversely, inhibition of the mitochondrial fission inhibits muscle loss during fasting and after FoxO3 overexpression. Mitochondrial-dependent muscle atrophy requires AMPK activation as inhibition of AMPK restores muscle size in myofibres with altered mitochondria. Thus, disruption of the mitochondrial network is an essential amplificatory loop of the muscular atrophy programme.
Keywords: atrophy, fission, mitochondria, skeletal muscle
Introduction
Skeletal muscle is a major site of metabolic activity and the most abundant tissue in the human body accounting for almost 50% of the total body mass. Being the largest protein reservoir, muscle serves as a source of amino acids to be used for energy production by various organs during catabolic periods (Lecker et al, 2006). For instance, amino acids generated from muscle protein breakdown are used by the liver to produce glucose and to support acute phase protein synthesis (Lecker et al, 2006). A number of catabolic disease states, including sepsis, cancer, AIDS, diabetes, heart and renal failure are characterized by muscle wasting, mainly reflecting increased breakdown of myofibrillar proteins. Conversely, some forms of physical activity can prevent decrease in skeletal muscle mass and induces clinical benefits for patients (Lynch et al, 2007). A large body of evidence has shown that ubiquitin–proteasome system is responsible for skeletal muscle protein loss. Two muscle-specific ubiquitin ligases, atrogin-1/MAFbx and MuRF-1, were found to be upregulated in all types of atrophy studied and their expression precedes the onset of muscle weight loss (Bodine et al, 2001; Gomes et al, 2001). We have recently defined that these ubiquitin ligases and protein breakdown in general are blocked by the growth-promoting IGF1/AKT pathway (Sandri et al, 2004; Stitt et al, 2004). Members of the FoxO family, downstream targets of AKT, were identified as the main transcription factors regulating not only atrogin-1 expression but also the atrophy programme (Sandri et al, 2004). Importantly, we have recently found that FoxO3 regulates autophagy through Bnip3 (Mammucari et al, 2007). Inhibition of Bnip3 greatly reduces autophagosome formation in skeletal muscles even in presence of activated FoxO3 (Hamacher-Brady et al, 2007; Mammucari et al, 2007). Bnip3 belongs to BH3-only proteins of bcl2 family and can induce apoptosis as well as mitochondrial fragmentation and mitophagy (Hamacher-Brady et al, 2007).
The autophagy-lysosome system controls morphology and function of organelles. Alterations in the content, shape or function of the mitochondria have been related with muscle wasting. For instance, insulin resistance in humans arises from defects in mitochondrial fatty acid oxidation, which in turn leads to increases in intracellular fatty acid metabolites (fatty acyl CoA and diacylglycerol) that disrupt insulin signalling causing atrophy (Koves et al, 2008). In sarcopenia, the loss of muscle mass with ageing, atrophic fibres have marked mitochondrial alterations due in part to increased mtDNA mutations (Figueiredo et al, 2008). Conversely, stimulation of β-oxidative metabolism and mitochondria biogenesis have been shown to reduce muscle wasting in most of these diseases including sarcopenia (Wenz et al, 2009). Accordingly, we have recently shown that overexpression of PGC1α, the master gene of mitochondrial biogenesis, inhibits muscle atrophy during fasting and denervation (Sandri et al, 2006). Altogether these observations suggest that changes in mitochondrial function might be an important player in determining muscle size. However, the function of this organelle is linked to its subcellular distribution as well as to its morphology. Mitochondrial shape is regulated by the balance between fusion and fission events, controlled by a family of ‘mitochondria-shaping' proteins (Dimmer and Scorrano, 2006). Changes in the mitochondrial morphology have been implicated in apoptosis as well as in the regulation of muscle metabolism (Soriano et al, 2006) or of cell cycle (Taguchi et al, 2007). Mitochondrial localization in muscle is tightly controlled to pair the organelle to the sarcoplasmic reticulum and to position them in between myofibrils. Likely, this fine regulation of mitochondrial position depends on the tightly controlled balance between fusion and fission processes.
It is unclear whether and how changes in the shape of the mitochondrial network have any role in the atrophy pathway. Here, we provide direct in vivo evidence of the existence of an amplifying loop of mitochondrial fission in atrophying muscles. The alterations of the mitochondrial network and of mitochondrial function induce a condition of energy unbalance, sufficient to feed forward on nucleus to activate a FoxO3-dependent atrophy programme through AMPK signalling. Thus, mitochondria contribute to muscle signalling during catabolic conditions.
Results
Mitochondrial network is remodelled in atrophying muscles, in vivo
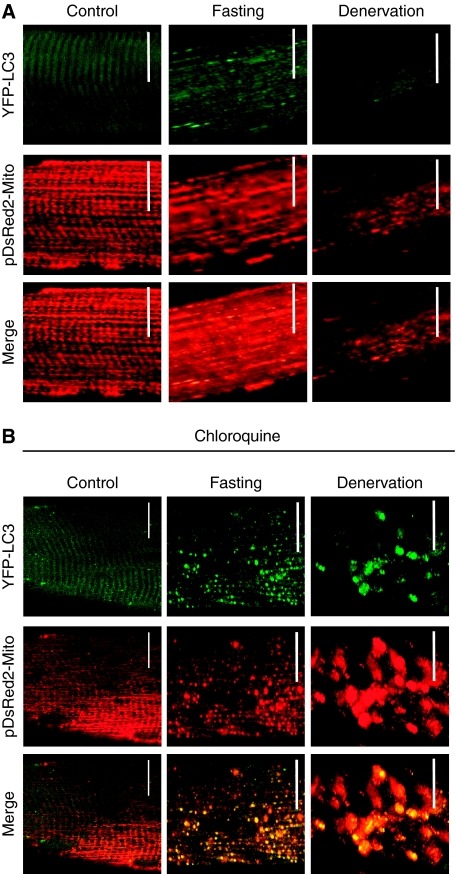
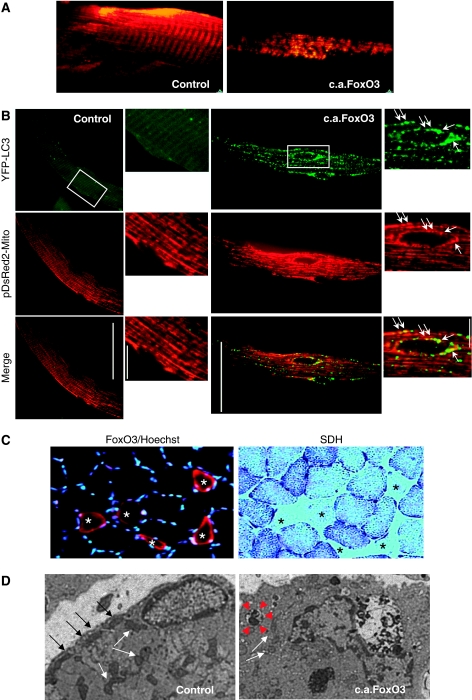
Mitochondria are reported to have an important role in triggering catabolic signals, which contribute to muscle loss and weakness. However, mitochondrial network has never been studied in vivo in atrophying muscles. To better identify the changes in mitochondria content, shape and localization we used our established transfection technique (Sandri et al, 2004, 2006; Mammucari et al, 2007; Sartori et al, 2009), which allows a high transfection efficiency without interfering with physiological homeostasis of muscle, to express fluorescent proteins in mitochondria of adult myofibres. Therefore, we co-transfected mouse tibialis anterior (TA) muscles with plasmids encoding mitochondrially targeted fluorescent protein (pDsRed2-Mito) and YFP-LC3, a fluorescent marker of autophagosome formation. Muscle atrophy was induced by denervation or fasting and mitochondrial morphology was monitored. Control and atrophied transfected muscles were studied in the live, anaesthetized animals by confocal microscopy, which allows imaging of mitochondrial activity and network morphology (Rudolf et al, 2004; Mammucari et al, 2007). Although normal skeletal muscle reported the typical striated distribution of intermyofibrillar and subsarcolemmal mitochondria, denervated and fasted muscles showed a disorganized mitochondrial network (Figure 1A). Concomitant with mitochondrial changes atrophying muscles showed an increase in LC3-positive vesicles, which co-localized with pDsRED2-Mito. However, compared with fasting, autophagosomes were rarely detected in denervated muscles. On blockage of lysosomal degradation by chloroquine, we detected a strong increase in autophagosome and autophagolysosome accumulation that co-localized with pDsRed2-Mito during both fasting and denervation, suggesting that the mitochondria were targeted to lysosomal degradation during atrophy (Figure 1B). This was further supported by the analysis of mitochondrial morphology in muscle-specific autophagy knockout mice (Masiero et al, 2009). Inhibition of autophagy greatly prevented mitochondrial changes in fasted muscles (Supplementary Figure S1), indicating that the mitochondrial network is remodelled through autophagy system during atrophy. As catabolic conditions activate FoxO transcription factors (Sandri et al, 2004, 2006; Mammucari et al, 2007), we used a genetic approach to activate the atrophy programme in muscle. Thus, we co-transfected mouse muscles with pDsRed2-Mito and a constitutively active FoxO3 (c.a.FoxO3) or a mock construct. The co-transfection with c.a.FoxO3 greatly disrupted the mitochondrial network (Figure 2A and B) and induced the formation of autophagosomes that engulfed portion of cytoplasm including the mitochondria (Figure 2B). Electron microscopy and histochemistry analysis confirmed that FoxO3 induces mitochondrial changes (Figure 2C and D). Therefore, these experiments show that mitochondrial network is altered during the activation of the FoxO-dependent atrophy programmes, irrespective of the initiating stimulus.
Figure 1.
Mitochondrial network changes during muscle atrophy. (A) Adult muscles were transfected with YFP-LC3 and with pDsRed2-Mito. Animals were starved for 24 h or denervated for 7 days. Muscles were exposed and observed in situ using confocal in vivo microscopy. At least five animals per condition have been studied. Scale bar, 20 μm. (B) Adult muscles were transfected with YFP-LC3 and with pDsRed2-Mito. Lysosomes were inhibited by treating mice with 50 mg/kg of chloroquine for 7 days. Chloroquine treatment started at the day of denervation and lasted for 7 days, whereas for fasting experiments at the 6th day of chloroquine injection food was removed for 24 h. Muscles were exposed and observed in situ using confocal in vivo microscopy. At least five animals per condition have been studied. Scale bar, 20 μm.
Figure 2.
FoxO3 controls mitochondrial network. (A) Imaging of FoxO3-mediated modification of the mitochondrial network in soleus muscle of living mice. Adult soleus muscles were transfected with pDsRed2-Mito and either c.a.FoxO3 or mock vector (control). Two weeks later, muscles were exposed and observed in situ using two-photon microscopy. At least five animals per condition were studied. (B) Overexpression of c.a.FoxO3 induces mitochondrial changes and removal through autophagy. Muscle fibres were transfected by electroporation with YFP-LC3, pDsRed2-Mito and either c.a.FoxO3 or mock vector. Two weeks later, fluorescent fibres were analysed for mitochondrial distribution by confocal microscopy. A higher magnification of the square is depicted on the right panels. White arrows point autophagosomes engulfing the mitochondria. (C) Overexpression of c.a.FoxO3 induces reduction in myofibre size and decrease in SDH staining. Left image: immunostaining for FoxO3 shows atrophic fibres, which over-expressed FoxO3 (red) and are labelled by asterisks. Nuclei are stained by Hoechst (blue). Right image: histochemistry for succinate dehydrogenase (SDH) on serial section. Note that fibres positive for FoxO3 are negative for SDH staining (asterisks). (D) Electron micrograph of a control and c.a.FoxO3-expressing fibres. Muscles were processed with standard fixation-embedding procedure. Black and white arrows indicate subsarcolemmal and intermyofibrillar mitochondria, respectively. Note that subsarcolemmal mitochondria are reduced in FoxO3 overexpressing fibres, whereas intermyofibrillar mitochondria are smaller and paler than control ones. Red arrowheads show a vesicle containing mitochondria. The image is representative of the FoxO3-transfected fibres.
Inhibition of mitochondrial fission protects from muscle loss during fasting
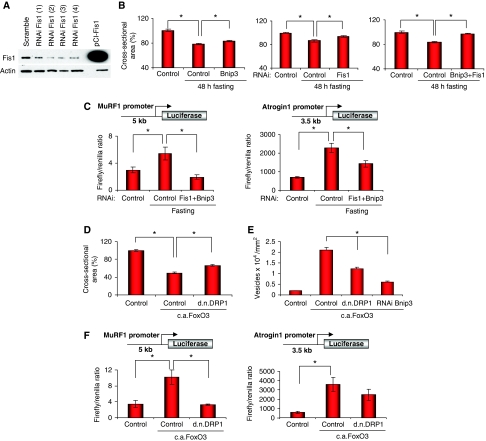
The changes of mitochondrial morphology in atrophying muscles (Figure 1) prompted us to investigate the relative contribution of mitochondrial network to muscle loss. We decided to block proteins that are reported to affect mitochondrial shape by an RNAi approach and to quantify the effects of their inhibition on muscle loss during starvation. DRP1 and Fis1 are two crucial components of the mitochondrial fission machinery (Wasilewski and Scorrano, 2009) that are expressed in normal and atrophying muscle (Supplementary Figure S2). To reduce fission of mitochondria we knocked down Fis1 protein. Bnip3 belongs to the atrogenes and is always upregulated in atrophy. Bnip3 has been shown to interact with DRP1 to fragment mitochondria (Kubli et al, 2007) and to regulate autophagy in skeletal muscles (Mammucari et al, 2007). Thus, we transfected adult TA muscles with vectors producing shRNAs specific for Fis1 and Bnip3 or unrelated oligos (lacZ, scramble). The small oligos efficiently knocked down Bnip3 expression and reduced Fis1 mRNA and protein (Figure 3A; Supplementary Figure S3 and Table S2). Two days of fasting induced almost 20% decrease in cross-sectional area of fibres transfected with control scramble shRNAs. Inhibition of Bnip3 showed minor effects on prevention of atrophy whereas inhibition of Fis1 alone or in combination with Bnip3 resulted in a more significant protection from muscle loss, which reached the 85% of protection when both components were blocked (Figure 3B). Similarly, Bnip3 and Fis1 inhibition partially protected slow muscles such as soleus from atrophy during denervation (Supplementary Figure S4). To explain such important protection, we investigated whether inhibition of Fis1 and Bnip3 affects also the expression of the critical atrophy-related ubiquitin ligases. We focused on ubiquitin–proteasome pathway as this system is always activated in atrophying muscles. To dissect this point we co-transfected MuRF-1 or atrogin-1 promoter together with Fis1 and Bnip3 shRNAs into TA muscle and after 8 days we starved the mice. These promoters have been already shown to contain the major regulatory elements for the correct upregulation of these ubiquitin ligases in atrophying muscles (Sandri et al, 2004; Mammucari et al, 2007; Sandri, 2008; Sartori et al, 2009). Importantly, Fis1 and Bnip3 knockdown reduced the activation of atrogin-1 and MuRF-1 promoters during fasting (Figure 3C). To further address the contribution of the mitochondria to the atrophy programme we turned to a genetic approach. We co-transfected skeletal muscles with c.a.FoxO3 and a dominant negative mutant of the fission protein DRP1 (DRP1K38A) (Smirnova et al, 2001). FoxO3-mediated muscle atrophy was significantly reduced when we inhibited DRP1 (Figure 3D). As FoxO3 controls the autophagy system to remodel the mitochondrial network we monitored whether we could successfully reduce vesicle formation in FoxO3-expressing fibres. We have already shown that Bnip3 inhibition blocks autophagy even in presence of activated FoxO3 (Mammucari et al, 2007) (Figure 3E). Thus, we checked whether autophagy was affected by DRP1 inhibition. Interestingly, FoxO3-mediated autophagosome formation was reduced by the co-transfection with DRP1K38A (Figure 3E; Supplementary Figure S5). Then, we tested whether DRP1 blockade can affect the FoxO3-mediated induction of MuRF-1 and atrogin-1 promoters. Consistent with fasting data, inhibition of DRP1 blocked the activation of MuRF-1 but only slightly reduced atrogin-1 induction (Figure 3F). Thus, the mitochondrial network signals to the nucleus and affects the two major proteolytic systems of the cell, the autophagy-lysosome and the ubiquitin–proteasome. We also checked whether apoptosis might contribute to muscle loss but apoptosis was not induced in fasting and was not activated by the expression of the fission machinery (Supplementary Figure S6) therefore excluding a general involvement of this system during muscle loss.
Figure 3.
Inhibition of the fission machinery or of Bnip3 partially protects from muscle loss. (A) RNAi-mediated knockdown of Fis1 showed by western blot assay. MEF cells were transfected with vectors expressing four different Fis shRNAs. For in vivo experiments Fis (4) was used. Efficiency of protein knockdown is indicated in Supplementary Table S2. (B) Blockade of Fis1 and of Bnip3 by RNAi reduces muscle loss during fasting. Adult skeletal muscles were transfected with specific shRNAs for mouse Fis1 (oligo 4) and mouse Bnip3 or co-transfected and 8 days later mice were starved for 48 h. Cross-sectional area (CSA) of transfected fibres, identified by GFP, was measured as described earlier (*P<0.01) n=450. (C) RNAi of Fis1 and Bnip3 significantly prevents MuRF-1 and atrogin-1 promoters activation during starvation. TA muscles were transfected with either 5 kb of the MuRF-1 promoter (left panel) or 3.5 kb of atrogin-1 promoter (right panel) with or without shRNAs vectors against Fis and Bnip3. In fasting experiments, after 7 days from transfection mice were starved for 24 h. A renilla-luciferase construct (pRL-TK) was co-transfected to normalized for transfection efficiency. The activation of MuRF-1 and atrogin-1 promoters was determined by firefly activity and normalize for the renilla. Each condition represents the average of at least three independent experiments±s.e.m. (*P<0.05). (D) Muscle atrophy induced by FoxO3 is reduced by d.n.DRP1. Adult skeletal muscles were transfected with HA-tagged c.a.FoxO3 with or without d.n.DRP1 and examined after 2 weeks. CSA of transfected fibres, identified by anti-HA immunofluorescence, was measured as described earlier (*P<0.001) n=400. (E) Blockade of the fission machinery by d.n.DRP1 or Bnip3 inhibition by RNAi reduces FoxO3-mediated autophagosome formation. Animals were transfected with YFP-LC3, c.a.FoxO3 in presence or absence of d.n.DRP1 or shRNAs against Bnip3. Twelve days later, muscles were collected and analysed for fluorescent vesicles formation (*P<0.001) n=450. (F) FoxO3-dependent activation of MuRF-1 and atrogin-1 is significantly reduced by inhibition of the fission machinery. MuRF-1 promoter (left panel) or atrogin-1 promoter (right panel) was co-transfected into adult TA muscle with or without c.a.FoxO3 and in the presence or absence of d.n.DRP1. A renilla-luciferase vector was co-transfected to normalize for transfection efficiency. Eight days later, firefly and renilla-luciferase activity was determined. Each condition represents the average of at least three independent experiments±s.e.m. (*P<0.05).
Induction of mitochondrial fission and dysfunction activates an atrophy programme
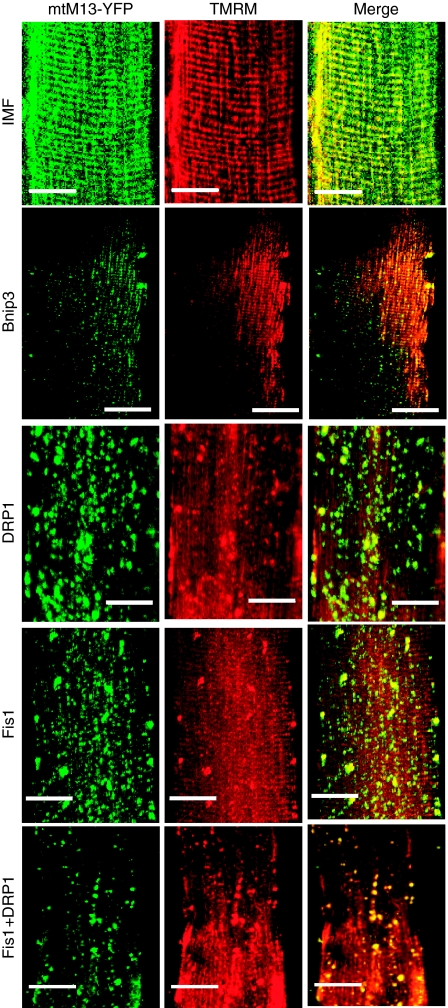
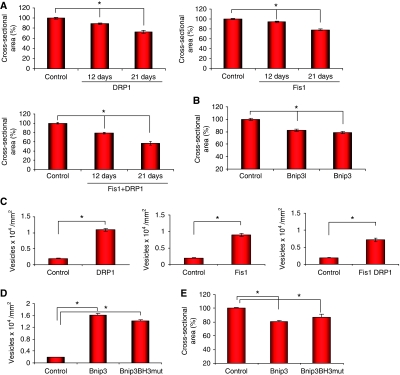
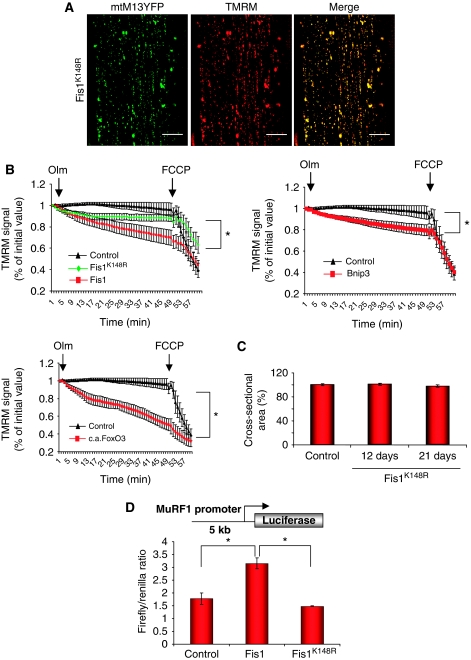
These data suggest that changes of mitochondrial shape per se might contribute to muscle loss. To dissect the contribution of mitochondrial network reorganization to muscle atrophy, we expressed the core components of the fission machinery or Bnip3 in adult skeletal muscle. As alteration of mitochondrial morphology can affect function of the organelle, we monitored both mitochondrial shape and membrane potential. We transfected TA muscles with plasmids encoding mitochondrially targeted fluorescent protein (mtM13-YFP). Seven days later, muscles were injected with tetramethyl rhodamine methyl ester (TMRM), a potentiometric fluorescent dye. In vivo confocal microscopy showed the expected mitochondrial striated pattern and a very good overlap of mtM13-YFP and TMRM (Figure 4), indicating that mtM13-YFP was a valid mitochondrial marker and that the membrane potential of mitochondria was intact and unaffected by transfection. Conversely, when we expressed Bnip3, DRP1, Fis1 or the couple DRP1–Fis1 in TA, staining with TMRM was lost or strongly reduced in several mitochondria, whereas others appeared to have a paradoxical increase, possibly because of clumping of organelles and concentration of fluorescence in a restricted area (Figure 4). Mitochondrial shape was greatly altered especially in myofibres co-transfected with both DRP1 and Fis1. The expression of the single components of the fission machinery and of Bnip3, even if to a lesser degree, resulted in changes of mitochondrial morphology, which resembled the mitochondrial alterations of FoxO3 overexpression (Supplementary Figure S7). Moreover, DRP1/Fis1-mediated mitochondrial fission activates autophagy to remove mitochondria (Supplementary Figure S8). These experiments showed that we successfully altered mitochondrial network in adult muscle. The next step was to study whether the core fission machinery and Bnip3 were sufficient to activate muscle atrophy. To this end, we expressed DRP1/Fis1 or Bnip3 and analysed muscle cross-sectional areas and we compared results obtained with mock-transfected fibres. DRP1/Fis1 induced muscle atrophy, which increased over time (Figure 5A). The degree of muscle atrophy correlated with the extent of mitochondrial network alteration. Similarly, Bnip3 or Bnip3l (a homolog of Bnip3) expression resulted in a reduction of fibre size (Figure 5B). Therefore, DRP1, Fis1 and Bnip3 triggered mitochondrial changes, autophagy induction (Figure 5C and D) and muscle atrophy. As Bnip3 contains a BH3 domain, which can disrupt beclin-1/Bcl2 complex and activate autophagy through beclin-1, we mutated the critical residues of this domain to address whether autophagy is sufficient to induce remodelling of mitochondrial network and muscle wasting. Muscle atrophy and autophagosome formation were unaffected by BH3 mutant (Figure 5D and E). However, expression of a Bnip3 lacking the mitochondrial localization signal (Bnip3-ΔTM) did not induce muscle atrophy (not shown, Supplementary Figure S9). We further explored whether the different mutants might affect the recruitment of autophagosomes on mitochondria. Bnip3 and Bnip3l contain two evolutionary conserved LIR (LC3 interacting region) domains that bind the Atg8 homologues, LC3 and Gabarap. Recent observations show that Bnip3l recruits the autophagy machinery on mitochondria by binding the lipidated LC3 and Gabarap at the LIR domain (Novak et al, 2010). When we monitored the localization of the different proteins by confocal microscope, we found that Bnip3 wild type and the BH3 mutant, but not Bnip3-ΔTM, co-localized with LC3-positive vesicles (Supplementary Figure S10). These findings confirm that BH3 domain is dispensable for autophagy activation and that Bnip3 effects are mediated by its action on the mitochondria. To further explore the signalling triggered by mitochondrial fission we used a Fis1 mutant (Fis1K148R), which dissociates mitochondrial fission from dysfunction (Alirol et al, 2006). This mutant induces mitochondrial fission preserving membrane potential also in muscle (Figure 6A). To further prove the involvement of mitochondrial dysfunction in muscle atrophy, we monitored mitochondrial potential in isolated adult fibres transfected with the different constructs for Fis1, Bnip3 and FoxO3. A latent mitochondrial dysfunction masked by the ATP synthase operating in the reverse mode, can be unveiled by the ATP synthase inhibitor oligomycin (Irwin et al, 2003). As expected, addition of oligomycin to control fibres did not cause immediate changes in membrane potential, and mitochondrial depolarization proceeded at slow rates even after extensive incubation (Figure 6B). Mitochondrial depolarization was achieved after addition of the protonophore carbonylcyanide-p-trifluoromethoxyphenyl hydrazone (FCCP). Mitochondria in fibres transfected with Fis1, Bnip3 and FoxO3 underwent marked depolarization after oligomycin, (Figure 6B). Conversely, mitochondria did not show a latent dysfunction in fibres transfected with Fis1K148R (Figure 6B). This finding confirms that Fis1K148R induces mitochondria fission while preserving mitochondrial function and, consequently, energy production (Supplementary Figure S11) (Alirol et al, 2006). To dissect whether mitochondrial dysfunction is additionally required to activate an atrophy programme we expressed Fis1K148R and analysed muscle cross-sectional areas. Accordingly, Fis1K148R was unable to reduce myofibre size. Next, we checked whether Fis1K148R caused the activation of the ubiquitin ligase MuRF-1. Expression of Fis1 induced the activation of MuRF-1 promoter whereas Fis1 K148R did not alter the basal promoter activity (Figure 6D). Altogether these findings suggest that remodelling of the mitochondrial network per se is not sufficient to activate the atrophy programme and that most likely mitochondrial dysfunction is additionally required to trigger muscle loss.
Figure 4.
Overexpression of DRP1/Fis1 and Bnip3 proteins induces changes in the mitochondrial network in vivo. In vivo imaging of the mitochondrial network was performed in muscles expressing Bnip3, an atrophy-related gene under FoxO3 control, and DRP1/Fis1 proteins. Adult muscles were transfected with plasmids encoding mitochondrially targeted yellow fluorescent protein (mtM13-YFP) and either mock vector, Bnip3, HA-DRP1, Fis1 or DRP1/Fis1. Seven days later (for Bnip3) or 12 days later (for DRP1 and Fis1), muscles were observed in vivo with confocal microscopy. TMRM was injected into the muscles to monitor mitochondria, which retain membrane potential. Muscles transfected with mtM13-YFP and mock vector showed the orderly pattern of intermyofibrillar and subsarcolemmal mitochondria (upper panel-IMF). Scale bar: 20 μm.
Figure 5.
Expression of pro-fission proteins and Bnip3 induces muscle atrophy. (A) Adult TA muscles were transfected with either DRP1, Fis1, DRP1 and Fis1 or mock vector. Muscles were collected 12 or 21 days after transfection and cross-sectional area of transfected fibres, identified by immunofluorescence, was measured as described earlier (*P<0.001) n=400. (B) Bnip3 or Bnip3 l expression for 7 days causes a 20% reduction of the cross-sectional area. TA muscles were transfected with Bnip3, Bnip3l or mock vector. Cross-sectional area of transfected fibres, identified by immunofluorescence, was analysed (*P<0.001) n=500. (C) Quantification of LC3-positive autophagic vesicles in adult muscles co-tranfected with YFP-LC3 and DRP1, Fis1 or DRP1/Fis1 expression plasmids or mock vector. (D) Mutations in BH3 domain of Bnip3 (Bnip3BH3mut) do not affect BNIP3-mediated autophagy. Adult muscles were co-transfected with YFP-LC3 and Bnip3 or Bnip3BH3mut expression plasmids and LC3-positive vesicles were quantified. (E) Bnip3-mediated atrophy is not modified by mutating the BH3 domain (Bnip3BH3mut). Adult TA muscles were transfected with Bnip3 or Bnip3BH3mut expression plasmids and cross-sectional area was quantified 7 days later and plotted as % of controls (*P<0.001) n=440.
Figure 6.
Fis1K148R induces mitochondrial fission but does not cause muscle atrophy and preserves mitochondrial function. (A) In vivo imaging of the mitochondrial network was performed in muscles expressing Fis1K148R. Adult muscles were transfected with plasmids encoding mitochondrially targeted yellow fluorescent protein (mtM13-YFP) and Fis1K148R. Twelve days later muscles were observed in vivo with confocal microscopy. TMRM was injected into the muscles to monitor mitochondria, which retain membrane potential. Mitochondrial network was greatly altered but mitochondrial membrane potential was conserved. (B) FDB muscle fibres were transfected by electroporation in vivo. Eight days later adult fibres were isolated and placed in cell culture. Adult fibres were loaded with TMRM (5 nM) for 30 min at 37°C. TMRM accumulates in the mitochondria that maintain mitochondrial membrane potential. Oligomycin (Olm, 5 μM) and the protonophore FCCP (4 μM) were added at the indicated time points. TMRM staining were monitored in at least 10 fibres per construct (*P<0.001). (C) hFisK148R-transfected muscles were collected 12 and 21 days after transfection. Cross-sectional area of transfected fibres, identified by anti-myc immunofluorescence, was quantified (n=550). (D) Fis1-dependent activation of MuRF-1. MuRF-1 promoter was co-transfected into adult TA muscle with or without Fis1 or Fis1K148R. A renilla-luciferase vector was co-transfected to normalize for transfection efficiency. Eight days later, firefly and renilla-luciferase activity was determined. Each condition represents the average of at least five independent experiments±s.e.m. (*P<0.05).
Mitochondrial fission modulates FoxO3 activity through AMPK
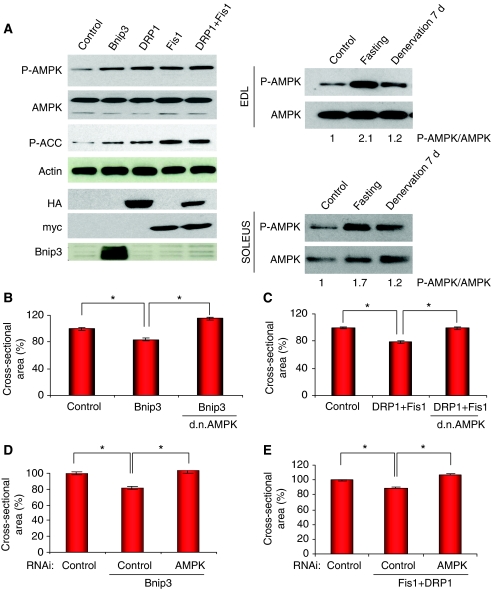
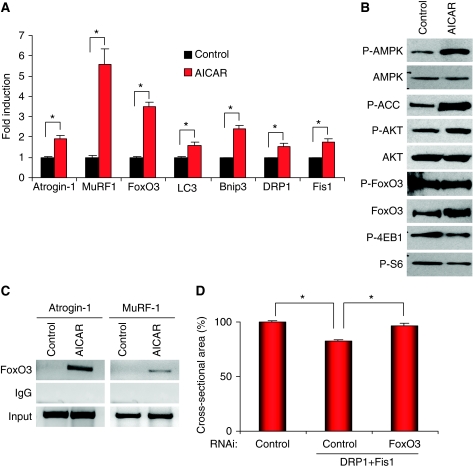
The next step was to understand how mitochondrial changes affect the atrophy programme. Mitochondria are essential for energy production, consequently when mitochondria are perturbed in their function and shape, energy production might be affected. AMPK is the cellular sensor of energy level. We therefore examined AMPK activation on expression of Bnip3, DRP1 and Fis1 in HEK293 cells. All these resulted in increased phosphorylation of AMPK and of its downstream target, ACC (Figure 7A). Similarly, denervated and starved EDL and Soleus muscles showed activation of AMPK, which correlates with the previously observed mitochondrial network changes (Figure 7A). Next, we expressed a dominant negative AMPK (Aguilar et al, 2007) in fibres transfected with DRP1/Fis1 or Bnip3. Inhibition of AMPK completely prevented both DRP1/Fis1- and Bnip3-mediated muscle atrophy (Figure 7B and C; Supplementary Figure S12). Identical results were obtained by knocking down AMPK (Figure 7D and E). Furthermore, inhibition of AMPK by RNAi in starved muscles phenocopied the protection obtained by knocking down both Bnip3 and Fis1 (Supplementary Figure S13). We then investigated the connection between AMPK and the activation of catabolic pathways. AMPK modulates FoxO3 action independently from AKT. Indeed, when muscle cell cultures were treated with AICAR, an AMPK activator, the FoxO3 targets, atrogin-1, MuRF-1, LC3 and Bnip3 were upregulated (Figure 8A). However, AKT phosphorylation was not suppressed by AICAR where mTOR downstream targets were partially dephosphorylated (Figure 8B). This finding supports an AKT-independent regulation of FoxO3. AMPK activation upregulated FoxO3 expression as recently described (Nakashima and Yakabe, 2007). Chromatin immunoprecipitation (ChIP) assay showed an increase in FoxO3 binding to atrogin-1 and MuRF-1 promoters in AICAR-treated myotubes (Figure 8C). Thus, according to recent findings, AMPK mainly affects FoxO recruitment to target promoters enhancing its transcriptional activity (Greer et al, 2007b). Finally, to establish the role of FoxO3 during mitochondrial fission, we transfected adult fibres with DRP1/Fis1 and shRNAs against FoxO3 or LacZ. Indeed, muscle atrophy induced by co-transfection of DRP1 and Fis1 was completely inhibited by FoxO3 knockdown (Figure 8D). These findings indicate that mitochondrial fragmentation activates the AMPK-FoxO3 axis, which induces expression of atrophy-related genes, protein breakdown and muscle loss.
Figure 7.
Mitochondrial fission and dysfunction contribute to muscle atrophy through AMPK. (A) Left panel: mitochondrial fission activates AMPK. HEK293 cells were transfected with a mock vector (control), Bnip3, DRP1, Fis1 or co-transfected with DRP1 and Fis1. Cells were collected 24 h later and lysates were analysed by immunoblotting. Right panel: immunoblotting analysis shows AMPK phosphorylation in EDL and soleus muscles during muscle atrophy. P-AMPK/AMPK ratio analysed by densitometric analysis is indicated below the panels. (B–E) Inhibition of AMPK blocks Bnip3- and DRP1/Fis1-mediated atrophy. (B) Adult TA muscles were transfected with Bnip3 together with d.n.AMPK or mock vector and cross-sectional area was measured (*P<0.001) n=480. (C) Adult TA muscles were transfected with DRP1 and Fis1 together with d.n.AMPK or mock vector. Twelve days later muscles were collected and cross-sectional area was quantified (*P<0.001) n=400. (D, E) RNAi-mediated knockdown of AMPK α 1 and α 2 inhibits Bnip3- and DRP1/Fis1-dependent atrophy. Mouse TA muscles were co-transfected with Bnip3 or DRP1 and Fis1 and pSuper vectors expressing shRNAs against lacZ (control) or AMPK. Twelve days later, TA muscles were collected and the cross-sectional area was quantified (*P<0.001) n=450.
Figure 8.
AMPK activation amplifies FoxO3-dependent muscle atrophy. (A, B) AMPK activation induces expression of atrophy-related genes in C2C12 myotubes. Myotubes were treated for 6 h with 1 mM AICAR. (A) Quantitative PCR analysis was performed in triplicates using specific oligonucleotides (see Supplementary Table 1) (*P<0.01). (B) Immunoblotting analysis shows that AICAR treatment causes phosphorylation of AMPK and the downstream target ACC but does not affect phosphorylation of AKT and FoxO3. (C) FoxO3 binding to atrogin-1 and MuRF-1 promoters, as determined by ChIP, is induced by AICAR treatment. (D) RNAi-mediated knockdown of FoxO3 inhibits DRP1/Fis1-dependent atrophy. Mouse TA muscles were co-transfected with DRP1 and Fis1 and pSuper vectors expressing shRNAs against either lacZ (control) or FoxO3. Twelve days later, muscles were collected and the cross-sectional area was quantified (*P<0.001) n=450.
Discussion
Skeletal muscle is a major site of metabolic activity in mammalians and, within the cell, mitochondria are crucial for maintaining an appropriate energy balance. Several metabolic adaptations occur in atrophying muscles (Lecker et al, 2004; Sandri et al, 2006). The mitochondria-rich oxidative type I muscle fibres switch into glycolytic type II fibres during denervation (Raffaello et al, 2006). Moreover, denervation, hindlimb suspension, microgravity, cancer, diabetes, burn injury, statin-mediated myopathy and ageing induce alterations in number or function of mitochondria in skeletal muscle (see Introduction; Padfield et al, 2005; Hanai et al, 2007). Consistent with the reduction of mitochondria, in many forms of muscle wasting expression of a variety of genes for enzymes important in glycolysis and oxidative phosphorylation are also suppressed co-ordinately (Sacheck et al, 2007). Therefore, the idea of blocking mitochondria-mediated signalling and metabolic changes to reduce muscle loss and to improve muscle contraction is suggestive and is supported by several other evidences. In fact, some forms of physical activity such as endurance exercise produces mitochondrial biogenesis and clinical benefits for patients (Eyre et al, 2004; Melov et al, 2007; Adams et al, 2008). Furthermore, we have found that when the levels of PGC-1α are maintained, either by use of transgenic mice or by transfecting adult muscle fibres, muscles are protected from atrophy. However, whether mitochondrial network is affected during catabolic conditions and whether mitochondria are potential source of signals for muscle atrophy has never been clearly addressed. Previous work has defined a major role of mitochondrial function to support protein synthesis and muscle hypertrophy. Studies on S6K1 and S6K2 knockout mice defined the importance of this pathway in energy homeostasis and muscle growth (Ohanna et al, 2005). These mice show activation of AMPK and muscle atrophy (Aguilar et al, 2007), a situation of energy stress similar to starvation, which was reversed by AMPK inhibition. Furthermore, treatment with oligomycin or with 2-deoxyglucose, both leading to energy balance stress, triggered muscle atrophy in muscle cell cultures (Aguilar et al, 2007). Here, we further determine the connection between dynamics of mitochondrial network, energy balance, catabolic pathways and muscle atrophy in adult muscle. By using in vivo approaches we have analysed whether changes of mitochondrial network occurs in atrophying muscles and whether it contributes to energy stress and muscle loss. We show that activation of different pathways of mitochondrial fission and removal in adult fibres induces muscle atrophy. These observations together with the findings that Fis1K148R mutant failed to induce muscle atrophy suggest that a certain mitochondrial damage is important for muscle atrophy. This point is supported by the AMPK activation, which is critical for muscle wasting during these catabolic conditions as AMPK blockade prevents most of the consequence of mitochondrial fission on myofibre size. Thus, mitochondrial remodelling induces an atrophy programme mainly by AMPK signalling. FoxO family of transcription factors are finely turned on or off by different mechanisms including acetylation, phosphorylation, mono- and poly-ubiquitination. Between the kinases that can phosphorylate FoxOs, AMPK has been recently found to activate FoxO3, but not FoxO1 or FoxO4 (Greer et al, 2007b). Indeed, AMPK activation extends the lifespan of Caenorhabditis elegans through the FoxO homolog, DAF16 (Greer et al, 2007a). An unsolved question of these studies is to define the physiological relevance of such regulation in mammals. Our data fit with the model that, under conditions of energy stress, FoxO3 activity is acutely enhanced by AMPK to sustain autophagy and protein breakdown as source of alternative energy substrates.
The simultaneous activation of the two main proteolytic pathways by FoxO3 presumably ensures that the loss of different cell components is coordinated on fasting or disuse and leaves the muscle with relatively normal composition, though reduced in strength because of the loss of myofibrillar components and in functional capacity through loss of mitochondria. Persistence of damaged mitochondria can induce release of death-promoting factors such as cytochrome-c, AIF, endonuclease g, which can affect myofibre viability. Furthermore, sublethal damage of mitochondria might locally generate ROS, which activates FoxO and NFκB to sustain protein breakdown and muscle atrophy. These mechanisms are important for removing damaged organelles and for preventing accumulation of unfolded/misfolded proteins. However, the AMPK and ROS-positive feedback loops on FoxO activity can aggravate protein breakdown and muscle loss during diseases (Supplementary Figure S14).
In conclusion, a new scenario is rising in which metabolic changes are critical to sustain muscle loss. These findings open a new set of candidate targets for developing new drugs against muscle loss.
Materials and methods
Reagents, plasmids and antibodies
See Supplementary data.
Animals and in vivo transfection experiments
All experiments were performed on adult male CD1 mice (28–32 g). In vivo transfection experiments were performed as described earlier (Sandri et al, 2004). In some experiments, mice were injected intraperitoneally with either saline solution or 50 mg/kg chloroquine. Chloroquine was administered twice daily. Animals were killed after 7 days of chloroquine treatment (see Supplementary data for details). Denervation was induced as described earlier (Sandri et al, 2006). Cryosections of transfected muscles were examined using a confocal fluorescence microscope. Muscle fibre size was measured in at least 400 transfected fibres as well as in an equal number of untransfected fibres from the same muscle as described (Sandri et al, 2004). Fibre cross-sectional area was measured using IMAGE software (Scion, FredAdenoviral Vectors erick, MD).
Cell culture and transient transfections
HEK293 FT, MEF cells and C2C12 myogenic cell line were cultured in DMEM (GIBCO-Invitrogen) supplemented with 10% foetal calf serum until cells reached confluence. To induce C2C12 myotube formation, the medium was replaced with DMEM containing 2% horse serum (differentiation medium) and incubated for 5 days before proceeding with experiments. Myotubes were treated with 1 mM AICAR for 6 h in DMEM. HEK 293 FT, MEF and myoblasts were transfected using Lipofectamine2000 (Invitrogen) according to the manufacturer's instructions. Cell culture experiments were repeated at least three times.
Single fibres transfection and mitochondrial membrane potential analyses
Mitochondrial membrane potential was measured in isolated transfected fibres from flexor digitorum brevis (FDB) muscles. In vivo muscle transfection was achieved by injection with GFP and either mock vector or Bnip3, Fis1, Fis1K148R, c.a.FoxO3 plasmids followed by in vivo electroporation as described earlier (Zhao et al, 2007). Twelve days after transfection, FDB fibres were obtained as described earlier (Mammucari et al, 2007; Zhao et al, 2007). Mitochondrial membrane potential was measured by epifluorescence microscopy based on the accumulation of TMRM fluorescence according to Irwin et al (2003). Briefly, FDB myofibres were placed in 1 ml Tyrode's buffer and loaded with 5 nM TMRM (Molecular Probes) supplemented with 1 μM cyclosporine H (a P-glycoprotein inhibitor) for 30 min at 37°C. Myofibres were then observed at Olympus IX81 inverted microscope (Melville, NY) equipped with a CellR imaging system. After identification of GFP-positive cells, sequential images of TMRM fluorescence were acquired every 60 s with a × 20 0.5, UPLANSL N A objective (Olympus). At the times indicated by arrows, oligomycin (Olm, 5 μM) (Sigma) or the protonophore carbonyl cyanide p-trifluoromethoxyphenylhydrazone (FCCP, 4 μM) (Sigma) was added to the cell culture medium. Images were acquired, stored and analysis of TMRM fluorescence over mitochondrial regions of interest was performed using ImageJ software (http://rsb.info.nih.gov/ij/).
Immunoblotting
Muscles and cells were lysed and immunoblotted as described earlier (Mammucari et al, 2007). Blots were stripped using Restore western blotting stripping buffer (Pierce) and reprobed if necessary. List of antibodies is depicted in Supplementary data.
Gene expression analyses
Total RNA was prepared from differentiated myotubes using the Promega SV Total Isolation kit. cDNA was synthesized using Invitrogen SuperScript III reverse transcriptase, and quantitative PCR was performed using the QIAGEN QuantiTect SYBR Green PCR kit. Signals were normalized to β-actin expression. The oligonucleotide primers used are shown in Supplementary Table S1.
Fluorescence microscopy and electron microscopy
Cryosections of transfected muscles were examined using a confocal fluorescence microscope. Electron microscopy preparation and observation were performed as described earlier (Mammucari et al, 2007). Five transfected muscles were analysed and more than 100 fibres were monitored.
In vivo imaging using two-photon microscopy
To monitor mitochondria morphology and autophagosome formation in living animals, muscles were transfected by electroporation. Unless otherwise stated, confocal microscopy was performed 12 days later on in situ exposure of transfected muscles as described earlier (Rudolf et al, 2006; Mammucari et al, 2007). In all, 500 nM TMRM was injected locally. To allow the muscle to recover from the injection-induced swelling, microscopic observation was interrupted for 2–5 min.
In vivo RNAi
In vivo RNAi experiments were performed as described earlier (Sandri et al, 2004) Sequences and plasmids are described in Supplementary Table S2.
ChIP assay
ChIP was performed as described earlier (Mammucari et al, 2007). Briefly, proteins were cross-linked with 37% formaldehyde. Myotubes were lysed with SDS lysis buffer (Upstate) and sonicated. Lysates were cleared with Protein-G Agarose, pelleted and incubated with anti-FoxO3 antibody. After incubation with antibody, protein–DNA complexes were eluted and the cross-links were reversed. DNA was amplified using primers, which flanked predicted FoxO3-binding sites in the atrogin-1 promoter and in MurF-1 promoter. MuRF-1 fw: 5′-GATAGCCTTACCAGCGTCCA-3′ MuRF-1 rv; 5′-AGCAGTGGGAGAGAGGGTTTA-3′.
Luciferase assay
Luciferase assays were performed by standard procedures in muscles removed 8 days after transfection with Fis1, Fis1K148R, c.a.FoxO3 and d.n.DRP1 expression vectors together with 3.5 kb of atrogin-1 promoter (3.5AT1) or 5 kb of MuRF-1 promoter (5.0MuRF-1) reporter constructs. RNAi-mediated knockdown of Fis1 and Bnip3 was induced by the transfection of pcDNA 6.2-GW/EmGFP-Fis1 and pSUPER Bnip3 shRNA vectors. These constructs were transfected into TA muscle together with a renilla-luciferase vector (pRLTK) to normalize for transfection efficiency as described earlier (Sandri et al, 2004). Results are expressed as mean±s.e.m. of at least three independent experiments.
Statistical analysis
Data were analysed by two-tailed Student's t-test. For all graphs, data are represented as mean±s.e.m.
Supplementary Material
Acknowledgments
This work was supported by grants from ASI (OSMA project), from Telethon Italy (TCP04009), the Italian Ministry of Education, University and Research (PRIN 2007) and from the European Union (MYOAGE, contract: 223576 of FP7) to MS, from DFG (RU923/3-1) to RR, from Telethon Italy, AIRC Italy, to LS; LC3-YFP was a generous gift from Dr Kominami and Dr Yoshimori. d.n.AMPK was a generous gift from Dr B Viollet.
Footnotes
The authors declare that they have no conflict of interest.
References
- Adams V, Doring C, Schuler G (2008) Impact of physical exercise on alterations in the skeletal muscle in patients with chronic heart failure. Front Biosci 13: 302–311 [DOI] [PubMed] [Google Scholar]
- Aguilar V, Alliouachene S, Sotiropoulos A, Sobering A, Athea Y, Djouadi F, Miraux S, Thiaudiere E, Foretz M, Viollet B, Diolez P, Bastin J, Benit P, Rustin P, Carling D, Sandri M, Ventura-Clapier R, Pende M (2007) S6 Kinase deletion suppresses muscle growth adaptations to nutrient availability by activating AMP kinase. Cell Metab 5: 476–487 [DOI] [PubMed] [Google Scholar]
- Alirol E, James D, Huber D, Marchetto A, Vergani L, Martinou JC, Scorrano L (2006) The mitochondrial fission protein hFis1 requires the endoplasmic reticulum gateway to induce apoptosis. Mol Biol Cell 17: 4593–4605 [DOI] [PMC free article] [PubMed] [Google Scholar]
- Bodine SC, Latres E, Baumhueter S, Lai VK, Nunez L, Clarke BA, Poueymirou WT, Panaro FJ, Na E, Dharmarajan K, Pan ZQ, Valenzuela DM, DeChiara TM, Stitt TN, Yancopoulos GD, Glass DJ (2001) Identification of ubiquitin ligases required for skeletal muscle atrophy. Science 294: 1704–1708 [DOI] [PubMed] [Google Scholar]
- Dimmer KS, Scorrano L (2006) (De)constructing mitochondria: what for? Physiology (Bethesda) 21: 233–241 [DOI] [PubMed] [Google Scholar]
- Eyre H, Kahn R, Robertson RM, Clark NG, Doyle C, Hong Y, Gansler T, Glynn T, Smith RA, Taubert K, Thun MJ (2004) Preventing cancer, cardiovascular disease, and diabetes: a common agenda for the American Cancer Society, the American Diabetes Association, and the American Heart Association. Circulation 109: 3244–3255 [DOI] [PubMed] [Google Scholar]
- Figueiredo PA, Mota MP, Appell HJ, Duarte JA (2008) The role of mitochondria in aging of skeletal muscle. Biogerontology 9: 67–84 [DOI] [PubMed] [Google Scholar]
- Gomes MD, Lecker SH, Jagoe RT, Navon A, Goldberg AL (2001) Atrogin-1, a muscle-specific F-box protein highly expressed during muscle atrophy. Proc Natl Acad Sci USA 98: 14440–14445 [DOI] [PMC free article] [PubMed] [Google Scholar]
- Greer EL, Dowlatshahi D, Banko MR, Villen J, Hoang K, Blanchard D, Gygi SP, Brunet A (2007a) An AMPK-FOXO pathway mediates longevity induced by a novel method of dietary restriction in C. elegans. Curr Biol 17: 1646–1656 [DOI] [PMC free article] [PubMed] [Google Scholar]
- Greer EL, Oskoui PR, Banko MR, Maniar JM, Gygi MP, Gygi SP, Brunet A (2007b) The energy sensor AMP-activated protein kinase directly regulates the mammalian FOXO3 transcription factor. J Biol Chem 282: 30107–30119 [DOI] [PubMed] [Google Scholar]
- Hamacher-Brady A, Brady NR, Logue SE, Sayen MR, Jinno M, Kirshenbaum LA, Gottlieb RA, Gustafsson AB (2007) Response to myocardial ischemia/reperfusion injury involves Bnip3 and autophagy. Cell Death Differ 14: 146–157 [DOI] [PubMed] [Google Scholar]
- Hanai JI, Cao P, Tanksale P, Imamura S, Koshimizu E, Zhao J, Kishi S, Yamashita M, Phillips PS, Sukhatme VP, Lecker SH (2007) The muscle-specific ubiquitin ligase atrogin-1/MAFbx mediates statin-induced muscle toxicity. J Clin Invest 117: 3940–3951 [DOI] [PMC free article] [PubMed] [Google Scholar]
- Irwin WA, Bergamin N, Sabatelli P, Reggiani C, Megighian A, Merlini L, Braghetta P, Columbaro M, Volpin D, Bressan GM, Bernardi P, Bonaldo P (2003) Mitochondrial dysfunction and apoptosis in myopathic mice with collagen VI deficiency. Nat Genet 35: 367–371 [DOI] [PubMed] [Google Scholar]
- Koves TR, Ussher JR, Noland RC, Slentz D, Mosedale M, Ilkayeva O, Bain J, Stevens R, Dyck JR, Newgard CB, Lopaschuk GD, Muoio DM (2008) Mitochondrial overload and incomplete fatty acid oxidation contribute to skeletal muscle insulin resistance. Cell Metab 7: 45–56 [DOI] [PubMed] [Google Scholar]
- Kubli DA, Ycaza JE, Gustafsson AB (2007) Bnip3 mediates mitochondrial dysfunction and cell death through Bax and Bak. Biochem J 405: 407–415 [DOI] [PMC free article] [PubMed] [Google Scholar]
- Lecker SH, Goldberg AL, Mitch WE (2006) Protein degradation by the ubiquitin-proteasome pathway in normal and disease states. J Am Soc Nephrol 17: 1807–1819 [DOI] [PubMed] [Google Scholar]
- Lecker SH, Jagoe RT, Gilbert A, Gomes M, Baracos V, Bailey J, Price SR, Mitch WE, Goldberg AL (2004) Multiple types of skeletal muscle atrophy involve a common program of changes in gene expression. FASEB J 18: 39–51 [DOI] [PubMed] [Google Scholar]
- Lynch GS, Schertzer JD, Ryall JG (2007) Therapeutic approaches for muscle wasting disorders. Pharmacol Ther 113: 461–487 [DOI] [PubMed] [Google Scholar]
- Mammucari C, Milan G, Romanello V, Masiero E, Rudolf R, Del Piccolo P, Burden SJ, Di Lisi R, Sandri C, Zhao J, Goldberg AL, Schiaffino S, Sandri M (2007) FoxO3 controls autophagy in skeletal muscle in vivo. Cell Metab 6: 458–471 [DOI] [PubMed] [Google Scholar]
- Masiero E, Agatea L, Mammucari C, Blaauw B, Loro E, Komatsu M, Metzger D, Reggiani C, Schiaffino S, Sandri M (2009) Autophagy is required to maintain muscle mass. Cell Metab 10: 507–515 [DOI] [PubMed] [Google Scholar]
- Melov S, Tarnopolsky MA, Beckman K, Felkey K, Hubbard A (2007) Resistance exercise reverses aging in human skeletal muscle. PLoS ONE 2: e465. [DOI] [PMC free article] [PubMed] [Google Scholar]
- Nakashima K, Yakabe Y (2007) AMPK activation stimulates myofibrillar protein degradation and expression of atrophy-related ubiquitin ligases by increasing FOXO transcription factors in C2C12 myotubes. Biosci Biotechnol Biochem 71: 1650–1656 [DOI] [PubMed] [Google Scholar]
- Novak I, Kirkin V, McEwan DG, Zhang J, Wild P, Rozenknop A, Rogov V, Lohr F, Popovic D, Occhipinti A, Reichert AS, Terzic J, Dotsch V, Ney PA, Dikic I (2010) Nix is a selective autophagy receptor for mitochondrial clearance. EMBO Rep 11: 45–51. [DOI] [PMC free article] [PubMed] [Google Scholar]
- Ohanna M, Sobering AK, Lapointe T, Lorenzo L, Praud C, Petroulakis E, Sonenberg N, Kelly PA, Sotiropoulos A, Pende M (2005) Atrophy of S6K1(−/−) skeletal muscle cells reveals distinct mTOR effectors for cell cycle and size control. Nat Cell Biol 7: 286–294 [DOI] [PubMed] [Google Scholar]
- Padfield KE, Astrakas LG, Zhang Q, Gopalan S, Dai G, Mindrinos MN, Tompkins RG, Rahme LG, Tzika AA (2005) Burn injury causes mitochondrial dysfunction in skeletal muscle. Proc Natl Acad Sci USA 102: 5368–5373 [DOI] [PMC free article] [PubMed] [Google Scholar]
- Raffaello A, Laveder P, Romualdi C, Bean C, Toniolo L, Germinario E, Megighian A, Danieli-Betto D, Reggiani C, Lanfranchi G (2006) Denervation in murine fast-twitch muscle: short-term physiological changes and temporal expression profiling. Physiol Genomics 25: 60–74 [DOI] [PubMed] [Google Scholar]
- Rudolf R, Magalhaes PJ, Pozzan T (2006) Direct in vivo monitoring of sarcoplasmic reticulum Ca2+ and cytosolic cAMP dynamics in mouse skeletal muscle. J Cell Biol 173: 187–193 [DOI] [PMC free article] [PubMed] [Google Scholar]
- Rudolf R, Mongillo M, Magalhaes PJ, Pozzan T (2004) In vivo monitoring of Ca(2+) uptake into mitochondria of mouse skeletal muscle during contraction. J Cell Biol 166: 527–536 [DOI] [PMC free article] [PubMed] [Google Scholar]
- Sacheck JM, Hyatt JP, Raffaello A, Jagoe RT, Roy RR, Edgerton VR, Lecker SH, Goldberg AL (2007) Rapid disuse and denervation atrophy involve transcriptional changes similar to those of muscle wasting during systemic diseases. FASEB J 21: 140–155 [DOI] [PubMed] [Google Scholar]
- Sandri M (2008) Signaling in muscle atrophy and hypertrophy. Physiology (Bethesda) 23: 160–170 [DOI] [PubMed] [Google Scholar]
- Sandri M, Lin J, Handschin C, Yang W, Arany ZP, Lecker SH, Goldberg AL, Spiegelman BM (2006) PGC-1alpha protects skeletal muscle from atrophy by suppressing FoxO3 action and atrophy-specific gene transcription. Proc Natl Acad Sci USA 103: 16260–16265 [DOI] [PMC free article] [PubMed] [Google Scholar]
- Sandri M, Sandri C, Gilbert A, Skurk C, Calabria E, Picard A, Walsh K, Schiaffino S, Lecker SH, Goldberg AL (2004) Foxo transcription factors induce the atrophy-related ubiquitin ligase atrogin-1 and cause skeletal muscle atrophy. Cell 117: 399–412 [DOI] [PMC free article] [PubMed] [Google Scholar]
- Sartori R, Milan G, Patron M, Mammucari C, Blaauw B, Abraham R, Sandri M (2009) Smad2 and 3 transcription factors control muscle mass in adulthood. Am J Physiol Cell Physiol 296: C1248–C1257 [DOI] [PubMed] [Google Scholar]
- Smirnova E, Griparic L, Shurland DL, van der Bliek AM (2001) Dynamin-related protein Drp1 is required for mitochondrial division in mammalian cells. Mol Biol Cell 12: 2245–2256 [DOI] [PMC free article] [PubMed] [Google Scholar]
- Soriano FX, Liesa M, Bach D, Chan DC, Palacin M, Zorzano A (2006) Evidence for a mitochondrial regulatory pathway defined by peroxisome proliferator-activated receptor-gamma coactivator-1 alpha, estrogen-related receptor-alpha, and mitofusin 2. Diabetes 55: 1783–1791 [DOI] [PubMed] [Google Scholar]
- Stitt TN, Drujan D, Clarke BA, Panaro F, Timofeyva Y, Kline WO, Gonzalez M, Yancopoulos GD, Glass DJ (2004) The IGF-1/PI3K/Akt pathway prevents expression of muscle atrophy-induced ubiquitin ligases by inhibiting FOXO transcription factors. Mol Cell 14: 395–403 [DOI] [PubMed] [Google Scholar]
- Taguchi N, Ishihara N, Jofuku A, Oka T, Mihara K (2007) Mitotic phosphorylation of dynamin-related GTPase Drp1 participates in mitochondrial fission. J Biol Chem 282: 11521–11529 [DOI] [PubMed] [Google Scholar]
- Wasilewski M, Scorrano L (2009) The changing shape of mitochondrial apoptosis. Trends Endocrinol Metab 20: 287–294 [DOI] [PubMed] [Google Scholar]
- Wenz T, Rossi SG, Rotundo RL, Spiegelman BM, Moraes CT (2009) Increased muscle PGC-1alpha expression protects from sarcopenia and metabolic disease during aging. Proc Natl Acad Sci USA 106: 20405–20410 [DOI] [PMC free article] [PubMed] [Google Scholar] [Retracted]
- Zhao J, Brault JJ, Schild A, Cao P, Sandri M, Schiaffino S, Lecker SH, Goldberg AL (2007) FoxO3 coordinately activates protein degradation by the autophagic/lysosomal and proteasomal pathways in atrophying muscle cells. Cell Metab 6: 472–483 [DOI] [PubMed] [Google Scholar]
Associated Data
This section collects any data citations, data availability statements, or supplementary materials included in this article.


