

Abstract
DNA release dynamics from layer-by-layer (LbL) films is an important aspect to consider with regards to localized gene delivery systems. The rate of DNA release and the condensation state of DNA during release are of particular interest in the field of gene delivery. A hyperbranched poly(amido amine) (RHB) containing bioreducible disulfide bonds is used to form interpolyelectrolyte complexes with DNA during LbL film assembly. During films disassembly, DNA is released in physiologic conditions due to the reducing nature of the RHB. Uncondensed DNA deposited on the surface was compared to DNA condensed by RHB in polyplex form by using two types of LbL films, RHB/DNA/RHB and polyplex terminated films, RHB/DNA/polyplex. LbL films with up to three layers are used in order to facilitate high-resolution AFM imaging. X-ray reflectivity, ellipsometry, and Fourier transform infrared spectroscopy are also used. The film disassembly, rearrangement and release of molecules from the surface due to thiol-disulfide exchange is conducted in reducing dithiothreitol (DTT) solutions. Salt is found to accelerate the overall rate of film disassembly. Additionally, it was found that the polyplex layer disassembles faster than the DNA layer. The predominant intermediate structure is the toroid structure for the polyplex layer and the fiber bundle structure for the DNA layer during film disassembly. This study offers a simple means to modulate DNA release from LbL films by utilizing both condensed and uncondensed DNA in different layers. The study highlights nanostructures, toroids and bundles, as dominant intermediate DNA structures during the DNA release from LbL films.
Keywords: Layer-by-layer film, film disassembly, DNA release, toroid formation, bioreducible polycations
INTRODUCTION
Layer-by-layer (LbL) assembly of thin multilayer DNA films is one of the most promising methods for highly controlled and localized delivery of therapeutic nucleic acids. The LbL technique is based on the adsorption of alternating polycation and polyanion layers where DNA is incorporated as the polyanion component. Since soluble polyplexes formed by mixing DNA with excess polycation contain an overall positive charge,(1-3) they can be incorporated as the polycation layer in contrast to a single polycation layer adsorbed during LbL film assembly. This may improve DNA loading and provide a further method to modulate the DNA release rate. LbL film assembly is advantageous over other methods due to its ability to precisely tune the DNA loading by altering the number of DNA layers.
LbL films containing DNA and polycations have shown successful DNA delivery and transfection of cells at the film surface.(4-7) High transfection levels are correlated with high film stability which is due to either the polyvalent nature of the electrostatic interactions, or for pH sensitive films, due to other non-specific interactions. In this regard, the disassembly and DNA release from LbL films require a physiologic trigger. Although a number of strategies suitable for disassembly of LbL films have been reported in recent years,(8) approaches to the release of DNA usually rely on hydrolytically or enzymatically degradable polycations.(9,10) On the other hand, the reducing microenvironment of the plasma membrane has been suggested to trigger disassembly of LbL films fabricated with disulfide-containing polycations.(11,12) It is expected that upon cell adhesion the reducing environment of the cellular plasma membrane will lead to cleavage of the disulfide bonds of the polycations at the film surface, and subsequent release of partially condensed DNA will occur in a localized and timely manner. Bioreducible poly(amido amine) polycations containing disulfide bonds, were shown to display increased transfection activity with low levels of cytotoxicity.(11,13-15) Our previous work on LbL films fabricated either with disulfide-containing polypeptides or disulfide-containing poly(amido amine)s have demonstrated ease of cellular attachment and proliferation with subsequently high transfection activity.(11,16) More importantly, bioreducible LbL films mediate effective transfection both in vitro and in vivo in rats, confirming that the reducing microenvironment of the plasma membrane can potentially serve as an effective trigger under physiologic conditions.
The localized gene delivery systems based on bioreducible LbL films can be enhanced if the DNA release mechanism can be fully understood. The DNA release is a critical limiting step in the overall gene delivery efficiency and therefore warrants further investigation. Furthermore, the release dynamics of DNA is a central component of gene delivery systems which requires exploration. Here we present data which show the steps in polycation cleavage as well as DNA reorganization, condensation and release from bioreducible LbL films. This study employs an established bioreducible polycation, poly(amido amine) which has shown increased transfection levels and low cytotoxicity in vitro.(17,18) Here, we investigate changes in the LbL film structure at the molecular level under simulated physiologic reducing conditions in order to determine the film disassembly rate as well as the size and shape of the species immediately prior to their release. The information will help us to design LbL film constituents for controlled and sustained gene delivery systems.
Recent studies of DNA release dynamics from bioreducible polyplexes have yielded interesting intermediate, partially decondensed DNA structures.(19,20) Here, Wan et al. showed distinctive stages of polyplex disassembly that were captured by AFM under simulated physiological conditions. In the first stage, polyplexes evolve from metastable structures into a more stable toroid structure. In the second stage, toroids interact with each other by aggregation. In the third stage, wormlike DNA chains and loops are connected by a central compact core. It is thought that disassembly-induced colloidal instabilities could impact nonviral gene delivery systems. DNA release dynamics from LbL films are expected to differ from those involving soluble polyplex nanoparticles because the two systems are vastly different in structure, particularly, with regard to the condensation state of the DNA. Additionally, LbL films with polyplexes embedded within their structure have been suggested to prolong DNA release from films over time.(6) In this study, the disassembly behavior of LbL films containing both a directly adsorbed DNA layer and adsorbed condensed DNA layer, the polyplex layer, are examined using a variety of surface characterization methods. The DNA release rate and structural evolution from the two types of DNA layers are compared. We only examine the LbL film containing up to three layers because their physical features can be monitored with higher molecular precision during film assembly and disassembly. DNA features tend to become more convoluted with increasing number of layers. The understanding of DNA release dynamics and rates from bioreducible LbL films will likely impact gene delivery and transfection efficiencies.
MATERIALS AND METHODS
Materials
gWiz™ high-expression luciferase plasmid (6,732 bp) (gfpDNA) was purchased from Aldevron and used as received. The contour length of DNA with 6,732 bp is estimated to be 2.3 μm. Water was deionized to 18 MΩ×cm resistivity using the Nanopure System from Barnstead. Grade V5 muscovite mica was purchased from Ted Pella and hand cleaved just before use. Polished n-type silicon wafers (resistivity 50–75 Ω×cm) were purchased from Wafer World. The silicon wafer was treated by the RCA method(21,22) before film deposition. The samples were cleaned at 60°C by ultrasonication in 1:2:8 HCl/H2O2/deionized water (by volume) for 30 min and then in 1:2:7 NH4OH/H2O2/deionized water (by volume) for another 30 min. Dithiothreitol (DTT, Sigma), 1-(2-aminoethyl)piperazine (AEPZ, Aldrich), 1-methylpiperazine (Aldrich), N,N’-methylenebisacrylamide (MBA, Aldrich), and N,N’-cystaminebisacrylamide (CBA, Polysciences) were purchased in the highest purity and used without further purification. All other chemicals were purchased from Sigma-Aldrich.
Polymer synthesis
The synthesis of hyperbranched and linear bioreducible poly(amido amine)s by Michael addition copolymerization was reported previously.(11) The different reactivity of the amines in AEPZ allows synthesis of either linear or hyperbranched polymers by simply changing the ratio of AEPZ-to-bisacrylamide monomers.(23) A 1:2 molar ratio of AEPZ to CBA+MBA yields hyperbranched polymers, while a 1:1 ratio leads to linear polymers. The chemical composition of the hyperbranched polymers is further varied by the CBA to MBA ratio, i.e., the reducible disulfide chain density. The hyperbranched poly(amido amine) used in this study, denoted RHB, has a CBA content of 32% by using a CBA:MBA feed ratio of 1:2. The chemical composition was characterized by 1H NMR and 13C NMR using a Varian spectrometer (400 MHz). Its weight-average molecular weight (Mw) is 66,000 with a polydispersity index (Mw/Mn) of 1.7. Mw and Mw/Mn were determined by size exclusion chromatography (SEC) in 0.03 M sodium acetate (pH 4.5) using a Shimadzu LC-10ADVP liquid chromatograph equipped with a CTO-10ASVP Shimadzu column oven and Polymer Labs PL gel 5 mm mixed C column. SEC data were analyzed using Astra 5.3.1.4 software from Wyatt Technology. Refractive index increments (dn/dC) were determined by an interferometric refractometer and used in SEC analysis. The low cytotoxicity of the bioreducible polymers is one of the motivations for this study. Cytotoxicity of the synthesized polycations and control were estimated by measuring cell viability at 50 mg/L of the polymer. All the bioreducible poly(amido amine)s had lower cytotoxicity than benchmark control branched polyethylenimine (PEI, 25 kDa) and their cytotoxicity decreased with increasing content of the reducible disulfide bonds (data not shown).
Film assembly and disassembly
In order to obtain high quality AFM images, thin and relatively smooth LbL films containing 1–3 layers were used. Four types of LbL films were studied, one layer of RHB, bi-layer RHB/DNA, tri-layer RHB/DNA/RHB, and tri-layer with the top layer being the polyplex layer, RHB/DNA/polyplex. 2 g/L RHB in 0.02 M sodium acetate buffer (pH 5.5) and 0.25 g/L DNA in 0.1 M sodium acetate buffer (pH 5.0) were used in the LbL deposition. The polyplex was formed by vortex mixing at 3,200 rpm (Fisher Scientific vortex mixer) for 10 s in the mixture of 0.02 g/L DNA in 0.03 M sodium acetate and 0.08 g/L RHB with 0.02 M sodium acetate. N/P > 2 is necessary for complete DNA condensation. From the weight, we derive the concentration N of cationic and P of anionic side groups. The polyplex solution (N/P = 4) was incubated at room temperature for 30 min before deposition. The substrate was immersed into the RHB solution for 15 min and rinsed three times by 2-min immersion in deionized water. The second and third layers were deposited using the same procedure as the first layer. Film disassembly was conducted in 0.02 M DTT (pH 6.8) solution with or without 0.1 M NaCl. The DTT solution is used to simulate the physiological environment, e.g., 0.02 M glutathione in the nucleus.(24)
Atomic force microscopy (AFM)
A Multimode IIIa AFM (Digital Instruments/VEECO) with an E-scanner (maximum scan area 14.2×14.2 μm2) was used for all AFM experiments. Tapping mode in air was conducted using silicon tips with a nominal radius of 8 nm (TESP, VEECO). Only height images are shown unless otherwise specified. Height images have been plane-fit in the fast scan direction with no additional filtering operation. The surface roughness of the films was determined using the root-mean-square surface roughness where zi is the height value and n is the number of pixels. The LbL film was taken out of the reducing solution periodically, rinsed in water bath three times, each time lasting 2 min, and dried before imaging. All subsequently reported surface roughness data derived from AFM were determined on 10×10 μm2 AFM height images.
Ellipsometry
In order to follow the thickness change during film disassembly, in situ ellipsometry studies were performed using a phase-modulated ellipsometer (Beaglehole Instruments, New Zealand) fixed at an angle of incidence near the Brewster angle (ΘB ≈ 70°) using the experimental procedure described in an earlier paper.(16) The ellipsometer measures the ellipticity, ρ = Im(rp / rs)ΘB . rp and rs are the complex reflection amplitudes for p and s polarizations, respectively. ρ is converted into film thickness L using the Drude equation. The large contrast between the optical dielectric constant of the silicon wafer (εSi = 3.9) and the organic film provides a high film thickness resolution of 0.02 nm averaged over the focused laser beam diameter of ~0.25 mm. As the organic components in the multilayer possess only a marginal difference in their optical constants, the film has been modeled as a slab of thickness L with a fixed dielectric constant. The experiments were performed in DTT solution with or without 0.1 M NaCl. The samples were set at the bottom of a standard 1 cm quartz cuvette, which was filled with the disassembly solution and capped in order to minimize DTT oxidation. Data points were automatically collected every 50 s for 24 h.
X-ray reflectometry (XRR)
The LbL films deposited on silicon substrates were analyzed by a Rigaku SmartLab X-ray diffractometer. A Rigaku 3 kW X-ray generator operating at 40 kV/30 mA with Cu Kα radiation λ = 1.542 Ǻ was used as the source. A SmartLab high resolution vertical θ/2θ goniometer was used. The measurement was conducted using the Rigaku Guidance Software Reflectivity Package with a scan angle range of 0–10°, step size of 0.01°, and a speed of 1°/min. The incident and receiving slit sizes were 0.05 and 0.25 mm, respectively. The reflectivity data were fitted to a model structure by the GIXRR software from Rigaku. The reflectivity data were analyzed by a Fresnel equation where R(QZ) and RF(QZ) are the measured reflectivity and the Fresnel reflectivity , respectively, at a scattering vector component Qz along the z-axis normal to the substrate surface where Qz = 4πsinθ/λ, θ is the incidence angle,λ is the wavelength andρ(z) is the average electron density of the layer at distance z. ρsub is the electron density of the substrate. The LbL layers were treated as separate layers. Both silicon substrate and its oxide layer were included in the analysis. The overall film thickness, L, was determined from the XRR curve according to the equation , where is the scattering vector at the n th order reflection intensity minimum.(25) The X-ray data were fitted using a nonlinear least-squares curve fitting algorithm in order to obtain optimum layer thickness, density, and interfacial roughness for each layer. We started with the bare RCA-treated substrate and obtained the thickness and roughness of the silicon oxide layer to be 20 nm and 0.45 ± 0.09 nm, respectively. Theses numbers were used in the fitting of the RHB-covered substrate. The RHB layer parameters obtained were then used in the data fitting of the RHB/DNA film, and so on and so forth. The data represents the total of the layers deposited on the surface by adding the data from the individual layers. The surface roughness was determined by taking into account the deviations of the decaying reflectivity curves of a rough surface from those of a perfectly flat surface.(26-29) Errors in the fittings were calculated by taking a 10% error determined by altering chi2 values, which represent fits within 10% range of the film thickness.
Fourier transform infrared spectroscopy (FTIR)
FTIR was used to investigate the change in the disulfide content during LbL disassembly. A Bruker Equinox 55S with a reflective imaging cell was used. RCA-treated silicon wafers were used as film substrates. The reflector was a self-built reflection device with a sample holder composed of two gold-platted mirrors and two gold-platted beam collimators. For the data acquisition, 32 scans were made with a range from 10,000 – 400 cm−1.
RESULTS AND DISCUSSION
LbL film assembly
The film structures, including thickness and roughness, are studied by AFM and XRR. The XRR data and fitted curves are listed in the Supporting Information. In general, the surface roughness measured by XRR does not always match that measured by AFM because XRR has a larger sampling area and surface roughness based on overall film heterogeneity.(30) The RHB monolayer thickness was found to be 1.2±0.2 nm with a roughness of 0.9 nm by XRR. The AFM image of the RHB monolayer is featureless and smooth with roughness Rq = 0.8 nm measured on a 10×10 μm2 area. For comparison, a DNA monolayer exhibited a film thickness of 2.3 nm and roughness of 1.9 nm by XRR. Since the DNA is negatively charged, it adsorbs on the RCA-silicon substrate only when the substrate is treated with 0.2 M MgCl2/0.1 M NaCl for 15 min. The surface roughness by XRR agrees well with Rq = 1.85 nm from AFM suggesting consistent film heterogeneity of the DNA monolayer. The AFM image of the DNA monolayer (Figure 1a) is consistent with a monolayer of uncondensed wormlike DNA chains with relaxed open-loop structure.(31) The DNA chain diameter was measured to be 2.2 nm by AFM sectional height analysis. On the other hand, the DNA layer adsorbed on RHB does not exhibit the wormlike chain feature (Figure 1b). The dominant features here are particulates with a lateral diameter at the half-height in the range of 10–30 nm, which is consistent with condensed or partially condensed DNA structure in the spheroid form.
Figure 1.

AFM images of a) the DNA layer (Rq = 1.85 nm), b) the RHB/DNA bi-layer(Rq = 2.11 nm), c) the RHB/DNA/RHB tri-layer(Rq = 2.98 nm), and d) the RHB/DNA/polyplex tri-layer(Rq = 4.71 nm). The scan size is 4 μm. The z-range is 15 nm. e) The cross-sectional height profile in (d).
The data suggest that the immobilized RHB layer on RCA-silicon is able to condense the DNA. This is different from the predominant view that soluble multivalent cations are required to condense the DNA into the toroid, rod, spheroid and other less defined condensed forms.(32-38) However, a few studies have reported DNA condensation on solid surfaces. In one of the first reports, Allen et al.(39) produced well defined toroids on mica by using Mg2+ to loosely bind the DNA to mica which was followed by the addition of a protamine solution. Fang and Hoh demonstrated DNA condensation on self-assembled organosilane monolayers.(40) A mobile fraction in the organosilane monolayer, that is, physically adsorbed molecules, was hypothesized to condense DNA. A more recent study showed condensation of adsorbed single DNA molecules by brief contact with anhydrous ethanol.(9) It uses solvent interactions to compete with DNA-surface interactions. Here we show that physically adsorbed RHB molecules have sufficient mobility to condense DNA. We hypothesize that the hyperbranched structure is responsible for DNA condensation. The hyperbranched structure makes a high percentage of free cationic segments available to bind to DNA as opposed to flat-lying linear chains. The high molecular weight and flexible structure may also contribute to DNA condensation suggesting that even with limited mobility DNA can still induce condensation. The surface roughness of the RHB/DNA bi-layer is 2.1 nm by AFM and 2.2 nm by XRR. XRR data suggests an increase in molecular density for RHB/DNA films compared to the sum of the adsorbed monolayers of RHB and DNA added together. The DNA density on the RCA-silicon appears to be less compared to the DNA layer adsorbed on the RHB films as seen with the XRR curves since the difference in shift of the minimum is found to be negligible. This means that increased amounts of DNA are adsorbing on the RHB layer compared to the RCA-silicon, most likely due to the low charge density of the substrate compared to the strong charge overcompensation of the monolayer of RHB on the surface, which better supports the DNA adsorption.
Similar film morphology lacking the wormlike DNA chain feature is exhibited by the RHB/DNA/RHB tri-layer film (Figure 1c). The film thickness is 5–6 nm according to XRR and ellipsometry. The film roughness increased somewhat with the additional RHB layer averaging 3.1 nm. The particulate size increased from 20–50 nm in lateral direction and 1–3 nm in height to 40–80 nm in lateral direction and 2–4 nm in height. The film morphology is again consistent with the condensed or partially condensed DNA structure.
Figure 1d shows the tri-layer RHB/DNA/polyplex with the top layer consisting of positively charged RHB/DNA polyplexes. By incorporating the DNA in previously condensed (polyplex) and uncondensed (naked DNA) state it may be possible to further modulate DNA release dynamics from the LbL film. The polyplex layer is characterized by spherical islands with height of 11.0±3.5 nm and lateral diameter of 170.0±65.2 nm. Figure 1e provides a sectional height profile across several islands and the dimensional analysis of a representative island. Due to the high heterogeneity of the RHB/DNA/polyplex film, XRR data is only used to obtain a general idea about the film since the error is found to be higher compared to films without polyplexes. When comparing the RHB/DNA/RHB XRR fitted curves to the RHB/DNA/polyplex curves, the shift in the minimum appears to support the idea that the films are of the same thickness, possibly a result of the XRR gathering data from the background layer of the polyplexes. Figure 2 shows that the space in between islands displays an underlying film feature similar to that in Figure 1b. The theoretical volume of a closely packed polyplex containing a single plasmid DNA with 6,732 bp is calculated to be 1.4×10⁴ nm3 by assuming interhexagonal separation between neighboring polycation and DNA to be 2.7 nm.(41), (19) Therefore it can be estimated that each island with a volume range between 8×10⁴ and 3×10⁶ nm3 contains 3 to 7 DNA plasmids.
Figure 2.
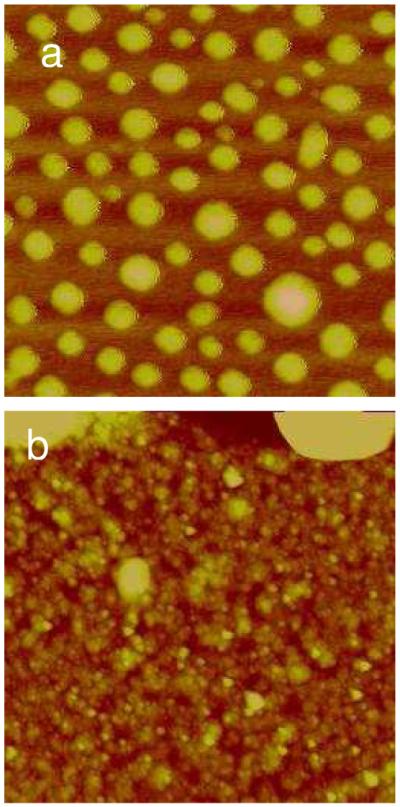
AFM images of the RHB/DNA/polyplex film. The scan size is a) 4 μm and b) 0.5 μm in a region in between islands.
LbL film disassembly
The film thickness of RHB/DNA/RHB and RHB/DNA/polyplex films as a function of immersion time in the DTT solution with varying salt concentrations from in situ ellipsometry is plotted in Figure 3. The RHB/DNA/RHB film thickness of 5.5 nm measured by ellipsometry, agrees well with that by XRR. The average thickness of the RHB/DNA/polyplex is 8.3–10.1 nm depending on the coverage of the polyplexes. Salt has a pronounced effect on the degradation rate of RHB/DNA/RHB but less on the film of the RHB/DNA/polyplex. When no salt is present, a higher degree of aggregation occurs, which limits the resolution of AFM imaging (Supporting Information). The degradation curves in Figure 3 all show initial rapid erosion within the first 1–2 h followed by a slower decrease in film thickness. For all films, the thickness is reduced to less than 2 nm after 10 h, indicating complete DNA removal from the substrate.
Figure 3.
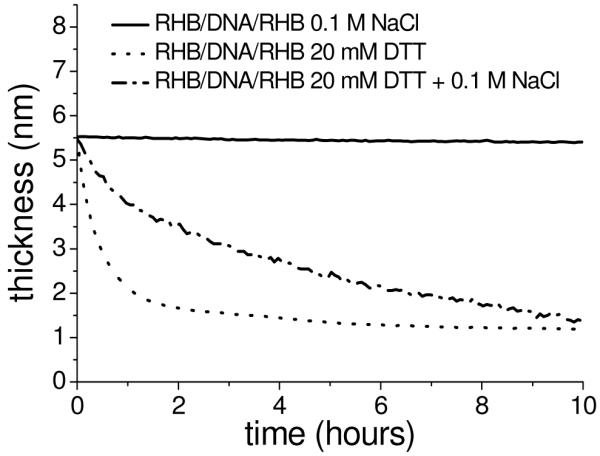
Ellipsometry data of thickness variation of the RHB/DNA/RHB (top) and RHB/DNA/polyplex (bottom) films as a function of time immersed in DTT solution over 10 h.
XRR data show a similar trend as ellipsometry data for the RHB/DNA/RHB film. The XRR curves are obtained at different degradation time intervals: 0, 6, 10, and 14 h (Supporting Information). For the RHB/DNA/RHB film, the shift of the second maximum to higher Qz with time indicates a decrease in the overall film thickness with time. After 14 h of disassembly in 20 mM DTT and 0.1 M NaCl, all RHB/DNA/RHB films are less than 2 nm thick and reveal visible aggregation leading to an undefined second maximum in XRR data. RHB/DNA/polyplex films appear to become thicker with disassembly due to the shift of Qz toward the minimum providing evidence that the initial measurements are of the background layer of the adsorbed polyplexes. As the films begin to break apart, the films become less heterogeneous and smoother leading to the appearance of a thicker film from the XRR data.
FTIR experiments are conducted to monitor the thiol-disulfide exchange reaction in the LbL film in the presence of DTT. The conversion of -S-S- into -S-H was monitored as a function of reaction time by measuring the peak area of 420–570 cm−1 (associated with -S-S-) and that of 2550 cm−1 (associated with -S-H vibration). The measurements are done ex situ by periodically taking out the sample from the reducing solution and drying it before each measurement. The DNA desorption/release from the substrate is monitored at 980 cm−1 (associated with the DNA backbone), 1090 cm−1 (associated with the symmetric PO2− vibration), and 1300 cm−1 (associated with the antisymmetric PO2− vibration). The initial peak areas associated with RHB and DNA are higher for the RHB/DNA/polyplex film than RHB/DNA/RHB film due to a higher loading of both species in the polyplex layer (Figure 4). The gradual decrease of -S-S- in the LbL film over a 10 h period is most likely due to desorption of oligomeric reaction products and not due to the initial disulfide/thiol exchange reaction since this reaction occurs very quickly.(42,43) Similarly DNA desorption occurs slowly within the 10 h period. A minimum salt concentration of 0.1 M seems necessary for the DTT-induced disassembly of the RHB/DNA/RHB film. Futhermore, there is a shift in the -S-S- average intensity suggesting a change in either the packing density or orientation of the -S-S- bond. The -S-S- bond intensity shift can be the result from binding to the DNA backbone or unfolding of the DNA seen in the gradual shift in FTIR intensity. The change in packing density or orientation of DNA on the surface is seen by the symmetric and anti-symmetric PO2− peak position shifts.
Figure 4.

FTIR peak area belonging to the -S-S- bond (top) and the PO2− group (bottom) during disassembly of the RHB/DNA/RHB and RHB/DNA/polyplex films.
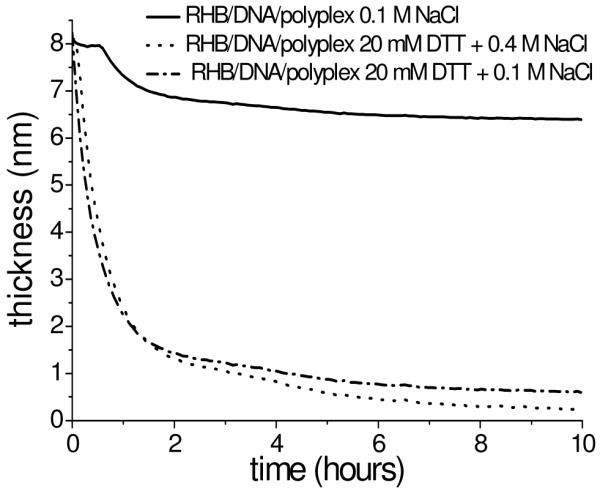
The film morphological change during disassembly is monitored by ex situ AFM. Time-lapse images of RHB/DNA, RHB/DNA/RHB, and RHB/DNA/polyplex films are presented in Figure 5, 6, and 7, respectively. The surface roughness decrease during film degradation is apparent in these films (Figure 8). Surface roughness decrease is more rapid in the first couple of hours followed by a more gradual decrease toward a limiting value. This is consistent with XRR, ellipsometry, and FTIR results and is associated with desorption/release of DNA chains from the substrate. One explanation of the two-stage release behavior is that the first stage is dominated by the desorption of excess polycations upon degradation from high-molecular-weight to low-molecular weight species and the second stage is dominated by the slower rearrangement of remaining film molecules and their eventual desorption. Table 1 lists the percentage of DNA coverage as a function of degradation time. The percent coverage was obtained using the Bearing Analysis command of the Nanoscope software. For all films, it is concluded that after 4 h only 20% or less of the film area contain DNA. A complete DNA release is estimated to occur between 8 and 14 h.
Figure 5.

Time-lapse AFM images of the RHB/DNA film in 20 mM DTT and 0.1 M NaCl. a) 0 h (Rq = 2.05 nm). b) 2 h (Rq = 2.02 nm). c) 4 h (Rq = 1.94 nm). d) 6 h (Rq = 1.65 nm). e) 8 h (Rq = 1.34 nm). The scan size is 4 μm. The z-range is 15 nm. f) Cross-sectional height profile of (b) along the dashed white line.
Figure 6.

Time-lapse AFM images of the RHB/DNA/RHB film in 20 mM DTT and 0.1 M NaCl. a) 0 h (Rq = 2.98 nm). b) 2 h (Rq = 2.34 nm). c) 4 h (Rq = 1.73 nm). d) 6 h (Rq = 1.62 nm). e) 8 h (Rq = 1.21 nm). The scan size is 4μm. The z-range is 15 nm. f) Scanned at 1×1 μm2 for (b). g) The cross-sectional height profile of (b) along the dashed white line.
Figure 7.

Time-lapse AFM images of the RHB/DNA/RHB film in 20 mM DTT and no salt. a) 2 h (Rq= 2.62 nm). b) 4 h (Rq= 2.02 nm). c) 6 h (Rq= 1.91 nm). d) 8 h (Rq= 1.92 nm). The scan size is 4μm and the z-range is 15 nm. e) The cross-sectional height profile along the dashed white line in (a).
Figure 8.
Surface roughness as a function of degradation time from AFM height images with scan size = 4 μm.
Table 1.
Percentage values of DNA remaining on the surface during film disassembly and total time for DNA to be released from films. The total time is measured by taking cross-sectional AFM measurements and measuring the coverage percentage associated with the DNA feature
| 2 h | 4 h | 6 h | 8 h | 10 h | 12 h | 14 h | |
|---|---|---|---|---|---|---|---|
| RHB/DNA (DTT + 0.1M NaCl) | 40% | 20% | 5-10% | X | X | X | X |
| RHB/DNA/RHB (DTT + 0.1M NaCl) | 50% | 20% | 10% | 5-10% | X | X | X |
| RHB/DNA/RHB (DTT) | 60% | 30% | 20% | 10% | 5-10% | 5-10% | X |
| RHB/DNA/polyplex(DTT + 0.1M NaCl) | 60% | 40% | 20% | 10% | 5-10% | X | X |
| RHB/DNA/polyplex(DTT + 0.4M NaCl) | 30% | 10% | 5-10% | X | X | X | X |
A closer examination of the AFM images revealed molecular-level structural information during film degradation that is not captured by XRR, FTIR, or ellipsometry. Figure 5 shows the RHB/DNA film erosion with time in the DTT solution. Upon reduction of high-molecular-weight RHB into smaller oligocations, DNA strands in extended and bundled arrangement emerge in the film. The transition from a homogeneous film to a porous film is striking during the first 2 h of degradation. Figure 5b shows holes 0.4–0.7 μm in diameter in between DNA bundles. AFM height analysis (Figure 5f) reveals three features at different heights: 1) the smooth feature at the lowest height is assumed to be the substrate; 2) the smooth layer, 1.5–1.8 nm above the substrate, is consistent with the RHB layer; and 3) The fibrous, bundled network, 2.0–3.3 nm above the RHB layer, is the DNA layer. The extra separation distance between neighboring DNA strands beyond the DNA diameter itself, 1–2 nm, suggests the presence of oligocations still bound to the DNA chain. After 4 h, the DNA layer coverage is decreased and broken up, which is consistent with a gradual loss of film material rather than a sudden loss or peel off of the whole layer. After 6 h, there is little DNA layer left. After 8 h, only the RHB layer remains with a film thickness of 1.3–1.6 nm and a surface coverage of 90%.
The RHB/DNA/RHB film morphological changes in 20 mM DTT and 0.1 M NaCl as well as in 20 mM DTT alone are presented in Figure 6 and Figure 7, respectively. The absence of salt slows down the film degradation. The complete disappearance of the fibrous feature takes 12–14 h in the absence of salt, about 4 h longer compared to films disassembled with 0.1 M NaCl. After 14 h, a smooth film with a thickness of 1.8 nm remains on the surface, which corresponds to a monolayer of the degradation product, low-molecular-weight RHB, bound to the RCA-silicon substrate. Despite the difference in the degradation rate, the morphological transitions are similar for the RHB/DNA/RHB films with and without the salt. Three distinctive layers were captured. The fibrous top layer at 2 h in the absence of salt is about 10% more dense than that in the presence of salt, which is consistent with a slower degradation rate when no salt is added (Table 1). It also appears that during the disassembly, the top fibrous layer conforms to the rearrangement of the underlying RHB layer indicating a cooperative release behavior between the DNA and RHB layer. When comparing RHB/DNA and RHB/DNA/RHB films, DNA chain aggregation into bundles is more pronounced for the RHB/DNA/RHB film, particularly in the absence of salt. The additional layer of RHB adsorbed with the DNA free charges stabilizes the DNA chains within the film and slows down the degradation.
The dominant structure during LbL film disassembly of RHB/DNA and RHB/DNA/RHB is the DNA bundle and its network. Such bundles have been observed by others.(44) AFM and simulation studies by Iwataki et al. illustrated the first-order transition from single chain compaction and multichain bundle formation.(45) Ono et al.(46) obtained in situ AFM images that show two nearby condensates interacting with each other and forming parallel strands as an intermediate to the final multimeric aggregate. The parallel strand formation was attributed to hydrophobicity minimization from the bound polycation. (47,48) The hydrophobic interaction may also play a role since the low-molecular-weight RHB degradation produces are capable of rearranging to expose its hydrophobic parts similar to the mechanism behind DNA bundling. The intermediates during polyplex disassembly, their structural heterogeneity, and its role in condensate stability are the key issues for the understanding of DNA release dynamics and will likely impact nonviral gene delivery research.
In the case of the RHB/DNA/polyplex film, the dominant feature appears to be the toroid structure during film degradation (Figure 9). After 4 h a dense layer (~80% in area coverage) of toroids formed (Figure 9b). The diameter of the toroids is 180–250 nm and the height is 3.0–4.5 nm in the range of reported toroid structures. The lower than expected thickness is likely caused by drying. It is also possible that the toroids formed in the LbL film are thinner than toroids formed in solution possibly due to the height of the toroids being reduced by the height of the film. After 6 h of disassembly, only about 20% of the toroids remain on the surface. Traces of condensed DNA remain on the surface after 8 h and no DNA remains at 10 h. After 8 h, little film material is left.
Figure 9.

Time-lapse AFM images of the RHB/DNA/polyplex film in 20 mM DTT and 0.1 M NaCl. a) 0 h (Rq=4.57 nm). b) 4 h (Rq= 1.91 nm). c) 6 h (Rq=1.43 nm). d) 8 h (Rq = 1.21nm). The scan size is 4 μm and the z-range is 15 nm. d) Cross-sectional height profile of (b) along the dashed line.
The toroid structure has been the subject of a previous study, which uses AFM to capture polyplex structural transition during reductive degradation of similar RHB polycations. The bioreducible RHB polyplexes were adsorbed on the mica substrate and imaged in the DTT solution by AFM.(20) Within a few minutes in the DTT solution, polyplexes of various shapes and sizes transformed into a more stable toroid structure. It was concluded that the polyplex formation is dominated by kinetic factors. When the high-molecular-weight polycations are converted into low-molecular-weight polycations, the transition energy is lowered to allow kinetically trapped structures to transform into the lowest energy form, that is, the toroid structure. The only difference between this and the previous study is in the rate of toroid formation. In the previous study, the toroid forms and disappears within 30 min of immersion in the DTT solution when adsorbed on mica. The toroid structure formed on top of a DNA layer appears to be more persistent beyond 6 h. It is possible that the polyplex entanglement with the DNA stabilizes the toroid structure.
In higher salt concentration, 0.4 M NaCl, the disassembly rate of polyplexes increases (Figure 10). In addition, toroids co-exist with fibrous features. It is observed that after 1 h (data not shown), the polyplexes have begun to break apart and about 30% of the original polyplexes remain on the surface, much less compared to films disassembled in 0.1 M NaCl. Between 2–4 h, a few globules remain on the surface and after 6 h unraveling of larger globules can be observed (Figure 10b–c). This coil-globule process has been shown to occur with DNA and stiff polyelectrolyte chains in the presence of an excess of multivalent ions.(49) The total disassembly of the films takes about 6 h, 4 h less than the films disassembled in 0.1 M NaCl. In Figure 10d, the RHB/DNA layers of the RHB/DNA/polyplex films can be seen after 4 h of disassembly. Fibrous bundles are adsorbed on the surface and toroids are formed on top of these fibrous bundles. The polyplexes are released more quickly than the middle naked DNA layer. The incorporation of both condensed and uncondensed DNA in the LbL film assembly thus provides a simple means to modulate the DNA release timing from different layers.
Figure 10.

Time-lapse AFM images of the RHB/DNA/polyplex film in 20 mM DTT and 0.4 M NaCl. a) 2 h (Rq= 1.43 nm). b) 4 h (Rq= 1.55 nm). c) 6 h (Rq= 1.30 nm). The scan size for (a) and (b) is 4 μm and for (c) is 1.5 μm. The z-range is 15 nm. d) Background of (b) scanned at 0.8×0.8 μm2 (Rq=1.23 nm). e) The cross-sectional height profile of (c) along the dashed line.
The salt effect observed can be understood based on ionic screening. Ions screen the electrostatic interaction and lead to a decrease in the number of ionic bonds within the interpolyelectrolyte complex, which results in the complete dissociation of polyelectrolyte pairs.(50) The addition of salt first causes shrinkage in the polyplex volume due to ionic screening of the polyplex charges. More salt leads to precipitation of completely complexed species due to removal of excess polyions. Still more salt leads to the dissolution of precipitate and dissociation of polyelectrolytes.(37,38,51) Our observation that salt accelerates the LbL film disassembly is largely consistent with the known salt effect.
CONCLUSIONS
The study demonstrates the release of DNA from bioreducible LbL films under simulated physiologic reducing conditions. The bioreducible LbL films provide an ideal system to study DNA release dynamics from thin films and coatings suitable for localized gene delivery. Hyperbranched poly(amido amines) containing the bioreducible disulfide bond represents the next generation of polymeric gene carriers in overcoming the cytotoxicity problem of the first generation carriers such as polyethylenimine and poly(l-lysine). Two types of DNA layers are constructed and compared. One layer contains adsorbed single DNA molecules and the other layer contains adsorbed polyplexes of the DNA and RHB. It is determined that the DNA release rate can be modulated by salt concentration with higher salt concentration favoring faster DNA release. The DNA structure prior to its release is predominantly the bundled structure in the single DNA molecular layer and the toroid structure in the polyplex layer. This work provides a simple means to modulate DNA release dynamics by incorporating the two types of DNA layers. The polyplex layer will allow faster DNA delivery with the released DNA likely retained in its condensed and non-aggregated state. The naked DNA layer will allow slower DNA delivery and the released DNA is more likely in an uncondensed aggregated state. This study also revealed the capability of an immobilized RHB monolayer to condense DNA. Here, we find an unique capability that is attributed to the hyperbranched structure of the poly(amido amine) polycation.
Supplementary Material
ACKNOWLEDGMENT
The authors acknowledge partial support from the National Institutes of Health (CA 109711) to D.O. and the National Science Foundation (CBET-0553533, CBET-0619528, and CBET-0755654) to G.M. as well as a National Science Foundation International Research and Education in Engineering supplement to G. M. to support J.B. travel to conduct the FITR experiments at the Max Planck Institute of Colloids and Interfaces. We thank Dr. Yezi You for the synthesis of the polycations and the laboratory of Dr. Ashis Mukhopadhyay for the use of ellipsometry.
References
- (1).Sarkar T, Conwell CC, Harvey LC, Santai CT, Hud NV. Nucleic Acids Res. 2005;33:143–51. doi: 10.1093/nar/gki156. [DOI] [PMC free article] [PubMed] [Google Scholar]
- (2).Dias N, Stein CA. Mol. Cancer. Ther. 2002;1:347–55. [PubMed] [Google Scholar]
- (3).Garcia-Chaumont C, Seksek O, Grzybowska J, Borowski E, Bolard J. Pharmacol. Ther. 2000;87:255–77. doi: 10.1016/s0163-7258(00)00062-0. [DOI] [PubMed] [Google Scholar]
- (4).Zhang JT, Lynn DM. Adv. Mater. 2007;19:4218–4223. [Google Scholar]
- (5).Dimitrova M, Arntz Y, Lavalle P, Meyer F, Wolf M, Schuster C, Haikel Y, Voegel JC, Ogier J. Adv. Funct. Mater. 2007;17:233–245. [Google Scholar]
- (6).Meyer F, Ball V, Schaaf P, Voegel JC, Ogier J. Biochim. Biophys. Acta, Biomembr. 2006;1758:419–422. doi: 10.1016/j.bbamem.2005.11.015. [DOI] [PubMed] [Google Scholar]
- (7).Jewell CM, Zhang JT, Fredin NJ, Lynn DM. J. Controlled Release. 2005;106:214–223. doi: 10.1016/j.jconrel.2005.04.014. [DOI] [PubMed] [Google Scholar]
- (8).De Geest BG, Sanders NN, Sukhorukov GB, Demeester J, De Smedt SC. Chem. Soc. Rev. 2007;36:636–649. doi: 10.1039/b600460c. [DOI] [PubMed] [Google Scholar]
- (9).Zhang C, van der Maarel JRC. J. Phys. Chem. B. 2008;112:3552–3557. doi: 10.1021/jp0776560. [DOI] [PubMed] [Google Scholar]
- (10).Verbaan FJ, Oussoren C, van Dam IM, Takakura Y, Hashida M, Crommelin DJA, Hennink WE, Storm G. Int. J. Pharm. 2001;214:99–101. doi: 10.1016/s0378-5173(00)00642-6. [DOI] [PubMed] [Google Scholar]
- (11).Blacklock J, You YZ, Zhou QH, Mao G, Oupicky D. Biomaterials. 2009;30:939–50. doi: 10.1016/j.biomaterials.2008.10.012. [DOI] [PMC free article] [PubMed] [Google Scholar]
- (12).Kichler A, Remy JS, Boussif O, Frisch B, Boeckler C, Behr JP, Schuber F. Biochem. Biophys. Res. Commun. 1995;209:444–450. doi: 10.1006/bbrc.1995.1522. [DOI] [PubMed] [Google Scholar]
- (13).Christensen LV, Chang CW, Kim WJ, Kim SW, Zhong Z, Lin C, Engbersen JF, Feijen J. Bioconjugate Chem. 2006;17:1233–40. doi: 10.1021/bc0602026. [DOI] [PubMed] [Google Scholar]
- (14).Lin C, Zhong Z, Lok MC, Jiang X, Hennink WE, Feijen J, Engbersen JF. J. Controlled Release. 2006;116:130–7. doi: 10.1016/j.jconrel.2006.09.009. [DOI] [PubMed] [Google Scholar]
- (15).Hoon Jeong J, Christensen LV, Yockman JW, Zhong Z, Engbersen JF, Jong Kim W, Feijen J, Wan Kim S. Biomaterials. 2007;28:1912–7. doi: 10.1016/j.biomaterials.2006.12.019. [DOI] [PubMed] [Google Scholar]
- (16).Blacklock J, Handa H, Soundara Manickam D, Mao G, Mukhopadhyay A, Oupicky D. Biomaterials. 2007;28:117–24. doi: 10.1016/j.biomaterials.2006.08.035. [DOI] [PubMed] [Google Scholar]
- (17).Jeong JH, Christensen LV, Yockman JW, Zhong ZY, Engbersen JFJ, Kim WJ, Feijen J, Kim SW. Biomaterials. 2007;28:1912–1917. doi: 10.1016/j.biomaterials.2006.12.019. [DOI] [PubMed] [Google Scholar]
- (18).Lin C, Zhong ZY, Lok MC, Jiang XL, Hennink WE, Feijen J, Engbersen JFJ. J. Controlled Release. 2006;116:130–137. doi: 10.1016/j.jconrel.2006.09.009. [DOI] [PubMed] [Google Scholar]
- (19).Wan L, Manickam DS, Oupicky D, Mao G. Langmuir. 2008;24:12474–82. doi: 10.1021/la802088y. [DOI] [PMC free article] [PubMed] [Google Scholar]
- (20).Wan L, You Y, Zou Y, Oupicky D, Mao GZ. J. Phys. Chem. B. 2009;113:13735–13741. doi: 10.1021/jp901835u. [DOI] [PMC free article] [PubMed] [Google Scholar]
- (21).Kern W. J. Electrochem. Soc. 1990;137:1887–1892. [Google Scholar]
- (22).Wu B, Mao GZ, Ng KYS. Colloids Surf., A. 2000;162:203–213. [Google Scholar]
- (23).Felgner PL, Barenholz Y, Behr JP, Cheng SH, Cullis P, Huang L, Jessee JA, Seymour L, Szoka F, Thierry AR, Wagner E, Wu G. Hum. Gene Ther. 1997;8:511–512. doi: 10.1089/hum.1997.8.5-511. [DOI] [PubMed] [Google Scholar]
- (24).Chen J, Wu C, Oupicky D. Biomacromolecules. 2009;10:2921–2927. doi: 10.1021/bm900724c. [DOI] [PMC free article] [PubMed] [Google Scholar]
- (25).Kjaer K, Als-Neilsen J, Heln CA, Tippmann-Krayer P, Möhwald H. Thin Solid Films. 1988;159:17–28. [Google Scholar]
- (26).Tolan M, Seeck OH, Wang J, Sinha SK, Rafailovich MH, Sokolov J. Phys. B. 2000;283:22–26. [Google Scholar]
- (27).Englisch U, Katholy S, Peñacorada F, Reiche J, Pietsch U. Mater. Sci. Eng., C. 1999;8-9:99–102. [Google Scholar]
- (28).Stömmer R, Martin AR, Hub W, Göbel H, Pietsch U. Microelectron. Eng. 1999;45:257–263. [Google Scholar]
- (29).Englisch U, Peñacorada F, Samoilenko I, Pietsch U. Phys. B. 1998;248:258–262. [Google Scholar]
- (30).Filies O, Böling O, Grewer K, Lekki J, Lekka M, Stachura Z, Cleff B. Appl. Surf. Sci. 1999;141:357–365. [Google Scholar]
- (31).Manickam DS, Bisht HS, Wan L, Mao GZ, Oupicky D. J. Controlled Release. 2005;102:293–306. doi: 10.1016/j.jconrel.2004.09.018. [DOI] [PubMed] [Google Scholar]
- (32).Gosule LC, Schellman JA. Nature. 1976;259:333–335. doi: 10.1038/259333a0. [DOI] [PubMed] [Google Scholar]
- (33).Arscott PG, Li AZ, Bloomfield VA. Biopolymers. 1990;30:619–630. doi: 10.1002/bip.360300514. [DOI] [PubMed] [Google Scholar]
- (34).Manning GS. Q. Rev. Biophys. 1977;11:179–246. doi: 10.1017/s0033583500002031. [DOI] [PubMed] [Google Scholar]
- (35).Rouzina I, Bloomfield VA. Biophys. Chem. 1997;64:139–155. doi: 10.1016/s0301-4622(96)02231-4. [DOI] [PubMed] [Google Scholar]
- (36).Matulis D, Rouzina I, Bloomfield VA. J. Mol. Biol. 2000;296:1053–1063. doi: 10.1006/jmbi.1999.3470. [DOI] [PubMed] [Google Scholar]
- (37).Kabanov VA. In: Macromolecular Complexes in Chemistry and Biology. Dubin P, Bock J, Davies RM, Schulz DN, Thies C, editors. Springer Verlag; Berlin: 1994. p. 151. [Google Scholar]
- (38).Tsuchida E, Abe K. Adv. Polym. Sci. 1982;45:1–119. [Google Scholar]
- (39).Allen MJ, Bradbury EM, Balhorn R. Nucl. Acids Res. 1997;25:2221–2226. doi: 10.1093/nar/25.11.2221. [DOI] [PMC free article] [PubMed] [Google Scholar]
- (40).Fang Y, Hoh JH. Nucl. Acids Res. 1998;26:588–593. doi: 10.1093/nar/26.2.588. [DOI] [PMC free article] [PubMed] [Google Scholar]
- (41).Dauty E, Remy JS, Blessing T, Behr JP. J. Am. Chem. Soc. 2001;123:9227–34. doi: 10.1021/ja015867r. [DOI] [PubMed] [Google Scholar]
- (42).Kuwajima K, Ikeguchi M, Sugawara T, Hiraoka Y, Sugai S. Biochemistry. 1990;29:8240–9. doi: 10.1021/bi00488a007. [DOI] [PubMed] [Google Scholar]
- (43).Wiita AP, Ainavarapu SR, Huang HH, Fernandez JM. Proc. Natl. Acad. Sci. U S A. 2006;103:7222–7. doi: 10.1073/pnas.0511035103. [DOI] [PMC free article] [PubMed] [Google Scholar]
- (44).Dunlap DD, Maggi A, Soria MR, Monaco L. Nucl. Acids Res. 1997;25:3095–3101. doi: 10.1093/nar/25.15.3095. [DOI] [PMC free article] [PubMed] [Google Scholar]
- (45).Iwataki T, Kidoaki S, Sakaue T, Yoshikawa K, Abramchuk SS. J. Chem. Phys. 2004;120:4004–4011. doi: 10.1063/1.1642610. [DOI] [PubMed] [Google Scholar]
- (46).Ono MY, Spain EM. J. Am. Chem. Soc. 1999;121:7330–7334. [Google Scholar]
- (47).Suwalsky M, Traub W, Shmueli U, Subriana JA. J. Mol. Biol. 1968;42:363. doi: 10.1016/0022-2836(69)90049-7. [DOI] [PubMed] [Google Scholar]
- (48).Bottcher C, Endisch C, Fuhrhop JH, Catterall C, Eaton M. J. Am. Chem. Soc. 1998;120:12–17. [Google Scholar]
- (49).Sarraguca JMG, Dias RS, Pias AACC. J. Biol. Phys. 2006;32:421–434. doi: 10.1007/s10867-006-9026-8. [DOI] [PMC free article] [PubMed] [Google Scholar]
- (50).Izumrudov VA, Zhiryakova MV. Macromol. Chem. Phys. 1999;200:2533–2540. [Google Scholar]
- (51).Pergushov DV, Izumrudov VA, Zezin AB, Kabanov VA. Vysokomolekulyarnye Soedineniya Seriya a & Seriya B. 1993;35:A844–A849. [Google Scholar]
Associated Data
This section collects any data citations, data availability statements, or supplementary materials included in this article.