

Abstract
Cigarette-smoking increases the risk of developing various types of human cancers including esophageal cancers. To test the effects of chronic cigarette smoke exposure directly on esophageal epithelium, cellular resistance to mainstream extract (MSE) or sidestream smoke extract (SSE) was developed in chronically exposed non-malignant Het-1A cells. Anchorage-independent growth, in vitro invasion capacity, and proliferation of the resistant cells increased compared to the unexposed, sensitive cells. An epithelial marker E-cadherin was down-regulated and mesenchymal markers N-cadherin and vimentin were up-regulated in the resistant cells. Het-1A cells resistant to MSE or SSE consumed more glucose, and produced more lactate than the sensitive cells. The increased anchorage-independent cell growth of the resistant cells was suppressed by a glycolysis inhibitor, 2-deoxy-D-glucose, indicating that these cells are highly dependent on the glycolytic pathway for survival. Decreased mitochondrial membrane potential and ATP production in the resistant cells indicate the presence of mitochondrial dysfunction induced by chronic exposure of CSE. Increased expression of nuclear genes in the glycolytic pathway and decreased levels of mitochondrial genes in the resistant cells support the notion that cigarette smoking significantly contributes to the transformation of non-malignant esophageal epithelial cells into a tumorigenic phenotype.
Keywords: cigarette smoke extract, esophageal cancer, glycolysis
Introduction
Cancer of the esophagus is the eighth most common malignancy and ranks as the sixth most frequent cause of cancer death worldwide.1 Frequency of different histologic types of esophageal carcinoma varies, but throughout the world, squamous cell carcinoma is the most predominant type. Esophageal squamous cell carcinoma (ESCC) is often diagnosed at an advanced stage and is generally associated with a poor prognosis.2 There is considerable epidemiological evidence suggesting that alcohol, tobacco, diets deficient in vitamins/protective antioxidants, carcinogens, and thermal injuries are important in the pathogenesis of ESCC.3,4 Among all these, cigarette smoke is a key factor in esophageal carcinogenesis.5
There are primarily two types of cigarette smoke: first-hand and second-hand smoke. Mainstream cigarette smoke (MS) mimics ‘first-hand’ smoke (inhaled by the smoker), and sidestream cigarette smoke (SS) mimics ‘second-hand’ smoke (inhaled by non-smokers in places where smoking is allowed). These two types of smoke have qualitatively the same composition except that in second-hand smoke many components are more concentrated than in first-hand smoke and compounds in SS are generated in a more reducing environment than those in MS.6 Most of the cigarette smoke carcinogens are initiators and promoters of carcinogenesis in many organs such as the lung, stomach, liver, and colon.7 Cigarette smoke extract (CSE) is used as a surrogate for cigarette smoke carcinogens. It contains most of the particulate chemicals identified in cigarette smoke,8,9,10 and is a highly genotoxic substance capable of causing various types of DNA damage in different biological systems.11 Most previous in vitro studies on tobacco-related carcinogenesis have been focused on transformation of pre-malignant cells.11,12,13,14,15,16 or apoptosis of pre-malignant and/or cancer cells15,17,18 by cigarette smoke condensate (CSC) which is mainstream cigarette smoke extract (MSE) prepared in dimethyl sulfoxide (DMSO). Recently, transformation of an immortalized normal breast epithelial cell line, MCF10A, to a malignant phenotype by CSC treatment was reported.12 However, the cellular and molecular mechanisms underlying cigarette smoking-related human esophageal carcinogenesis remains be elucidated.
As predicted by Warburg, the capacity to sustain high rates of glycolysis under aerobic conditions appears to be an important feature of rapidly growing tumors, and impaired mitochondrial oxidative function may be a factor in increased glucose utilization of tumor cells.19 Glycolysis can generate ATP and provides compensatory mechanisms when oxidative phosphorylation becomes inefficient because of defects in the respiratory chain. The metabolic switch, aerobic degradation of glucose even in the presence of oxygen was demonstrated by the identification of increased proteins involved in the majority of steps in the glycolytic pathway and of decreased proteins in the gluconeogenic reactions, together with a parallel decrease in several mitochondrial enzymes.20 Upregulation of glucose turn-over via the pentose phosphate pathway leads to enhanced expression of HIF-1α21 G6PD21,22, p-Akt23, LDH22 and carbonic anhydrase enzyme activity.24 All of these are also biological markers that generally correlate with poor prognosis in cancer.
Alteration in the bioenergetic phenotype, which results in dysfunctional mitochondria in mammalian cells, is a hallmark of many solid tumors including breast, gastric, lung and esophageal cancers.25 A functional decrease in mitochondrial respiratory function defined as disrupted mitochondrial membrane potential (Δψm) due to suppressed respiration and low cellular ATP levels correlates with increased invasiveness of cancer.26,27 A few reports on associations between cigarette smoking and mitochondrial alterations in human cancer have been recently published; these included increased mitochondrial DNA abnormalities,28 promotion of functional cooperation of Bcl-2 and c-Myc,29 and phosphorylation of Bad by tobacco smoking or tobacco-components.30 However, the role of cigarette smoking in mitochondrial dysfunction, and correlations between cigarette smoking and aerobic glycolysis in carcinogenesis still remains elusive.
The purpose of this study was to investigate the role of cigarette smoke in esophageal carcinogenesis and to begin to unravel the underlying mechanisms. We prepared MSE and sidestream cigarette smoke extract (SSE) simultaneously using two separate smoking machines, and exposed a non-malignant esophageal epithelial cell line, Het-1A, to MSE or SSE until the cells acquired resistance to MSE or SSE. Our results revealed transformed phenotypes in esophageal epithelial cells chronically exposed to CSE (MSE or SSE), and a shift to dependence on glycolytic metabolism from mitochondria in the CSE-transformed cells.
Materials and Methods
Materials
Seven ESCC cell lines (TE1, TE2, TE4, KYSE70, KYSE140, KYSE150, and KYSE410) were obtained from the Cell Response Center for Biomedical Research Institute, Department of Aging and Cancer, Tohoku University (TE series) and kindly provided by Dr. Shimada in the Department of Surgery, Kyoto University (KYSE series). Cells were grown in RPMI 1640 supplemented with 10% FBS. An immortalized, non-tumorigenic esophageal epithelial cell line, Het-1A, was purchased from ATCC and grown in BEGM (Lonza Group Ltd, Basel, Switzerland) as recommended. Cell passage number was counted from the first cell propagation (+1) upon arrival from ATCC. 2-deoxy-D-glucose (2-DG), a glycolysis inhibitor, was purchased from Sigma-Aldrich (Saint Louis, MO). Matrigel was purchased from BD Biosciences (San Jose, CA).
Preparation of CSE
Mainstream (MSE) and sidestream smoke extracts (SSE) were made from research-grade cigarettes (2R4F, from Tobacco Health Research, University of Kentucky, contains nicotine: 0.85 mg/cigarette and tar: 9.70 mg/cigarette) (Louisville, KY). Sidestream smoke was collected from the burning end of the cigarettes without puffing at a rate of 200 ml/min and mainstream smoke with 35 ml/min puff per 2 seconds from the opposite end using two smoking machines (MasterFlex Pump Systems, Cole-Parmer Instrument, Vernon Hills, IL) (Supplemental Fig. 1). Briefly, the smoke of twenty cigarettes for MSE and forty cigarettes for SSE was bubbled into each flask containing 20 mL of pre-warmed PBS. The aqueous smoke extract was filtered through 0.22-µm pore syringe filter to remove large particles. The smoke bubbled into MSE flask was acidic (yellow in color) and that into SSE flask basic (pink), so the pH of each solution was adjusted to 7.4. The solution was aliquot and kept frozen at −80°C until use. Since a small faction of sidestream smoke was leaky from the collecting glass funnel during cigarette burning, a small variance in the concentrations of SSE was observed during repeated extraction procedure. Therefore, the concentration of SSE was determined spectrophotometrically, and an absorbance of 1 at 230 nm was considered 100% as described.31 More cigarettes were burn when the absorbance was below 1. Since there is no standardized way to express the quantity of MSE, the concentration of MSE solution prepared described in this study was considered 100%.
Establishment of CSE-resistant cells
Parental Het-1A cells at the passage +6 were exposed to various concentrations of MSE or SSE (0 ~ 20%) for 48 hrs and MTT assay was performed to determine subtoxic concentrations of each CSE. About 30% of growth inhibition (IC30) for MSE and for SSE was observed at 0.2% and 0.5%, respectively (Fig. 2A). Therefore, Het-1A cells were treated with 0.2% MSE or 0.5% SSE once a day. When as many as 50% of the cells lost adherence or died, or when more than 50% cells developed significant morphological changes, such as a bizarre appearance or giant cytosolic vacuoles, the treatment was discontinued, and cell culture medium was replaced with fresh growth medium to remove cells losing adherence and to allow cells in attachment to grow until cell subcultures regained a regular 70% confluent density of less affected cells (usually two or three days needed). This process was repeated in subsequent cell culture passages until exponentially growing, resistant cells to MSE or SSE occurred. Cells at the passage up to +31 were applied for this study.
Figure 2.
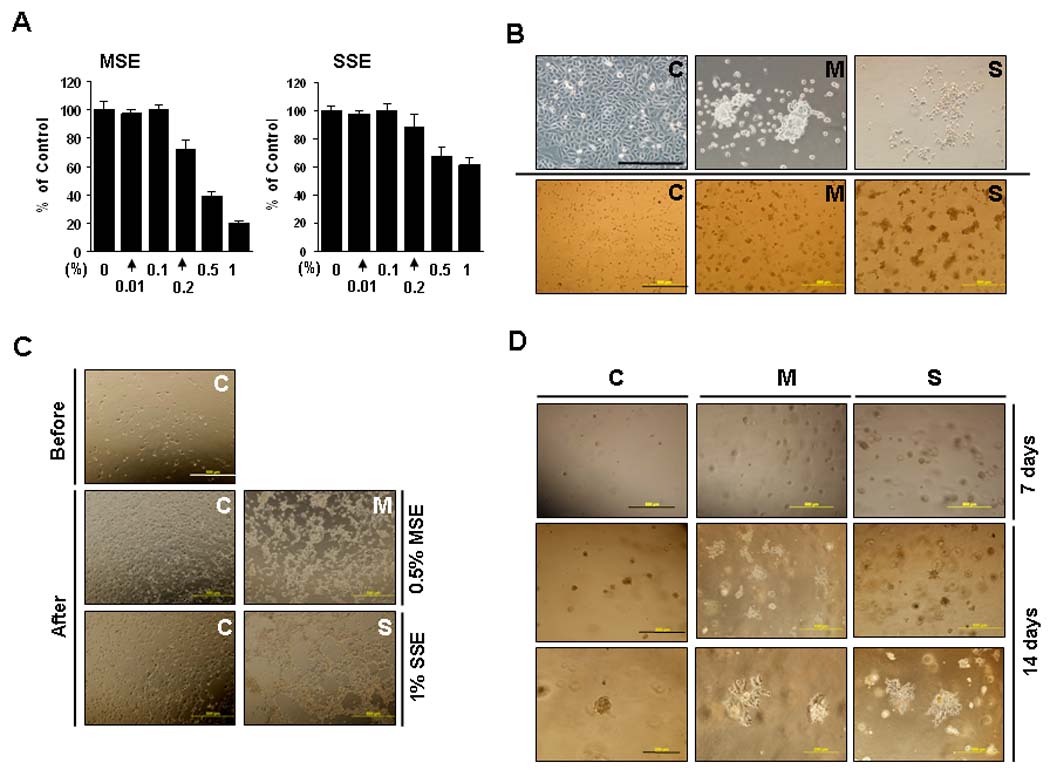
Morphologic changes after CSE treatment. A, To determine subtoxic concentrations, Het-1A cells at passage +6 were exposed to 0 ~ 20% of MSE or SSE for 48 hrs, and the MTT assay was performed. About 30% of growth inhibition (IC30) for MSE and SSE was observed at 0.2% and 0.5%, respectively. B, Het-1A cells at passage +11 exposed to MSE (M) or SSE (S) for one and half months and control cells without exposure (C) were grown on glass slides for 72 hr (upper) or on Matrigel beds for 48 hrs (lower). Cell pictures were taken under a phase-contrast microscope. Scale bar, 200 µm (upper) and 500 µm (lower). C, Cells on Matrigel beds were treated with 0.5% MSE or 1% SSE for 24 hrs and incubated for further 48 hrs in fresh medium in the absence of the treatment (After). Control-Het-1A cells are shown before CSE treatment (Before). Scale bar, 500 µm. D, Cell suspensions were mixed with Matrigel (1: 1 ratio), and incubated for 7 (upper) and 14 days (middle and lower). Scale bar, 500 µm (upper and middle) and 200 µm (lower).
MTT assay
Cells were plated on a 96-well plate at a density of 2 × 10⁴ cells/well and incubated overnight at 37°C. Cells were incubated for indicated time, and the tetrazolium-based cell viability (MTT) assay was performed. The results were expressed as absorbance at 570 nm or a percentage of MTT reduction in samples compared to control (100%).
Annexin-V analysis
Apoptosis was quantified using the Annexin V-FITC apoptosis kit (BD Biosciences, San Diego, CA) in accordance with the manufacturer's instructions. Briefly, cells were trypsinized, pelleted by centrifugation, and resuspended in Annexin V–binding buffer (150 mmol/L NaCl, 18 mmol/L CaCl2, 10 mmol/L HEPES, 5 mmol/L KCl, 1 mmol/L MgCl2). FITC-conjugated Annexin V and 7-amino-actinomycin D dye (7-AAD) were added to cells and incubated for 30 min at room temperature in the dark. Labeled cells were detected by flow cytometry and analyzed with CellQuest software (Becton Dickinson, Mountain View, CA).
Soft agar assay
Cells (5 × 10⁴/well of 6-well plates) were seeded in 1 ml of 0.3% low-melting agarose over a 0.6% agar bottom layer in BEGM complete medium. The medium was changed three times a week and the clones were allowed to grow for three weeks. Two independent experiments were performed and each experiment was done in triplicate. 2-DG (1 mg/ml) was treated three times a week for three weeks. The growth of colonies was observed under an inverted microscope (Zeiss Axioplan-2 Imaging; Thornwood, NY, USA).
Chemoinvasion assay
Cells were seeded at a density of 5 × 10³/well in transwell chamber (Lowell, MA) previously coated with Matrigel (upper part) and type I collagen (lower part). Cells were incubated for 16 hrs. A total of 10 sites per membrane were randomly selected for cell counting. Simultaneously, equal number of cells was seeded on 24-well plates, incubated for 16 hrs, and MTT assay was performed.
Glucose consumption and lactate production
Cells were seeded at a density of 5 × 10⁴/well and incubated for 16 hrs. Culture medium was then re-supplemented with fresh, growth medium and incubated for 4 hrs. The culture medium was then collected, and filtered through a 0.22 µm pore membrane. Glucose and lactate levels were measured using glucose and lactate assay kits as manufacturer’s instructions (Biovision, Exton, PA). Glucose consumption was determined from the difference in glucose concentration compared with control. MTT assay was performed for verifying equal number of cells.
Total cellular oxygen consumption and ATP production
Equal numbers of cells (3 × 10⁶) were suspended in 600 µl of growth medium and transferred into the chamber of an Oxytherm electrode unit (Hansatech Instrument Ltd.), which uses a Clark-type electrode to monitor the dissolved oxygen concentration in the sealed chamber over time. The data were exported to a computerized chart recorder (Oxygraph, Hansatech Instrument Ltd.), which calculates the rate of O2 consumption (nmole/min/107). The temperature was maintained at 37°C during the measurement. Intracellular ATP levels were measured for an equal number of cells (2 ×10⁵) using an ATP assay kit (Sigma) according to the manufacturer's instructions. After addition of the assay mixture containing luciferin and luciferase, luminescence was measured immediately using a Wallace microplate luminescence reader (Perkin Elmer, Waltham, MA). Results are presented as arbitrary fold.
Mitochondrial membrane potential (Δψm)
Fluorescence imaging was performed by staining mitochondria with the membrane potential sensitive dye JC-1 (Invitrogen). After incubation with JC-1 for 30 min at room temperature, mitochondria were washed to remove excess dye by a gentle centrifugation step (3 min at 2000 × g). For measuring the mitochondrial membrane potential (Δψm), fluorescence was acquired by flow cytometry; Green fluorescence (JC-1 monomers) at FL1-H channel and red fluorescence (J-aggregates) at FL2-H channel.
Reactive Oxygen Species
The level of ROS in cells was measured using 5-(and-6)-chloromethyl-2',7'-dichlorodihydrofluorescein diacetate, acetyl ester (DCDHF-DA) (Invitrogen). In brief, cells were incubated with 2.5 µM DCDHF-DA for 30 min at 37°C. After trypsinization, single cell suspensions were subjected to flow cytometry. As an alternative, cells in culture plate were assayed using a fluorescence microplate reader and fluorescence was acquired at 495/525 (ex/em).
Quantitative RT-PCR in cell lines
To determine gene expression of NRF-2, Co II, Co VIc and c-Myc, the real-time RT-PCR was performed using QuantiFast SYBR Green PCR Kit (Promega, Valencia, CA) as described previously.32 Gene expression relative to control gene (β-actin) was calculated based on the threshold cycle (Ct) as 2−Δ(ΔCt), where ΔCt = Ct,Gene − Ct,β-actin and Δ(ΔCt) = ΔCt,M (or S) − ΔCt,C (C, control-Het-1A, M (or S), MSE (or SSE)-Het-1A). Primer sequences are 5’-CATTGTGACCATGCCAGATG-3’ (NRF-2 forward), 5’-GTAGGCCTCTGCTTCCTGTTC-3’ (NRF-2 reverse), 5’-GCCAGGGGAGCTACGACTAT-3 ’ (Co II forward) , 5 ’-CGCAAATTTCTGAGCATTGA-3’ (Co II reverse), 5’- GCTTTGGCAAAACCTCAGAT -3 ’ ( Co VIc forward) , 5 ’-ACCAGCCTTCCTCATCTCCT -3 ’ (Co VIc reverse) , 5 ’-CTCCTCACAGCCCGTTAGTC -3 ’ (c-Myc forward), 5’-CGCCTCTTGTCATTCTCCTC -3’ (c-Myc reverse).
For expression of MT-ATP6, PDH, and MMP-7, real-time RT-PCR was performed using 2X Master Mix and TaqMan pre-designed primers and probes purchased from Applied Biosystems as manufacturer’s instructions (Foster City, CA). mRNA expression of each gene relative to control genes (β-actin) was calculated.
Western blot analyses
Whole cell lysates extracted in RIPA buffer were separated on 4–12% gradient SDS-PAGE and transferred to nitrocellulose membrane. The blots were incubated with specific antibodies for each gene for 2 h at room temperature or 4°C overnight. After antibody washing, the blots were reacted with their respective secondary antibody and detected with enhanced chemiluminescence reagents (Amersham, Pittsburgh, PA) according to the supplier’s protocol. All antibodies were purchased from Cell Signaling Technologies (Beverly, MA) except for the anti-vimentin (BD Pharmingen, San Jose, CA), anti-PK-M2 (Abnova, Walnut, CA), anti-PDK1 (Stressgen, British Colombis, Canada), anti-PFK (Abcam, Cambridge, MA ), and anti-β-actin (Sigma, St. Louis, MO) antibodies.
Results
ESCC cell lines are resistant to MSE and SSE exposure
To examine cell growth after exposure to CSE, malignant and non-malignant cells were treated with various concentrations of MSE for 24 hrs. Over 80% cell survival at 1% MSE treatment was observed in all ESCC cell lines tested, but most non-malignant Het-1A cells died within 24 hrs of 1% MSE treatment (data not shown). Fifty % of cells died at 2.5% MSE treatment in KYSE70, at 10% in KYSE150, and at 2.5% in KYSE410, whereas 50% of Het-1A cells died at 0.5% MSE treatment (Fig. 1A). Cell growth was then examined after exposure of cells to MSE for 3 days. Cell growth of KYSE70 and KYSE150 was delayed by the treatment with 0.5% MSE, but they were still growing for 72 hrs of the treatment (Fig. 1B). However, 0.5% MSE was cytotoxic on Het-1A cells within 24 hrs of treatment. To assess the apoptotic cell population, we exposed cells to MSE (0 ~ 1%) for 48 hrs, and performed flow cytometric analysis after staining the cells with Annexin V-FITC and 7-AAD, and calculated the sum of cell population in the bottom right (LR, early stage of apoptosis) and the top right quadrants (UR, late stage of apoptosis). As shown in Table 1, the dead cell population was 36 % in Het-1A cells (passage +8), but was less than 20% in KYSE70 and 13% in KYSE150 cells after exposure of cells to 0.5% MSE. These results indicate that ESCC cells were resistant to MSE-induced apoptosis relative to normal esophageal epithelial cells.
Figure 1. Cell growth after CSE treatment.
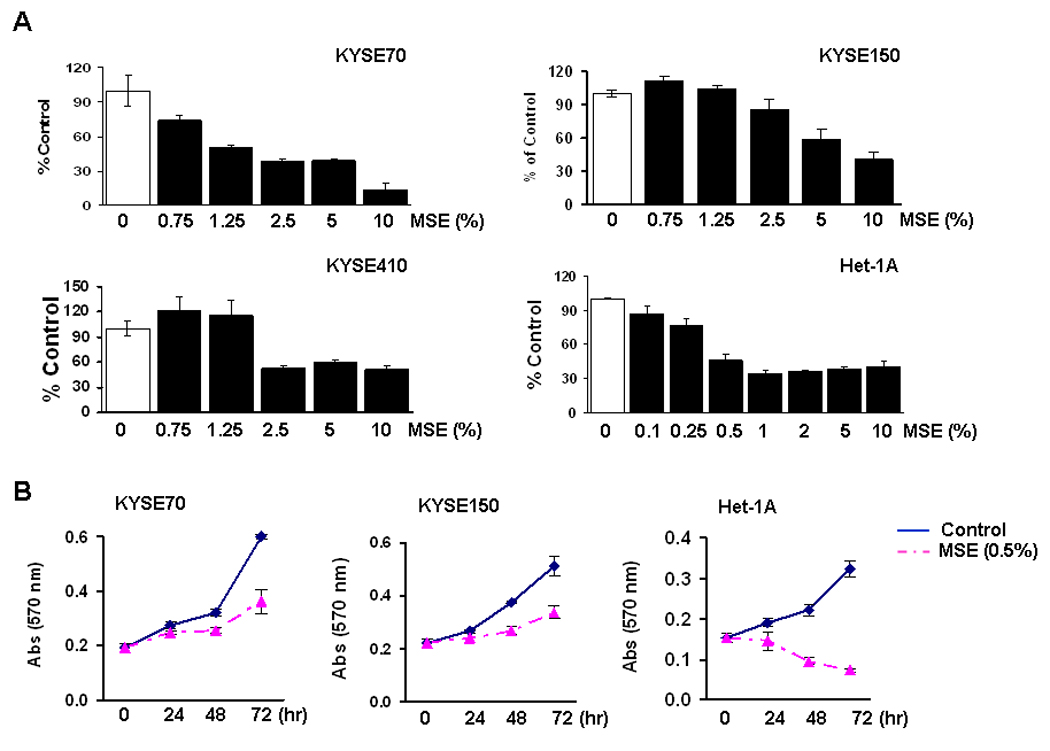
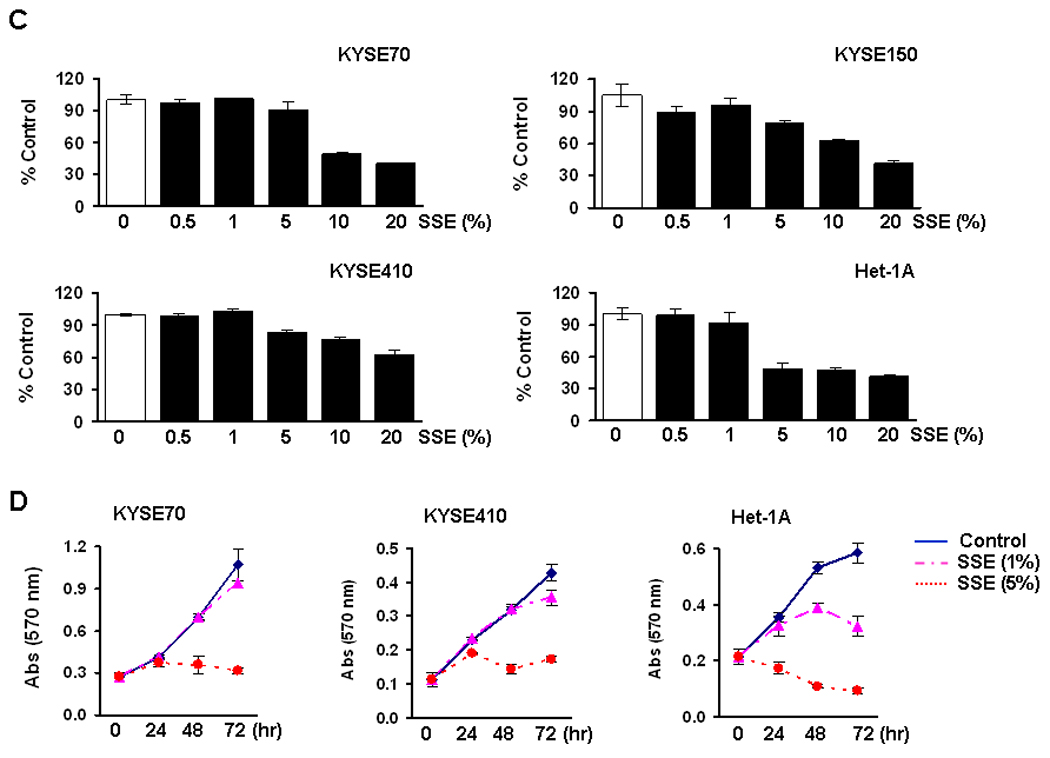
A, KYSE70, KYSE150, KYSE410 cells and an immortalized non-tumorigenic esophageal epithelial cell line (Het-1A, the passage +9) were seeded at a density of 2 × 10⁴/well in 96-well plates, and the MTT assay was performed 24 hrs after treatment with various concentration of MSE (0 ~ 10%). All ESCC cell lines tested showed over 80% viability at 1% MSE treatment (data not shown). %, cell viability compared to control without MSE treatment (100%). Experiments were repeated twice in triplicate, and values indicate means ± SD. B, Cells were seeded at a density of 2 × 10⁴/well in 24-well plates, and the MTT assay was performed 24, 48, and 72 hrs after treatment with 0.5% MSE. Cell growth of Het-1A cells at passage +10 was compared with ESCC cell lines. Data are expressed as absorbance at 570 nm and values indicate means ± SD. C, Cells were exposed to 0 ~ 20% SSE for 24 hrs, and the MTT assay was performed. %, cell viability compared to control without SSE treatment (100%). D, Cells were exposed to 1% and 5% SSE, and the MTT assay was performed 24, 48, and 72 hrs after treatment. Data are expressed as absorbance at 570 nm and values indicate means ± SD.
Table 1.
Flow cytometric analysis in cells treated with MSE
| Cell | MSE (%) | Cell population (%) |
|---|---|---|
| KYSE70 | 0 | 0.97 ± 1.05 |
| 0.1 | 14.74 ± 3.41 | |
| 0.5 | 19.12 ± 2.85 | |
| 1 | 20.66 ± 2.71 | |
| KYSE150 | 0 | 1.37 ± 1.05 |
| 0.1 | 11.53 ± 3.43 | |
| 0.5 | 12.59 ± 4.53 | |
| 1 | 21.87 ± 2.66 | |
| Het-1A | 0 | 3.81 ± 1.65 |
| 0.1 | 17.37 ± 4.28 | |
| 0.5 | 36.45 ± 6.80 | |
| 1 | 43.12 ± 8.75 |
Note, Values (%) were calculated from the sum of cell population in the bottom right (LR) and the top right quadrants (UR).
ESCC cell lines and Het-1A cells were also exposed to 0 ~ 20% SSE for 24 hrs. As observed in MSE treatment, cellular resistance to SSE treatment was observed in KYSE70, KYSE150, and KYSE410 cells; more than 50% of ESCC cells survived at 10% SSE treatment whereas 50% of Het-1A cells died at 5% SSE treatment (Fig. 1C). When cells were exposed to 1% SSE for 72 hrs, cell growth of KYSE70 and KYSE410 showed little difference compared to untreated control cells whereas that of Het-1A cells was clearly delayed (Fig. 1D). Five % SSE treatment for 72 hrs inhibited cell growth of KYSE70 and KYSE410 but was cytotoxic on Het-1A cells.
Het-1A cells chronically exposed to CSE are resistant to MSE or SSE
The resistance of ESCC cell lines to MSE treatment might be due to successful cell survival through selection of resistant cells during malignant transformation of esophageal epithelial cells by cigarette smoke exposure. To assess transformation by cigarette smoke during esophageal carcinogenesis, the human esophageal epithelial cell line, Het-1A, was chronically exposed to 0.2% MSE or 0.5% SSE for up to 6 months (Fig. 2A and a description in Methods).
To examine morphologic difference before resistance development, cells exposed to MSE or SSE for one and half months were grown on glass slides for 72 hrs. As shown in Figure 2B (upper), control-Het-1A cells (C) grew in monolayer whereas cells exposed to MSE (M, MSE-Het-1A) or SSE (S, SSE-Het-1A) grew in clumps and piled up. Similar results were observed in cells grown on Matrigel beds for 48 hrs (Fig. 2B, lower). In addition, cells on Matrigel beds were treated with toxic concentrations of CSE (0.5% MSE or 1% SSE) for 24 hrs and incubated for a further 48 hrs in complete medium without treatment. Little difference was observed in control-Het-1A cells compared to cells before treatment; within a few hours of being in fresh medium, control-Het-1A cells were back to normal morphology. However, the morphologic changes in MSE- and SSE-Het-1A cells by treatment with MSE and SSE did not recover even after further incubation of cells without treatment (Fig. 2C). Moreover, to examine cell growth in Matrigel, cell suspensions were mixed with Matrigel, and incubated for 7 days. Increased number and size of colonies was observed in MSE- and SSE-Het-1A cells compared to control-Het-1A cells (Fig. 2D, upper). More significant differences in cell morphology were observed after 14 days of incubation; colonies of MSE- and SSE-Het-1A cells in Matrigel became elongated, and cells in colonies detached and spread out from each other, whereas control-Het-1A cells remained round (Fig. 2D, middle and lower). Interestingly, colony numbers in MSE- and SSE-Het-1A cells increased compared to those in control-Het-1A cells.
The cellular resistance to MSE or SSE was quantified in dose-response curves after treatment of cells with MSE (0 ~ 0.5%) or SSE (0 ~ 1%). Resistance was observed at passage +17 of Het-1A cells after 4 months of MSE treatment (Supplemental Fig. 2B), and more clearly observed at passage +24 (Fig. 3A) after 6 months of MSE or SSE treatment. The concentrations of MSE and SSE that resulted in 70% (IC70), 50% (IC50) or 30% (IC30) growth inhibition were determined at passage +24, and shown in Supplemental Table 1. Differences in morphology were consistently observed among sensitive (C) and resistant (M or S) cells at passage +31 (Fig. 3B).
Figure 3.
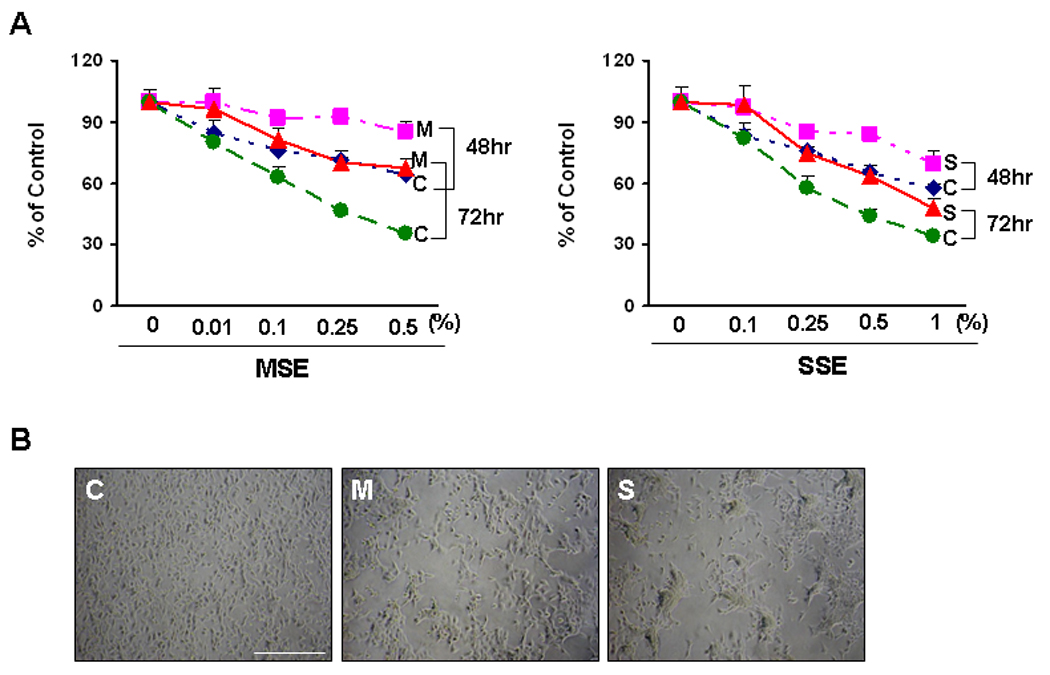
Het-1A cells resistant to CSE treatment. A, Het-1A cells exposed to 0.2% MSE (M, MSE-Het-1A) or 0.5% SSE (S, SSE-Het-1A) for 6 months, and parental control (C, Control-Het-1A) were seeded at a density of 2 × 10³/well in 96-well plates and the MTT assay was performed 48 or 72 hrs after treatment with MSE (0 ~ 0.5%) or SSE (0 ~ 1%). Values (%) indicate means ± SD calculated with absorbance at 570 nm of treated cells divided by that of untreated cells. Experiments were performed at the same cell passage (+24). B, Cells at passage +31 were plated on culture dishes and are shown in low power under a microscope. Scale bar, 500 µm.
To examine the oncogenic capacity of the resistant cells in vitro, anchorage-independent cell growth assay was performed. Colony forming ability in the cells resistant to MSE (M) or SSE (S) was 6- and 17-fold higher respectively, than that of parental sensitive cells (C) (Fig. 4A). In vitro cellular invasive activity also increased in the resistant cells; the number of cells passing into the chamber for 16 hrs increased about 7- and 4-fold in the resistant cells respectively, compared to the sensitive cells (Fig. 4B). A significant increase in cell proliferation (Fig. 4C), and loss of the epithelial marker E-cadherin and up-regulation of the mesenchymal markers N-cadherin and vimentin were also observed in the resistant cells (Fig. 4D), reflecting the tumor promoting activity of chronic exposure of both MSE and SSE.
Figure 4.
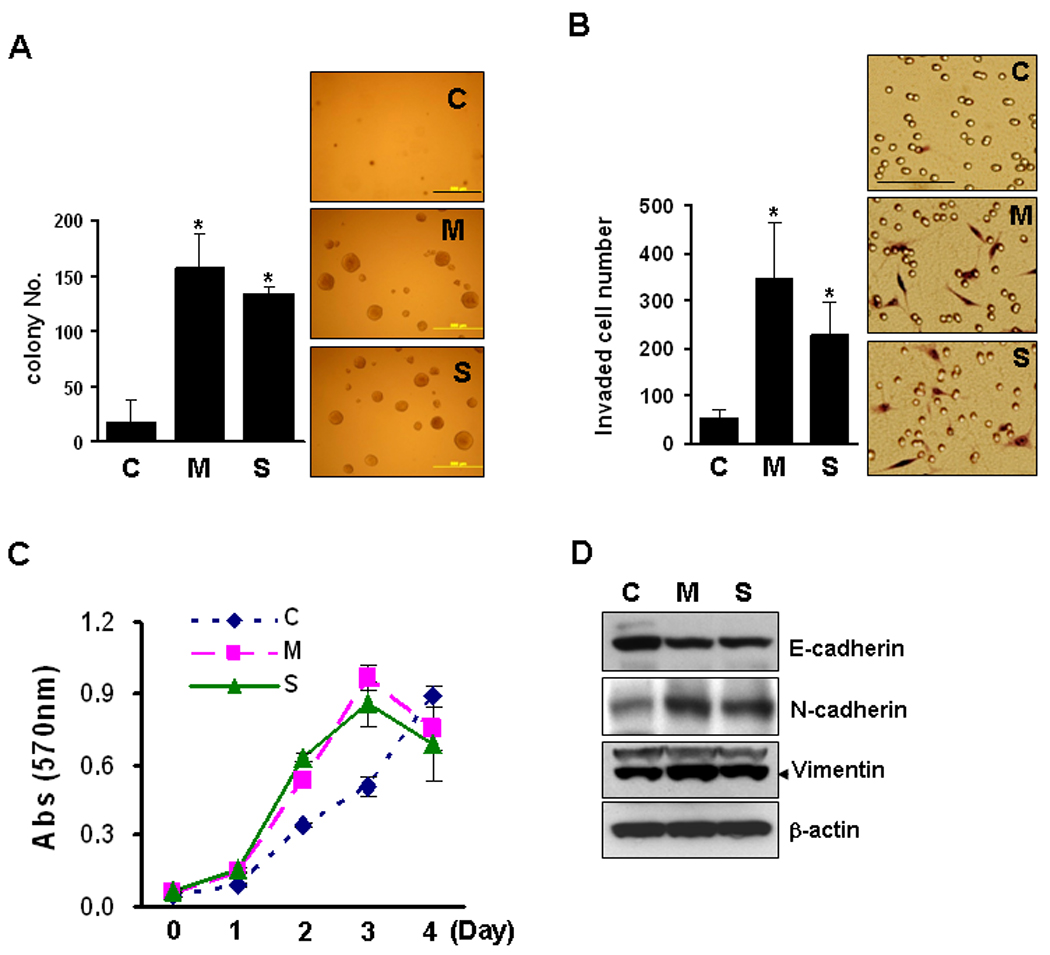
Oncogenic capacity of resistant cells. A, Control Het-1A (C), MSE-Het-1A (M) and SSE-Het-1A (S) cells (at passage +26) at a density of 5 × 10⁴/well in 6-well plates were seeded in 1 ml of 0.3% low-melting agarose over a 0.6% agar bottom layer in cell growth medium. The medium was changed three times a week and colonies were allowed to grow for three weeks. Colonies with a diameter over 0.1 mm were counted at 10 sites/well. Experiments were repeated twice in triplicate. Values indicate means ± SD. MSE- or SSE-Het-1A cells were compared to control-Het-1A cells. P<0.05 was considered as significant (*, t-test). Scale bar, 500 µm. B, Cells were incubated for 16 hrs, and in vitro cell invasion assays were performed. After fixation and staining, invading cells were counted (left) and photographed (Right). Scale bar, 100 µm. C, Cellular growth was evaluated at passage +31 by the MTT cell growth assay. Data are expressed as absorbance at 570 nm and values indicate means ± SD. D, Total cell lysates extracted from cells at passage +26 were run on 4–12% polyacrylamide gels and transferred onto nitrocellulose membranes. Membranes were then probed for expression of an epithelial marker E-cadherin, mesenchymal markers N-cadherin and vimentin, and β-actin was used as a loading control.
Glycolysis and mitochondrial dysfunction in cells resistant to MSE or SSE
A general property of primary cancers is their high glycolytic rate which results from increased glucose consumption and in high lactate production.19 To examine whether CSE alters cellular glycolysis, control-Het-1A cells were treated with MSE or SSE (0 ~ 1%) for 4 hrs, and lactate levels were measured in cell culture medium. SSE increased lactate production in a dose-dependent manner, whereas MSE decreased the level at higher concentrations than 0.25% (Supplemental Fig. 3A). Cellular oxygen consumption and ATP production were significantly decreased by 0.25% MSE or 0.5% SSE treatment, (Supplemental Fig. 3B), indicating that a single dose of treatment of Het-1A cells with CSE is capable of inhibiting cellular respiration and energy production. Consistent results were observed in Het-1A cells resistant to MSE or SSE; MSE- and SSE-Het-1A cells consumed more glucose, and thus produced more lactate than sensitive cells (Fig. 5A and 5B). A glycolysis inhibitor, 2-deoxy-D-glucose (2-DG) suppressed the lactate production as well as the anchorage-independent cell growth in the resistant cells (Fig. 5B and 5C), supporting the use of 2-DG as a chemotherapeutic agent for prevention of cigarette smoke-induced epithelial transformation.
Figure 5.
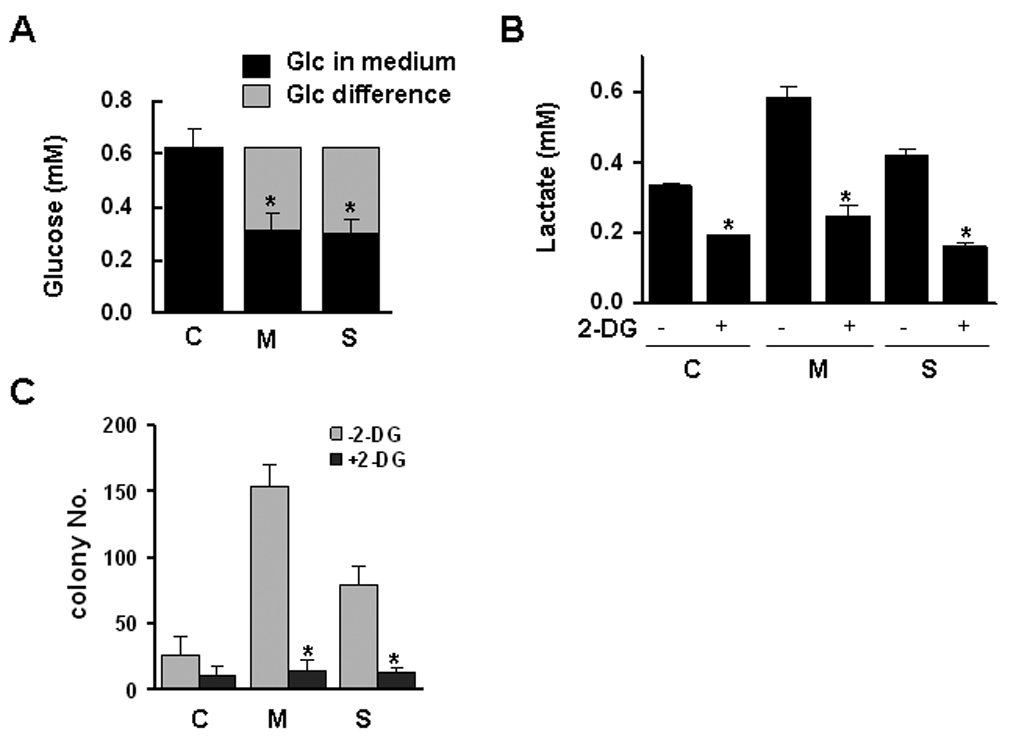
Glycolysis and mitochondrial dysfunction in the cells resistant to MSE or SSE. Control Het-1A (C), MSE-Het-1A (M) and SSE-Het-1A (S) cells (at passage +26) were plated and incubated for 16 hrs. Culture medium was then re-supplemented with fresh, growth medium and incubated for 4 hrs. Glucose concentration (A) was measured in the culture medium. Glucose consumption was determined from the difference in glucose concentration compared with control, and the difference in the MSE- or SSE-Het-1A cells was compared to that in control-Het-1A cells. P<0.05 was considered as significant (*, t-test). B, Cells were treated with or without 2-DG (1 mg/ml) for 4 hrs and the lactate level was measured in the medium. In parallel, the MTT assay was performed for verifying similar number of cells, and no difference was found between treated and untreated cells (data not shown). Lactate level was compared between cells in the absence or presence of 2-DG. C, Cells (at passage +31) were suspended in soft agar layer and treated with 2-DG (1 mg/ml) three times a week for two weeks, and colonies were counted under a microscope. Experiments were repeated twice in triplicate. Values indicate means ± SD. D, The ratio of J-aggregates to JC-1 monomer was calculated for the mitochondrial membrane potential (Δψm) that was determined by flow cytometry after staining cells (at passage +26) with a membrane potential sensitive dye, JC-1. Data were derived from two independent experiments done in triplicate. Values are expressed as means ± SD. Intracellular ATP (E) and ROS levels (F) were measured. P<0.05, significant.
Mitochondrial membrane potential (Δψm) is a driving force of ATP synthesis, contributing the acquisition of a more invasive phenotype cancer progression.33,34 To measure membrane potential, intracellular mitochondria in the sensitive and resistant cells were stained with membrane potential (Δψm) sensitive dye, JC-1, and fluorescence imaging was performed by flow cytometry. The distribution of J-aggregates (FL2-H channel) in the resistant cells slightly increased compared to the sensitive cells whereas that of JC-1 monomer (FL1-H channel) dramatically increased, so that the Δψm (the ratio of J-aggregates to JC-1 monomer) decreased in the resistant cells (Fig. 5D). Cellular ATP production also significantly decreased in the resistant cells (Fig. 5E), but oxygen consumption was not significantly different between the sensitive and resistant cells (data not shown). The level of reactive oxygen species (ROS) measured using a fluorescent dye, DCDHF-DA, slightly increased in the resistant cells, indicating dysfunctional mitochondria in the MSE- or SSE-resistant cells (Fig. 5F).
Expression of genes involved in glycolysis and mitochondrial function
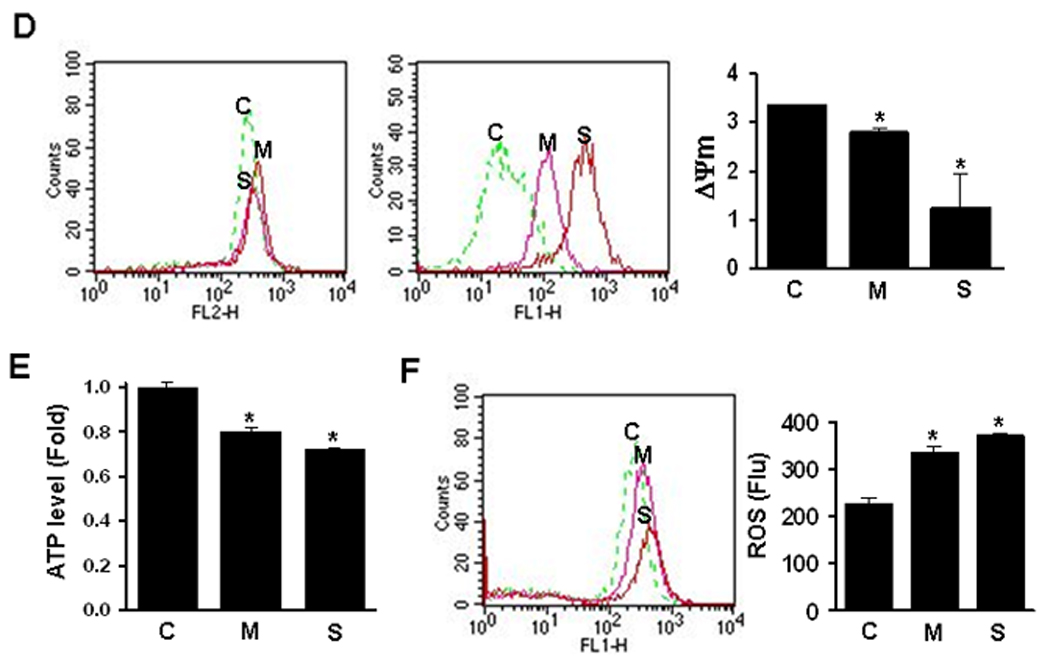
To investigate the expression levels of glycolysis- and mitochondria-related genes, quantitative real-time PCR and western blotting were performed with cDNA or whole cell lysates from the sensitive and the resistant cells. Nuclear respiratory factor-2 (NRF-2) is a nuclear transcription factor regulating the expression of nuclear and mitochondrial genes relevant to mitochondrial biogenesis and respiration, including cytochrome c oxidase (Co).35 The mRNA expression of NRF-2, and Co II and Co VIc decreased in the cells resistant to MSE or SSE (Fig. 6A). Consistent with the decreased level of ATP synthesis (Fig. 5F), mRNA expression of the subunit 6 of the ATP synthase (MT-ATP6) was down-regulated in the cells resistant to MSE or SSE treatment. However, no significant difference in the expression of NRF-1 and mitochondrial transcription factor A was observed between the sensitive and resistant cells (data not shown). The mRNA level of c-Myc that increases mitochondrial biogenesis,36,37 and the mRNA and protein levels of pyruvate dehydrogenase (PDH), a TCA cycle enzyme converting pyruvate to acetyl-CoA in mitochondria, also decreased in the resistant cells whereas the level of pyruvate dehydrogenase kinase-1 (PDK-1) that decreases glucose oxidation through PDH phosphorylation38,39 increased in the resistant cells (Fig. 6B).
Figure 6.
Expression levels of glycolysis- and mitochondria-related genes. A, Real-time-RT-PCR was performed with cDNA prepared from cells (at passage +22) using SYBR Green PCR dye (NRF-2, Co II, Co VIc and c-Myc) or TaqMan pre-designed primers and probes (MT-ATP6, PDH, and MMP-7) as described in the Methods. The cells resistant to MSE or SSE that displayed increased invasive activity (Fig. 4B) expressed higher levels of matrix-metalloproteinase (MMP)-7 than the sensitive cells. Transcriptional levels of each gene were normalized by the level of β-actin. Values are expressed as means ± SD, and experiments were done in triplicate, and repeated twice. Gene transcriptional level was compared between the MSE- or SSE-Het-1A cells and the control-Het-1A cells. P<0.05 was considered as significant (*, t-test). B, Whole cell lysates from the sensitive and resistant cells (at passage +27) were run on 4–12% polyacrylamide gel and transferred onto nitrocellulose membranes. Membranes were then probed for expression of proteins in glycolytic pathways and in mitochondria using individual specific antibodies. β-actin was used as a loading control.
Activation of the Akt oncogene stimulates aerobic glycolysis and cell survival,40,41 but reduces the cellular content and activity of mitochondria in many cancers.42,43 Akt also triggers a network that positively regulates G1/S cell cycle progression through inactivation of Gsk3β.44 In cells resistant to MSE or SSE, phosphorylation of Akt increased compared to the sensitive cells but no difference was observed in total Akt level (Fig. 6B). Increased cyclin D1 expression was observed in the resistant cells. In addition, expression levels of genes involved in cellular glycolysis pathway were examined in the sensitive and resistant cells. Hexokinase (HK) and phosphofructokinase (PFK) are critical for maintaining an elevated rate of aerobic glycolysis in cancer cells and increased energy demands associated with rapid cell growth and proliferation.45,46 Increased expression of HK and PFK was observed in the cells resistant to SSE, but not in the cells resistant to MSE or in the sensitive cells. The protein levels of pyruvate kinase M2 (PK-M2), an isoform of glycolytic enzyme pyruvate kinase that increases in ESCC,47 increased in the cells resistant to MSE or SSE treatment. Increased expression of glyceraldehyde 3-phosphate dehydrogenase (GAPDH) was also observed in the resistant cells, but little difference was observed in the expression of lactate dehydrogenase-A (LDHA).
Discussion
Exposure to cigarette smoke is associated with a high risk of developing cancers such as cancers of the upper aerodigestive tract and lung.25 In vivo and in vitro studies have shown that exposure to tobacco smoke, including mainstream and sidestream, or their mixture, causes DNA single-strand breaks, aromatic adducts and oxidative damage to DNA, chromosome aberrations, and micronuclei.6 Tobacco-induced oncogenic transformation was shown in vitro in various types of normal cells such as breast epithelial cells,12,13,14 lung epithelial type-II cells,11,15 and oral keratinocytes.16 Aqueous phase of cigarette smoke can be easily distributed in some body compartments, such as saliva or fluid lining alveolar spaces, and can act on both cellular and extracellular compartments.48 It does not contain nonpolar smoke constituents, such as polycyclic aromatic hydrocarbons (PAH) that are considered important carcinogenic constituents of smoke. The water-soluble fraction is a potent, irreversible inhibitor of polymorphonuclear leukocyte chemotaxis49,50. It increases glucose metabolism via both glycolysis and hexose monophosphate shunt, without apparent effects on the metabolism of glucose via the tricarboxylic acid cycle.50
Adverse effects of aqueous and non-aqueous fractions of cigarette smoke on mitochondrial function have been known since early 1970s; Kennedy and Elliott observed that both water-soluble and -insoluble fractions were ciliostatic and caused swelling of mitochondria, resulting in a block in the energy generation process in mitochondria.51 The findings by Gairola and Aleem that both fractions caused a decline in energy generation and inhibited the state 3 respiration in mitochondria also support the inhibitory activity of cigarette smoke in oxidative phophorylation.52 However, very little has been reported about the effects of smoke extracts on the bioenergetic shift to glycolysis in affected cells.
Cellular transformation is a complex process involving genetic alteration and modulation of multiple signaling pathways. Development of a transformation model using CSE can provide an opportunity to elucidate the role of cigarette smoke in the initiation and development of esophageal cancer. In the previous CSE-related studies, a single dose of CSE was used to induce transformation or apoptosis of pre-malignant cells17,18 and/or cancer cells.15 In comparison to the amount present in a cigarette, the concentrations of 0 ~ 5% MSE applied in our study were very low as reported,13 but more than 50% of Het-1A cells died with a single treatment of 0.5% MSE for 24 hr. The rapid increase in the number of apoptotic Het-1A cells at MSE concentrations above 0.5% indicate a high sensitivity of esophageal epithelial cells to cigarette smoke. Het-1A cells were also more sensitive to SSE treatment than ESCC cell lines. Therefore, to assess the mechanisms underlying the oncogenic transformation of esophageal epithelial cells as related to cigarette smoking, it was necessary to establish transformed esophageal cells resistant to CSE-induced cell death. At least two kinds of cell lines resistant to either MSE or SSE-induced cell death were needed. Two pooled clones of Het-1A cells were established after exposure to MSE or SSE until resistance was observed, and tested for their oncogenic capacity. The expression of markers involved in epithelial mesenchymal transition (EMT) indicates alterations of non-malignant esophageal epithelial cells to transformed cells by chronic exposure of CSE. MSE or SSE might exert pressure on esophageal epithelial cells that results in selection and emergence of clones that may have lost the capacity to effectively execute programmed cell death.53
Cellular resistance to CSE was observed at cell passage +24 in MSE- or SSE-Het-1A cells, but the increase in anchorage-dependent and independent cell growth of the exposed cells compared to the unexposed cells was not observed at cell passages lower than +24 (data not shown), implying that during oncogenic transformation by chronic exposure of CSE, cellular resistance is acquired earlier than abnormal cell growth. A single dose of 0.25% MSE and 0.5% SSE treatment sensitized Het-1A cells to apoptosis without any significant changes in Δψm and ROS production (data not shown). After Het-1A cells acquired resistance to MSE or SSE, decreased Δψm and increased ROS level were observed. These results suggest that mitochondrial response to CSE is different before and after acquisition of resistance. The underlying mechanisms and potential mode of action for the differential physiologic responses to CSE still need to be further investigated.
The metabolism of rapidly growing solid tumors under normal oxygen condition (aerobic glycolysis) is associated with high lactate production.54,55,56 High levels of lactate result in acid environment-mediated matrix degradation, and subsequent invasiveness/metastasis of cancer cells.54,55,56 We observed an increase of invasive activity in MSE- or SSE-Het-1A cells which produced a higher level of lactate than control-Het-1A cells. The alteration in mitochondrial membrane potential (Δψm) and cellular ATP levels in the MSE- or SSE-transformed cells correlated with significant difference at the mRNA and protein levels between mitochondrial and glycolytic markers. These results suggest that these MSE- or SSE-transformed cells have a bioenergetic shift to dependence on glycolytic metabolism, which is characteristic of most malignant cells.40
Tobacco carcinogens including nicotine, benzo(a)pyrene, and cigarette smoke condensate activate many signaling networks such as PI3K/Akt/ERK, MAPK kinase, NF-κb, and EGFR.57,58 Akt plays a vital role in the maintenance of mitochondrial membrane integrity to prevent the induction of apoptosis,59,60 and in glycolytic metabolism to increase cell survival.40 Cigarette smoke induces Akt-dependent proliferation of lung and oral cancer cells.61,62 We observed an increase of Akt activation in the MSE- or SSE-transformed cells, indicating that Akt might be involved in regulating the phenotypic alterations that have been observed in the MSE- or SSE-transformed cells. However, it is also possible that many events can occur prior to the activation of Akt, which would also initiate many of the responses observed in CSE-resistant cells.
Second-hand smoke is composed of smoke that rises from the tip of the burning cigarette between puffs (85%), smoke that the smoker exhales (11%), and contaminants that diffuse through the cigarette paper (4%).63 Exposure to second-hand smoke is associated with an increase risk of lung cancer among never-smokers6 and an increased prevalence of Legg–Calvé–Perthes disease in children.64 Taking into account the time to tumor development, tumor incidence, and tumor multiplicity, second-hand smoke is 2–6 times more tumorigenic than first-hand smoke,6 but it has been reported that second-hand smoke had no appreciable effect on esophageal cancer.65 Sidestream smoke accounts for 85% of the total amount of second-hand smoke,66 and is more toxic than mainstream smoke.67 In this study, SSE was used as a mimic of second-hand smoke. Since the concentrations of MSE and SSE applied for establishing resistant cells in this study were different, cellular response between MSE- and SSE-Het-1A cells are not comparable. In addition, we observed higher expressions of glycolytic enzymes in the cells resistant to SSE than to MSE, but we did not observe any significant difference in lactate production and glucose consumption between MSE- and SSE-Het-1A cells. To better understand the contribution of cigarette smoking in esophageal carcinogenesis, the differential function of these two types of cigarette smoke needs to be further examined in aerobic glycolysis and mitochondrial dysfunction.
In summary, our results show that chronic exposure of non-malignant esophageal epithelial cells to MSE or SSE causes alterations in cellular phenotypes, leading to acquisition of tumorigenic characteristics. The underlying mechanism of MSE or SSE-induced glycolysis and mitochondrial dysfunction involves up-regulation of glycolytic enzymes and reciprocally down-regulation of mitochondrial genes. These results suggest that alterations in glycolysis and mitochondrial biogenesis by chronic exposure to cigarette smoke likely contribute to malignant transformation of esophageal epithelial cells and subsequent ESCC development.
Supplementary Material
Acknowledgments
Grant support: This study was supported by National Cancer Institute grant (U01-CA84986), Oncomethylome Sciences, and the Flight Attendant Medical Research Institute Young Clinical Scientist Award (Kim, MS).
Abbreviations used
- CSE
cigarette smoke extract
- MSE
mainstream cigarette smoke extract
- SSE
sidestream cigarette smoke extract
- Δψm
mitochondrial membrane potential
- 2-DG
2-deoxy-D-glucose
Footnotes
Novelty and impact of this paper; 1. Chronic exposure of a non-malignant esophageal epithelial cell line, Het-1A, to cigarette smoke extract results in transformed phenotypes. 2. Cigarette smoking may contribute esophageal epithelial cells to acquire tumorigenic phenotypes by alteration in glycolysis and mitochondrial function.
References
- 1.WHO. The World Health Report. 1997
- 2.Goseki N, Koike M, Yoshida M. Histopathologic characteristics of early stage esophageal carcinoma. A comparative study with gastric carcinoma. Cancer. 1992;69:1088–1093. doi: 10.1002/cncr.2820690503. [DOI] [PubMed] [Google Scholar]
- 3.Shimada Y, Watanabe G, Kawamura J, Soma T, Okabe M, Ito T, Inoue H, Kondo M, Mori Y, Tanaka E, Imamura M. Clinical significance of osteopontin in esophageal squamous cell carcinoma: comparison with common tumor markers. Oncology. 2005;68:285–292. doi: 10.1159/000086961. [DOI] [PubMed] [Google Scholar]
- 4.Brockmann JG, St Nottberg H, Glodny B, Heinecke A, Senninger NJ. CYFRA 21-1 serum analysis in patients with esophageal cancer. Clin Cancer Res. 2000;6:4249–4252. [PubMed] [Google Scholar]
- 5.Stoner GD, Gupta A. Etiology and chemoprevention of esophageal squamous cell carcinoma. Carcinogenesis. 2001;22:1737–1746. doi: 10.1093/carcin/22.11.1737. [DOI] [PubMed] [Google Scholar]
- 6.Husgafvel-Pursiainen K. Genotoxicity of environmental tobacco smoke: a review. Mutat Res. 2004;567:427–445. doi: 10.1016/j.mrrev.2004.06.004. [DOI] [PubMed] [Google Scholar]
- 7.Nishikawa A, Mori Y, Lee IS, Tanaka T, Hirose M. Cigarette smoking, metabolic activation and carcinogenesis. Curr Drug Metab. 2004;5:363–373. doi: 10.2174/1389200043335441. [DOI] [PubMed] [Google Scholar]
- 8.Smith CJ, Hansch C. The relative toxicity of compounds in mainstream cigarette smoke condensate. Food Chem Toxicol. 2000;38:637–646. doi: 10.1016/s0278-6915(00)00051-x. [DOI] [PubMed] [Google Scholar]
- 9.Hecht SS. Tobacco smoke carcinogens and breast cancer. Environ Mol Mutagen. 2002;39:119–126. doi: 10.1002/em.10071. [DOI] [PubMed] [Google Scholar]
- 10.Stabbert R, Voncken P, Rustemeier K, Haussmann HJ, Roemer E, Schaffernicht H, Patskan G. Toxicological evaluation of an electrically heated cigarette. Part 2: Chemical composition of mainstream smoke. J Appl Toxicol. 2003;23:329–339. doi: 10.1002/jat.924. [DOI] [PubMed] [Google Scholar]
- 11.DeMarini DM. Genotoxicity of tobacco smoke and tobacco smoke condensate: a review. Mutat Res. 2004;567:447–474. doi: 10.1016/j.mrrev.2004.02.001. [DOI] [PubMed] [Google Scholar]
- 12.Narayan S, Jaiswal AS, Kang D, Srivastava P, Das GM, Gairola CG. Cigarette smoke condensate-induced transformation of normal human breast epithelial cells in vitro. Oncogene. 2004;23:5880–5889. doi: 10.1038/sj.onc.1207792. [DOI] [PubMed] [Google Scholar]
- 13.Kundu CN, Balusu R, Jaiswal AS, Gairola CG, Narayan S. Cigarette smoke condensate-induced level of adenomatous polyposis coli blocks long-patch base excision repair in breast epithelial cells. Oncogene. 2007;26:1428–1438. doi: 10.1038/sj.onc.1209925. [DOI] [PubMed] [Google Scholar]
- 14.Jaiswal AS, Aneja R, Connors SK, Joshi HC, Multani AS, Pathak S, Narayan S. 9-bromonoscapine-induced mitotic arrest of cigarette smoke condensate-transformed breast epithelial cells. J Cell Biochem. 2009;106:1146–1156. doi: 10.1002/jcb.22099. [DOI] [PMC free article] [PubMed] [Google Scholar]
- 15.Kaushik G, Kaushik T, Khanduja S, Pathak CM, Khanduja KL. Cigarette smoke condensate promotes cell proliferation through disturbance in cellular redox homeostasis of transformed lung epithelial type-II cells. Cancer Lett. 2008;270:120–131. doi: 10.1016/j.canlet.2008.04.039. [DOI] [PubMed] [Google Scholar]
- 16.Zhang L, Wu R, Dingle RW, Gairola CG, Valentino J, Swanson HI. Cigarette smoke condensate and dioxin suppress culture shock induced senescence in normal human oral keratinocytes. Oral Oncol. 2007;43:693–700. doi: 10.1016/j.oraloncology.2006.08.008. [DOI] [PMC free article] [PubMed] [Google Scholar]
- 17.Ramage L, Jones AC, Whelan CJ. Induction of apoptosis with tobacco smoke and related products in A549 lung epithelial cells in vitro. J Inflamm (Lond) 2006;3:3. doi: 10.1186/1476-9255-3-3. [DOI] [PMC free article] [PubMed] [Google Scholar]
- 18.Carter CA, Hamm JT. Multiplexed quantitative high content screening reveals that cigarette smoke condensate induces changes in cell structure and function through alterations in cell signaling pathways in human bronchial cells. Toxicology. 2009;261:89–102. doi: 10.1016/j.tox.2009.04.039. [DOI] [PubMed] [Google Scholar]
- 19.Warburg O. On the origin of cancer cells. Science. 1956;123:309–314. doi: 10.1126/science.123.3191.309. [DOI] [PubMed] [Google Scholar]
- 20.Unwin RD, Craven RA, Harnden P, Hanrahan S, Totty N, Knowles M, Eardley I, Selby PJ, Banks RE. Proteomic changes in renal cancer and co-ordinate demonstration of both the glycolytic and mitochondrial aspects of the Warburg effect. Proteomics. 2003;3:1620–1632. doi: 10.1002/pmic.200300464. [DOI] [PubMed] [Google Scholar]
- 21.Tuttle SW, Maity A, Oprysko PR, Kachur AV, Ayene IS, Biaglow JE, Koch CJ. Detection of reactive oxygen species via endogenous oxidative pentose phosphate cycle activity in response to oxygen concentration: implications for the mechanism of HIF-1alpha stabilization under moderate hypoxia. J Biol Chem. 2007;282:36790–36796. doi: 10.1074/jbc.M700327200. [DOI] [PubMed] [Google Scholar]
- 22.Langbein S, Frederiks WM, zur Hausen A, Popa J, Lehmann J, Weiss C, Alken P, Coy JF. Metastasis is promoted by a bioenergetic switch: new targets for progressive renal cell cancer. Int J Cancer. 2008;122:2422–2428. doi: 10.1002/ijc.23403. [DOI] [PubMed] [Google Scholar]
- 23.Rathmell JC, Fox CJ, Plas DR, Hammerman PS, Cinalli RM, Thompson CB. Akt-directed glucose metabolism can prevent Bax conformation change and promote growth factor-independent survival. Mol Cell Biol. 2003;23:7315–7328. doi: 10.1128/MCB.23.20.7315-7328.2003. [DOI] [PMC free article] [PubMed] [Google Scholar]
- 24.Kaluz S, Kaluzová M, Chrastina A, Olive PL, Pastoreková S, Pastorek J, Lerman MI, Stanbridge EJ. Lowered oxygen tension induces expression of the hypoxia marker MN/carbonic anhydrase IX in the absence of hypoxia-inducible factor 1 alpha stabilization: a role for phosphatidylinositol 3'-kinase. Cancer Res. 2002;62:4469–4477. [PubMed] [Google Scholar]
- 25.Isidoro A, Martínez M, Fernández PL, Ortega AD, Santamaría G, Chamorro M, Reed JC, Cuezva JM. Alteration of the bioenergetic phenotype of mitochondria is a hallmark of breast, gastric, lung and oesophageal cancer. Biochem J. 2004;378:17–20. doi: 10.1042/BJ20031541. [DOI] [PMC free article] [PubMed] [Google Scholar]
- 26.Kulawiec M, Arnouk H, Desouki MM, Kazim L, Still I, Singh KK. Proteomic analysis of mitochondria-to-nucleus retrograde response in human cancer. Cancer Biol Ther. 2006;5:967–975. doi: 10.4161/cbt.5.8.2880. [DOI] [PubMed] [Google Scholar]
- 27.Amuthan G, Biswas G, Ananadatheerthavarada HK, Vijayasarathy C, Shephard HM, Avadhani NG. Mitochondrial stress-induced calcium signaling, phenotypic changes and invasive behavior in human lung carcinoma A549 cells. Oncogene. 2002;21:7839–7849. doi: 10.1038/sj.onc.1205983. [DOI] [PubMed] [Google Scholar]
- 28.Tan D, Goerlitz DS, Dumitrescu RG, Han D, Seillier-Moiseiwitsch F, Spernak SM, Orden RA, Chen J, Goldman R, Shields PG. Associations between cigarette smoking and mitochondrial DNA abnormalities in buccal cells. Carcinogenesis. 2008;29:1170–1177. doi: 10.1093/carcin/bgn034. [DOI] [PMC free article] [PubMed] [Google Scholar]
- 29.Jin Z, Gao F, Flagg T, Deng X. Tobacco-specific nitrosamine 4-(methylnitrosamino)-1-(3-pyridyl)-1-butanone promotes functional cooperation of Bcl2 and c-Myc through phosphorylation in regulating cell survival and proliferation. J Biol Chem. 2004;279:40209–40219. doi: 10.1074/jbc.M404056200. [DOI] [PubMed] [Google Scholar]
- 30.Palozza P, Sheriff A, Serini S, Boninsegna A, Maggiano N, Ranelletti FO, Calviello G, Cittadini A. Lycopene induces apoptosis in immortalized fibroblasts exposed to tobacco smoke condensate through arresting cell cycle and down-regulating cyclin D1, pAKT and pBad. Apoptosis. 2005;10:1445–1456. doi: 10.1007/s10495-005-1393-2. [DOI] [PubMed] [Google Scholar]
- 31.Low B, Liang M, Fu J. p38 mitogen-activated protein kinase mediates sidestream cigarette smoke-induced endothelial permeability. J Pharmacol Sci. 2007;104:225–231. doi: 10.1254/jphs.fp0070385. [DOI] [PubMed] [Google Scholar]
- 32.Kim MS, Chang X, Yamashita K, Nagpal JK, Baek JH, Wu G, Trink B, Ratovitski EA, Mori M, Sidransky D. Aberrant promoter methylation and tumor suppressive activity of the DFNA5 gene in colorectal carcinoma. Oncogene. 2008;27:3624–3634. doi: 10.1038/sj.onc.1211021. [DOI] [PubMed] [Google Scholar]
- 33.Lee W, Choi HI, Kim MJ, Park SY. Depletion of mitochondrial DNA up-regulates the expression of MDR1 gene via an increase in mRNA stability. Exp Mol Med. 2008;40:109–117. doi: 10.3858/emm.2008.40.1.109. [DOI] [PMC free article] [PubMed] [Google Scholar]
- 34.Yu M, Zhou Y, Shi Y, Ning L, Yang Y, Wei X, Zhang N, Hao X, Niu R. Reduced mitochondrial DNA copy number is correlated with tumor progression and prognosis in Chinese breast cancer patients. IUBMB Life. 2007;59:450–457. doi: 10.1080/15216540701509955. [DOI] [PubMed] [Google Scholar]
- 35.Ongwijitwat S, Liang HL, Graboyes EM, Wong-Riley MT. Nuclear respiratory factor 2 senses changing cellular energy demands and its silencing down-regulates cytochrome oxidase and other target gene mRNAs. Gene. 2006;374:39–49. doi: 10.1016/j.gene.2006.01.009. [DOI] [PubMed] [Google Scholar]
- 36.Zhang H, Gao P, Fukuda R, Kumar G, Krishnamachary B, Zeller KI, Dang CV, Semenza GL. HIF-1 inhibits mitochondrial biogenesis and cellular respiration in VHL-deficient renal cell carcinoma by repression of C-MYC activity. Cancer Cell. 2007;11:407–420. doi: 10.1016/j.ccr.2007.04.001. [DOI] [PubMed] [Google Scholar]
- 37.Li F, Wang Y, Zeller KI, Potter JJ, Wonsey DR, O'Donnell KA, Kim JW, Yustein JT, Lee LA, Dang CV. Myc stimulates nuclearly encoded mitochondrial genes and mitochondrial biogenesis. Mol Cell Biol. 2005;25:6225–6234. doi: 10.1128/MCB.25.14.6225-6234.2005. [DOI] [PMC free article] [PubMed] [Google Scholar]
- 38.Zou CP, Youssef EM, Zou CC, Carey TE, Lotan R. Differential effects of chromosome 3p deletion on the expression of the putative tumor suppressor RAR beta and on retinoid resistance in human squamous carcinoma cells. Oncogene. 2001;20:6820–6827. doi: 10.1038/sj.onc.1204846. [DOI] [PubMed] [Google Scholar]
- 39.Papandreou I, Cairns RA, Fontana L, Lim AL, Denko NC. HIF-1 mediates adaptation to hypoxia by actively downregulating mitochondrial oxygen consumption. Cell Metab. 2006;3:187–197. doi: 10.1016/j.cmet.2006.01.012. [DOI] [PubMed] [Google Scholar]
- 40.Elstrom RL, Bauer DE, Buzzai M, Karnauskas R, Harris MH, Plas DR, Zhuang H, Cinalli RM, Alavi A, Rudin CM, Thompson CB. Akt stimulates aerobic glycolysis in cancer cells. Cancer Res. 2004;64:3892–3899. doi: 10.1158/0008-5472.CAN-03-2904. [DOI] [PubMed] [Google Scholar]
- 41.Kawauchi K, Araki K, Tobiume K. Tanaka N. p53 regulates glucose metabolism through an IKK-NF-kappaB pathway and inhibits cell transformation. Nat Cell Biol. 2008;10:611–618. doi: 10.1038/ncb1724. [DOI] [PubMed] [Google Scholar]
- 42.Cuezva JM, Krajewska M, de Heredia ML, Krajewski S, Santamaría G, Kim H, Zapata JM, Marusawa H, Chamorro M, Reed JC. The bioenergetic signature of cancer: a marker of tumor progression. Cancer Res. 2002;62:6674–6681. [PubMed] [Google Scholar]
- 43.Cuezva JM, Chen G, Alonso AM, Isidoro A, Misek DE, Hanash SM, Beer DG. The bioenergetic signature of lung adenocarcinomas is a molecular marker of cancer diagnosis and prognosis. Carcinogenesis. 2004;25:1157–1163. doi: 10.1093/carcin/bgh113. [DOI] [PubMed] [Google Scholar]
- 44.Liang J, Slingerland JM. Multiple roles of the PI3K/PKB (Akt) pathway in cell cycle progression. Cell Cycle. 2003;2:339–345. [PubMed] [Google Scholar]
- 45.Semenza GL. Hypoxia, clonal selection, and the role of HIF-1 in tumor progression. Crit Rev Biochem Mol Biol. 2000;35:71–103. doi: 10.1080/10409230091169186. [DOI] [PubMed] [Google Scholar]
- 46.Smith TA. Mammalian hexokinases and their abnormal expression in cancer. Br J Biomed Sci. 2000;57:170–178. [PubMed] [Google Scholar]
- 47.Du XL, Hu H, Lin DC, Xia SH, Shen XM, Zhang Y, Luo ML, Feng YB, Cai Y, Xu X, Han YL, Zhan QM, et al. Proteomic profiling of proteins dysregulted in Chinese esophageal squamous cell carcinoma. J Mol Med. 2007;85:863–875. doi: 10.1007/s00109-007-0159-4. [DOI] [PubMed] [Google Scholar]
- 48.Kordom C, Maritz GS, De Kock M. Maternal nicotine exposure during pregnancy and lactation: I. Effect on glycolysis in the lungs of the offspring. Exp Lung Res. 2003;29:79–89. doi: 10.1080/01902140303769. [DOI] [PubMed] [Google Scholar]
- 49.Bridges RB. Protective action of thiols on neutrophil function. Eur J Respir Dis Suppl. 1985;139:40–48. [PubMed] [Google Scholar]
- 50.Bridges RB, Kraal JH, Huang LJ, Chancellor BM. Effects of tobacco smoke on chemotaxis and glucose metabolism of polymorphonuclear leukocytes. Infect Immun. 1977;15:115–123. doi: 10.1128/iai.15.1.115-123.1977. [DOI] [PMC free article] [PubMed] [Google Scholar]
- 51.Kennedy JR, Elliott AM. Cigarette smoke: the effect of residue on mitochondrial structure. Science. 1970;168:1097–1098. doi: 10.1126/science.168.3935.1097. [DOI] [PubMed] [Google Scholar]
- 52.Gairola C, Aleem MI. Cigarette smoke: effect of aqueous and nonaqueous fractions on mitochondrial function. Nature. 1973;241:287–288. doi: 10.1038/241287a0. [DOI] [PubMed] [Google Scholar]
- 53.Hays LE, Zodrow DM, Yates JE, Deffebach ME, Jacoby DB, Olson SB, Pankow JF, Bagby GC. Cigarette smoke induces genetic instability in airway epithelial cells by suppressing FANCD2 expression. Br J Cancer. 2008;98:1653–1661. doi: 10.1038/sj.bjc.6604362. [DOI] [PMC free article] [PubMed] [Google Scholar]
- 54.Stern R, Shuster S, Neudecker BA, Formby B. Lactate stimulates fibroblast expression of hyaluronan and CD44: the Warburg effect revisited. Exp Cell Res. 2002;276:24–31. doi: 10.1006/excr.2002.5508. [DOI] [PubMed] [Google Scholar]
- 55.Gatenby RA, Gawlinski ET, Gmitro AF, Kaylor B, Gillies RJ. Acid-mediated tumor invasion: a multidisciplinary study. Cancer Res. 2006;66:5216–5223. doi: 10.1158/0008-5472.CAN-05-4193. [DOI] [PubMed] [Google Scholar]
- 56.Fischer K, Hoffmann P, Voelkl S, Meidenbauer N, Ammer J, Edinger M, Gottfried E, Schwarz S, Rothe G, Hoves S, Renner K, Timischl B, et al. Inhibitory effect of tumor cell-derived lactic acid on human T cells. Blood. 2007;109:3812–3819. doi: 10.1182/blood-2006-07-035972. [DOI] [PubMed] [Google Scholar]
- 57.Jiao S, Liu B, Gao A, Ye M, Jia X, Zhang F, Liu H, Shi X, Huang C. Benzo(a)pyrene-caused increased G1-S transition requires the activation of c-Jun through p53-dependent PI-3K/Akt/ERK pathway in human embryo lung fibroblasts. Toxicol Lett. 2008;178:167–175. doi: 10.1016/j.toxlet.2008.03.012. [DOI] [PMC free article] [PubMed] [Google Scholar]
- 58.Zhang J, Kamdar O, Le W, Rosen GD, Upadhyay D. Nicotine induces resistance to chemotherapy by modulating mitochondrial signaling in lung cancer. Am J Respir Cell Mol Biol. 2009;40:135–146. doi: 10.1165/rcmb.2007-0277OC. [DOI] [PMC free article] [PubMed] [Google Scholar]
- 59.Su F, Overholtzer M, Besser D, Levine AJ. WISP-1 attenuates p53-mediated apoptosis in response to DNA damage through activation of the Akt kinase. Genes Dev. 2002;16:46–57. doi: 10.1101/gad.942902. [DOI] [PMC free article] [PubMed] [Google Scholar]
- 60.You Z, Saims D, Chen S, Zhang Z, Guttridge DC, Guan KL, MacDougald OA, Brown AM, Evan G, Kitajewski J, Wang CY. Wnt signaling promotes oncogenic transformation by inhibiting c-Myc-induced apoptosis. J Cell Biol. 2002;157:429–440. doi: 10.1083/jcb.200201110. [DOI] [PMC free article] [PubMed] [Google Scholar]
- 61.Kometani T, Yoshino I, Miura N, Okazaki H, Ohba T, Takenaka T, Shoji F, Yano T, Maehara Y. Benzo[a]pyrene promotes proliferation of human lung cancer cells by accelerating the epidermal growth factor receptor signaling pathway. Cancer Lett. 2009;278:27–33. doi: 10.1016/j.canlet.2008.12.017. [DOI] [PubMed] [Google Scholar]
- 62.Xu J, Huang H, Pan C, Zhang B, Liu X, Zhang L. Nicotine inhibits apoptosis induced by cisplatin in human oral cancer cells. Int J Oral Maxillofac Surg. 2007;36:739–744. doi: 10.1016/j.ijom.2007.05.016. [DOI] [PubMed] [Google Scholar]
- 63.Wong LS, Green HM, Feugate JE, Yadav M, Nothnagel EA, Martins-Green M. Effects of "second-hand" smoke on structure and function of fibroblasts, cells that are critical for tissue repair and remodeling. BMC Cell Biol. 2004;5:13. doi: 10.1186/1471-2121-5-13. [DOI] [PMC free article] [PubMed] [Google Scholar]
- 64.Gordon JE, Schoenecker PL, Osland JD, Dobbs MB, Szymanski DA, Luhmann SJ. Smoking and socio-economic status in the etiology and severity of Legg-Calvé-Perthes' disease. J Pediatr Orthop B. 2004;13:367–370. doi: 10.1097/01202412-200411000-00003. [DOI] [PubMed] [Google Scholar]
- 65.Duan L, Wu AH, Sullivan-Halley J, Bernstein L. Passive smoking and risk of oesophageal and gastric adenocarcinomas. Br J Cancer. 2009;100:1483–1485. doi: 10.1038/sj.bjc.6605023. [DOI] [PMC free article] [PubMed] [Google Scholar]
- 66.He J, Whelton PK. Passive cigarette smoking increases risk of coronary heart disease. Eur Heart J. 1999;20:1764–1765. doi: 10.1053/euhj.1999.1825. [DOI] [PubMed] [Google Scholar]
- 67.Schick S, Glantz S. Philip Morris toxicological experiments with fresh sidestream smoke: more toxic than mainstream smoke. Tob Control. 2005;14:396–404. doi: 10.1136/tc.2005.011288. [DOI] [PMC free article] [PubMed] [Google Scholar]
Associated Data
This section collects any data citations, data availability statements, or supplementary materials included in this article.