

Abstract
Computer simulations were used to study the cluster formation of anchored proteins in a membrane. The rate and extent of clustering was found to be dependent upon the hydrophobic length of the anchored proteins embedded in the membrane. The cluster formation mechanism of anchored proteins in our work was ascribed to the different local perturbations on the upper and lower monolayers of the membrane and the intermonolayer coupling. Simulation results demonstrated that only when the penetration depth of anchored proteins was larger than half the membrane thickness, could the structure of the lower monolayer be significantly deformed. Additionally, studies on the local structures of membranes indicated weak perturbation of bilayer thickness for a shallowly inserted protein, while there was significant perturbation for a more deeply inserted protein. The origin of membrane-mediated protein-protein interaction is therefore due to the local perturbation of the membrane thickness, and the entropy loss—both of which are caused by the conformation restriction on the lipid chains and the enhanced intermonolayer coupling for a deeply inserted protein. Finally, in this study we addressed the difference of cluster formation mechanisms between anchored proteins and transmembrane proteins.
Introduction
The membrane proteins, which are an important component of the biological membranes, are involved in a variety of cellular processes such as cell adhesion, cell signaling, accumulation, and transduction of energy (1). Recently, there has been tremendous academic and industrial interest in anchored proteins, including peripheral proteins and monotopic proteins, which are involved in biological process and pharmaceutics. As an important class of membrane proteins, most of the anchored proteins bind tightly to the membrane and penetrate into its hydrophobic core. However, different from transmembrane proteins, anchored proteins in general do not span the lipid bilayer. An anchored protein can be divided to two parts—i.e., the hydrophilic part outside the membrane and the hydrophobic part embedded in the membrane. For different anchored proteins, their hydrophobic lengths are, in general, different. For example, the hydrophobic lengths of prostaglandin H2 synthase-1, fatty acid amide hydrolase, and monoamine oxidase B are 7.2, 10.0, and 16.2 Ångstroms, respectively (data from the Orientations of Proteins in Membranes database, http://opm.phar.umich.edu/). To date the x-ray crystal structures of several kinds of anchored proteins, such as prostaglandin H2 synthase (2), squalene-hopene cyclase (3), monoamine oxidase (4), fatty acid amide hydrolase (5), and microsomal cytochrome P450 (6), have been experimentally determined. Although the crystal structures and properties of them have been investigated experimentally and theoretically (7), the influence of the hydrophobic lengths on the membrane structure and interaction between proteins and lipids have been rarely investigated. Only recently, coarse-grained molecular dynamics simulations demonstrated that deep insertion of monotopic proteins cause significant local perturbation of bilayer (8).
Over the past several years, computer simulation methods have become a powerful alternative to address the static and dynamic properties of an anchored protein and its interaction with the surrounding lipids. A number of computer simulation studies have been performed on different anchored proteins, especially monotopic proteins. For example, a molecular dynamics (MD) protocol, which integrates prostaglandin H2 synthase (PGHS) monomers into phospholipid bilayers, was proposed by Fowler and Coveney (9), for which they produced in silico atomistic models of the PGHS system. The details of interaction between PGHS and lipids were studied by Nina et al. (10). The squalene-to-hopene carbocation cyclization mechanism and the structural and dynamical features of squalene-hopene cyclase were investigated by MD simulations (11,12). The interactions of selected monotopic proteins with the lipids of the membranes were studied using MD (13,14) and coarse-grained MD simulation (8,15,16). The above computer simulations provided the new insight into the microscopic details of the structure of anchored proteins and protein-membrane complexes. However, no interaction between anchored proteins was studied until now.
It is well established (17–26) that many membrane proteins are organized in clusters to perform their cellular function, rather than diffuse freely on the lipid membrane. A question then naturally arises as to how or why those proteins self-assemble into clusters. For transmembrane proteins, several physical models have been proposed, and the protein-protein interaction can be specific, homophilic interactions (18) or nonspecific, including depletion interactions due to the lipid osmotic pressure (27) and hydrophobic mismatch (28). Schmidt et al. (29) demonstrated that the cluster formation of transmembrane proteins can be attributed to the effects of hydrophobic mismatch (30,31). When the hydrophobic domain of transmembrane proteins does not match the thickness of the membrane hydrophobic core, clustering of proteins has been observed. Anchored proteins, such as glycosylphosphatidyl-inositol-anchored proteins, have been validated to form clusters experimentally (18,23); however, the protein-protein interaction and the mechanism of clustering are rarely studied.
In addition to the self-assembly of transmembrane proteins, it is also important and meaningful to study the cluster formation of anchored proteins, which should include the rate of clustering and the cluster formation mechanism. Coarse-grained computer simulations by others (30,32) have recently shown that curvature-inducing model proteins adsorbed on lipid membranes can experience attractive interactions that arise purely as a result of membrane curvature.
Thus, a question arises: In addition to the curvature-mediated attraction, for two anchored proteins that are lacking in specific interaction, are there any nonspecific interactions that can operate between them?
According to the literature (33,34), clustering of these proteins is often suggested to rely, at least in part, on membrane-mediated interactions, and it is postulated that the interaction between the anchored proteins and the surrounding lipid bilayer may serve to facilitate clustering, but unequivocal, quantitative data in support of these presumptions do not seem to exist. In this study, with the aid of computer simulations, we address that question, and seek to supply such data.
In this article, the dissipative particle dynamics (DPD) method, which can deal with larger length and timescales compared with the MD method, was applied to study the clustering rate and the aggregation mechanism of anchored proteins within a coarse-grained framework. The remainder of the article is organized as follows. In the next section, we propose the model for anchored proteins and lipids and describe the simulation method. Then the results and discussion are presented, which is followed by a brief summary of the main conclusions.
Model and Simulation Method
Coarse-grained model
Different molecules in this work, including lipids, proteins, and water, are modeled by a set of coarse-grained beads. There are three types of beads: water beads (labeled W); hydrophilic beads (labeled H) that model either the headgroup of the lipids or the hydrophilic part of proteins; and hydrophobic beads (labeled T) that model the tailgroup of the lipids and the hydrophobic part of the proteins. The model of the lipids is composed of three head beads and two tail chains with equal length (see Fig. 1 A) in the system, which correspond to a dimyristoyl-phosphatidylcholine phospholipid (35). There are five beads in each tail chain that are connected with spring forces, and forces constraining the variation of the bond angles are also added to make the chain rigid.
Figure 1.
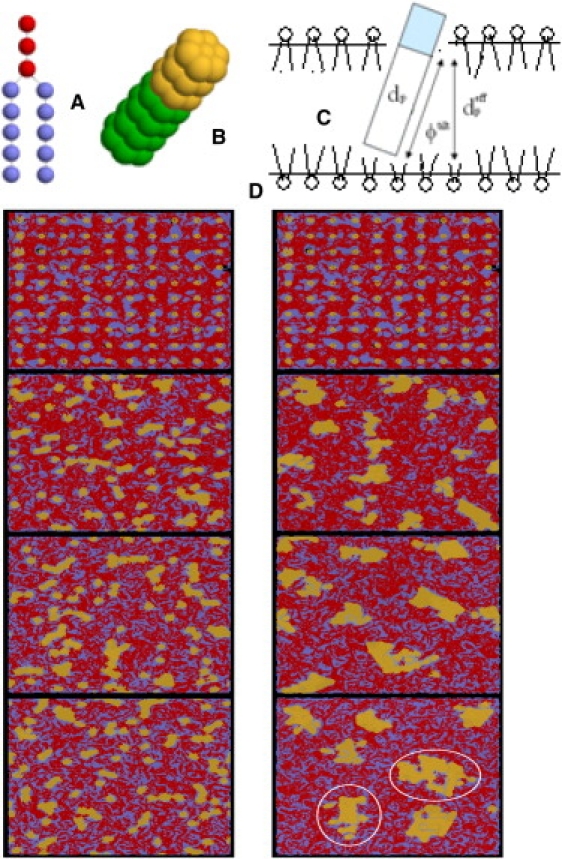
Schematic drawings of (A) the model of lipid molecules, and (B) the model of anchored proteins (nt = 4). (C) Schematic drawing of the membrane with a model protein embedded, the protein hydrophobic length dp, the effective hydrophobic length , and the tilt angle ϕtilt. (D) Typical snapshots during the processes of cluster formation of different anchored proteins with nt = 3 (left) and nt = 7 (right) at time steps of 0, 1.5 × 10⁵, 3.5 × 10⁵, and 5 × 10⁵, respectively, from top to bottom. The red beads represent hydrophilic heads of the lipid molecules and the blue beads represent hydrophobic tails. The yellow beads represent the hydrophilic groups of the protein and the green beads represent the hydrophobic groups. The white circles highlight domains formed by the several small clusters. Water beads are not shown for clarity.
The anchored protein in our work is modeled as a rodlike object with no appreciable internal flexibility. This model is on the analogy of the model transmembrane protein of Venturoli et al. (31). An anchored protein is composed of a bundle of seven amphiphatic bead chains, in which each chain is built by connecting three head beads and nt tail beads. Note that in this kind of model the part of proteins outside the membrane was simplified because we focus on the influence of anchored proteins on the membrane deformation. In each model protein, the center chain is surrounded by another six chains, and all the beads of the chain are linked to the neighboring ones by spring forces to form a relatively rigid body. To study the influence of the hydrophobic length of anchored proteins on the protein-membrane interaction and the clustering rate, we have chosen proteins composed of the chains with different numbers of hydrophobic beads, such as nt = 2, 3, 4, 5, 6, 7, and 8 (see Fig. 1 B).
In a simulation box with the size of 50 × 50 × 30, a bilayer formed by 3100 lipid molecules was prepared with its surface perpendicular to z axis, and located at the middle of simulation box. Equal water beads were randomly inserted above and below the bilayer, and the corresponding density of the whole system was set to 3.0. At the simulation temperature T = 1.0, a simulation of 50,000 time steps was performed to equilibrate the predefined initial configuration and the surface tension of the membrane is nearly zero. Fig. 1 C shows part of the initial configuration used in our work. To describe the position and orientation of the proteins with respect to the membrane, the protein hydrophobic length dp, the effective hydrophobic length , and the tilt angle ϕtilt are calculated (see Fig. 1 C). Another important variable, the penetration depth of an anchored protein, is defined as the distance from the bottom of the protein to the unperturbed surface of the membrane. The monolayer of the bilayer in which the protein hydrophilic part resides is called the upper monolayer (as opposed to the other monolayer, the lower).
Dissipative particle dynamics method
The dissipative particle dynamics (DPD) method was first introduced to simulate the hydrodynamic behavior of complex fluids (36–38). Recently, it has been applied to study a variety of amphiphilic systems (39–52). The elementary units of DPD simulations are soft beads whose dynamics are governed by Newton's equation of motion similar to MD simulation. The interparticle force exerted on a particle is composed of conservative, dissipative, and random forces. The conservative force between particles i and j is soft repulsion acting along the line of the particle centers and is determined by
| (1) |
where aij is the maximum repulsive strength between particles i and j, rij = rj − ri (ri and rj are the positions of particles i and j), rij = |rij|, = rij|rij|, and rc is the interaction range. The parameters described the interactions between different beads were derived from the study of Venturoli et al. (31). In this system, the interaction parameters between the same bead types aTT = aWW = 25 and aHH = 35, and between the different bead types aTW = aHT = 80 and aHW = 15, were set. Although some atomistic details are sacrificed during this coarse-graining procedure, the essential thermodynamics of the system is reproduced by the simulation model and the parameter set (36,37).
As usual, we have chosen the interaction cutoff rc, the particle mass, and the thermostat temperature kBT to unity, i.e., rc = m = kBT = 1. To map rc to its actual physical size according to the coarse-grained level, we used the formula proposed by Groot and Rabone (53),
In the formula, Nm is the number of water molecules represented by a DPD bead and ρ is the density, i.e., the number of DPD beads per cube of volume rc3. It is assumed that Nm = 3, ρ = 3.0, and a water molecule has approximately a volume of 30 cubic Ångstroms. Hence, we obtain that rc is 6.46 Ångstroms according to the formula. As a result, membrane thickness (only the hydrophobic core is taken into account) is 21.66 Ångstroms and the half is 10.83 Ångstroms, which is shorter than the length of the lipid tail (18.34 Ångstroms) due to the overlapping of two monolayers.
In the model of lipids and proteins, the interaction between neighboring beads along the same molecule is used by a harmonic spring force,
| (2) |
where KS is the spring constant and req is the equilibrium bond length. The numerical values of KS and req used for our simulations are 128 kBT and 0.7 rc, respectively (35). The force constraining the variation of the bond angle is given by
| (3) |
where ϕ0 is set to π and Kϕ is the bond bending force constant. In the model of lipid, the value of Kϕ is 10.0 and in the model of protein, it is 50.0 to make the protein rigid. The time evolutions of the systems were obtained from a modified version of Velocity-Verlet algorithm (37) with a time step of Δt = 0.02.
The surface tension σ of a bilayer (54,55) is directly related to the three diagonal components Pxx, Pyy, and Pzz of the z-dependent local pressure tensor P(z) by
| (4) |
The tensor P(z) has a kinetic part and an interaction part, in which the kinetic part is not computed because it does not contribute to the stress profile. To determine the pressure tensor profile along the z axis, we partitioned the simulation box into many layers, with equal thickness of Δz = rc/8, being parallel to the membrane. Thus, for each layer it begins from z and ends at z +Δz. The local pressure tensor is then given as
| (5) |
where Lx and Ly are the system box dimensions along x and y directions, respectively, and U(n) denotes n-body potential. The summation over j includes all of the interactions involving n beads, and (k, l) means summing over all possible bead pairs in the n-body interaction j. The weight function f(z1, z2, z) is defined by
| (6) |
where θ is the Heaviside function with θ(z) = 0 for z < 0, θ(z) = 1 for z > 0, and θ(z) = 1/2.
Results and Discussion
Aggregation of anchored proteins
To investigate the aggregation of anchored proteins on biomembranes, we simulated seven types of proteins with different hydrophobic lengths. The proteins are differentiated according to the number of hydrophobic beads of the chains composing the protein, e.g., nt = 2, 3, 4, 5, 6, 7, and 8. To prepare the initial configuration for every case, 100 proteins were regularly arranged on a membrane with an area of 50 × 50. For this purpose, a pure lipid bilayer with zero surface tension was first prepared by tuning the number of the lipids. Then a number of holes were dug and the proteins were inserted into the holes. For this process, a number of short simulations (in which the size of the holes can be tuned by changing the number of the deleted lipids) were performed to allow us to choose the configuration in which the surface tension was roughly closest to zero. For each protein, three independent runs were performed with different initial velocity distributions generated by different seeds of random numbers. Note that in the following section, unless indicated otherwise, all results were statistically averaged over the three runs.
Our simulation results indicate that different anchored proteins not only result in different assembly dynamics, but also different aggregation numbers. For the protein of nt = 3, typical snapshots in Fig. 1 D (left) demonstrate that the 100 proteins approach each other immediately via random collision and form small clusters with different sizes, such as dimer, trimer, and tetramer. The small clusters are obviously kinetically unstable, because they frequently form and then just as quickly break, as indicated by the snapshots. For the proteins with long hydrophobic parts, such as nt = 7, however, different assembly dynamics were observed (see, e.g., Fig. 1 D, right). In this case the self-assembly is a rather complicated process in which the clusters gradually grow via both the monomer addition and cluster fusion. Within the computation time we can afford, proteins form several stable domains that are composed of several clusters. The largest cluster in Fig. 1 D (right) is formed by 19 monomers.
The assembly process of anchored proteins can be explained in term of the time evolution of the number of clusters (see Fig. 2 A). For the anchored proteins (nt = 2, 3, and 4) whose penetration depths are less than half the membrane thickness (10.83 Ångstrom), the number of protein clusters rapidly decreases to ∼70 and lead to an equilibrium cluster size of 1.4. However, for the anchored proteins (nt = 5, 6, 7, and 8) whose penetration depths are more than half the membrane thickness, the number of protein clusters rapidly decreases within the first 1 × 10⁵ time steps and then continues to decrease at a greatly reduced rate. This is because, for the first stage, the assembly is dominated by the monomer with high diffusivity, whereas, at the end of the first stage, the monomer is depleted, and subsequently, the assembly is dominated by the cluster fusion. Hence, during the second stage, the low diffusivity of a larger cluster substantially slows down the rate of assembly. The two-stage process can be clearly identified from Fig. 2 A. The steeper slope of assembly during the first stage (within the first 1 × 10⁵ time steps) for the protein with larger hydrophobic length indicates that the larger hydrophobic length results in a stronger driving force for the assembly of proteins. Note that it is hard to confirm whether the system of the proteins with largest hydrophobic length reaches the equilibrium state or not, because the computation time for sufficient fluctuation of large clusters is beyond what we can afford.
Figure 2.
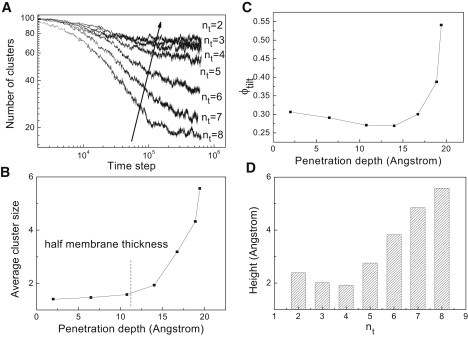
(A) The time evolutions of the number of clusters (including monomer) for anchored proteins with different hydrophobic lengths. (B) The average cluster size of anchored proteins as a function of penetration depth. The dash line indicates half the membrane thickness. (C) The angle ϕtilt of anchored proteins with respect to the membrane normal. (D) The height of the protein hydrophobic part above the membrane.
The aggregation number of proteins is given in Fig. 2 B as a function of their penetration depths. It indicates the trend of self-assembly is rather weak for shallowly inserted proteins (e.g., nt = 2, 3, and 4), whereas there is significant aggregation for more deeply inserted proteins (e.g., nt = 5, 6, 7, and 8). This obviously agrees with the observation in Fig. 2 A. More significantly, it is concluded from Fig. 2 B that when the penetration depth is less than half the membrane thickness, the average cluster size is small and does not changes much with the penetration depth. However, when the penetration depth is greater than half the membrane thickness, there is a rapid increase for the average cluster size as the penetration length increases.
In general, the rate and extent of clustering is dependent on the hydrophobic lengths of anchored proteins embedded in the membrane. The hydrophobic lengths, or more appropriately, the penetration length, substantially affect the assembly kinetics and aggregate number, especially when the penetration depth is more than half the membrane thickness. The cluster formation mechanism will be discussed in the following section.
Cluster formation mechanism
To reveal the mechanism of the cluster formation of anchored proteins, we examined the interaction between the proteins and the membrane in which they embed by performing constrained DPD simulations. For each simulation run, 25 embedded proteins were regularly arranged into the prepared membrane as the initial configuration. The surface tension was finely tuned to close to zero by changing the number of the lipids. During the constrained DPD simulations, the center of mass (COM) of each protein was kept fixed in the x and y directions. The constraint was implemented by adding two virtual forces and on each bead i of the protein. The virtual forces were determined by
| (7) |
where is the component of the interaction force between the beads i belonging to the protein and its neighbor j in α direction, Nprotein is the total number of beads for the protein, and α represents x or y direction. Except for the constraint of the COM of proteins in x and y directions, the evolution of the system is the same as for the normal DPD simulation. With the imposed constraints, the movement of proteins along the membrane was arrested, while the local deformations of the membrane due to the insertion of the proteins were not perturbed.
To consider the influence of the protein hydrophobic length, a number of the constrained DPD simulations were performed for proteins with different hydrophobic length, such as nt = 2, 3, 4, 5, 6, 7, and 8. Below is our detailed analysis on the simulation results.
Local membrane perturbations caused by anchored proteins
Fig. 2 C shows the effects of penetration depth for an anchored protein on the tilting angle between the protein and the bilayer normal. Note that all results were statistically averaged over the 25 proteins. It is found from the figure that the proteins of nt < 6 do not tilt, basically, because their penetration depths are shorter than or nearly equal to half the membrane thickness. For other proteins with penetration depths being larger than half the membrane thickness, they do tilt toward the membrane, and the tilting angle sharply increases with the extent of the deviation between the protein penetration depth and half the membrane thickness. As demonstrated below, the protein tilt mainly results from the protein alleviating its own perturbation on the lower monolayer of the membrane. However, if an anchored protein, such as nt = 8, is too long to be accommodated in the membrane when oriented perpendicular to the membrane surface, the protein tilt is mainly a result of having to avoid unfavorable exposure to a hydrophilic environment.
Although the anchored proteins are found to tilt, to relax their perturbation on the membrane structure (as shown in Fig. 2 C), the insertion of those proteins does cause a degree of local deformation of the membrane. Fig. 3 shows the calculated profiles of the hydrophobic surfaces for the upper and lower monolayers (relative to the upper end of the protein hydrophobic parts), respectively, as a function of the distance from the COM of proteins. For convenience, the actual and effective lengths of the hydrophobic part (dp and ) and the penetration depth of proteins are also shown in the figure to describe the location of the proteins and the membrane deformation. Note that because of the protein tilting, the profile of membrane thickness (only hydrophobic parts were taken into account), which is shown in the inset of Fig. 3, cannot be calculated directly from the profiles for the upper and lower monolayers.
Figure 3.
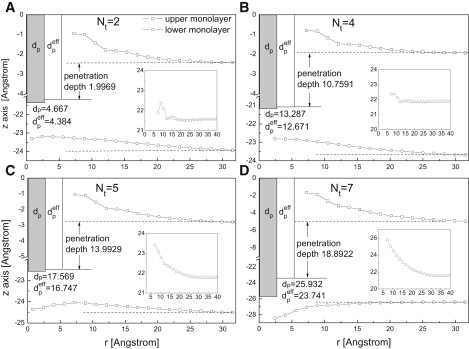
The locations for the upper and lower monolayer as a function of the distance from the center of proteins. Insets show the thickness of the membrane. Shaded area represents the measured protein hydrophobic length dp, and open area represents the effective protein hydrophobic length . The penetration depths of different proteins are also shown in the figures. The zero point of the perpendicular axis represents the highest point of the protein hydrophobic parts.
For all cases we studied, the proteins show a tendency to protrude from the upper monolayer due to the extrusion effects imposed by surrounding lipids (see Fig. 2 D), and to cover the hydrophobic part of the proteins the lipids in the upper monolayer form a bulge structure (see Fig. 3). The perturbations induced by the proteins are local and decay, and the membrane thickness returns to its unperturbed value at a distance of ∼30 Å from the protein. Fig. 3, A and B shows that the height of the bulge structure weakly varies with the penetration depth when the depth is less than half the membrane thickness. However, when the penetration depth is greater than half the membrane thickness (see Fig. 3, C and D), the height of the bulge structure strongly increases with the penetration depth—which is in similarity to the trend shown by the results of the tilting angle (see Fig. 2 C).
Compared with the upper monolayer, the perturbations of the lower monolayer induced by the insertion of anchored proteins show different behaviors. For the protein of nt = 2 (see Fig. 3 A), the lower monolayer bends toward the protein. This is mainly because the space below the short proteins needs to be filled by lipids both from the upper and lower monolayers. For the protein of nt = 4, a similar trend is found (see Fig. 3 B), although only the lipids of the lower monolayer participate in filling the space. When nt = 5, the protein hydrophobic length is somewhat longer than half the membrane thickness, and the lower monolayer becomes basically flat (see Fig. 3 C), because of the length match between the penetration depth and half the membrane thickness. For the proteins with hydrophobic length being much longer than half the membrane thickness, such as nt = 7, the lower monolayer plumps up (see Fig. 3 D) and a significantly negative curvature is generated, because of the steric repulsion induced by the protein.
Surface energy due to the perturbation on the membrane thickness
For a bilayer composed of two monolayers, there is coupling of the two monolayers (56) because of their chain interdigitation. In this study, the upper and lower monolayers are found to be deformed by the anchored proteins in different ways. However, the strong intermonolayer coupling implies that the overall perturbation induced by an anchored protein can be characterized by the thickness of the membrane. The membrane thickness near the protein was calculated and shown in the inset of Fig. 3. The results in general indicate little perturbation of membrane thickness for a shallowly inserted protein (e.g., nt = 2, 3, and 4), but there is significant perturbation for a more deeply inserted protein (e.g., nt = 5, 6, 7, and 8).
Our above results demonstrate that the insertion of anchored proteins results in a region of membrane with an unfavorable curvature (30) to surround the proteins. Hence, the area of the region with unfavorable curvature, which can be roughly characterized by the deformation of the membrane thickness, induces an increase in surface energy. In addition, the thickness mismatch between the deformed and the undeformed bilayers gives rise to an energy cost. To reduce the area with unfavorable curvature, the proteins tend to aggregate to share it. In this way, the deformation of the interface will then react upon the proteins with effective forces that aim to reach a minimum surface energy (which therefore corresponds to the aggregation of anchored proteins). As is shown in Fig. 3, the perturbation on membrane thickness is found to increase significantly, as the penetration depth exceeds half the membrane thickness. This is the reason why the penetration depth substantially affects the assembly kinetics and aggregate number when the penetration depth is greater than half the membrane thickness.
Entropy loss due to conformational constraints
In addition to the deformation of the membrane, we also studied the arrangement of the lipid chains near the protein, and its deviation from the symmetrical lipid bilayer in which the protein-induced perturbation is absent. An order parameter, S(r), is defined here to depict the arrangement of lipids as
| (8) |
where θ is the angle of lipid hydrophobic chain with respect to the bilayer normal. S(r) has the value of 1 if the chain is on average parallel to the bilayer normal, and −0.5 if the chain is on average parallel to the bilayer plane. The simulation results (see Fig. 4 A) show that, in the upper monolayer, the order parameter of lipids surrounding the proteins is larger than that of the pure lipid bilayer. It means that the lipids around the proteins are more nearly parallel to the bilayer normal, and that they arrange themselves in a more orderly manner, due to the presence of the proteins. This observation is similar to the one made by Schmidt et al. (29) in regard to the effect of the transmembrane proteins on the lipid arrangements, when the hydrophobic length is longer than the membrane thickness.
Figure 4.
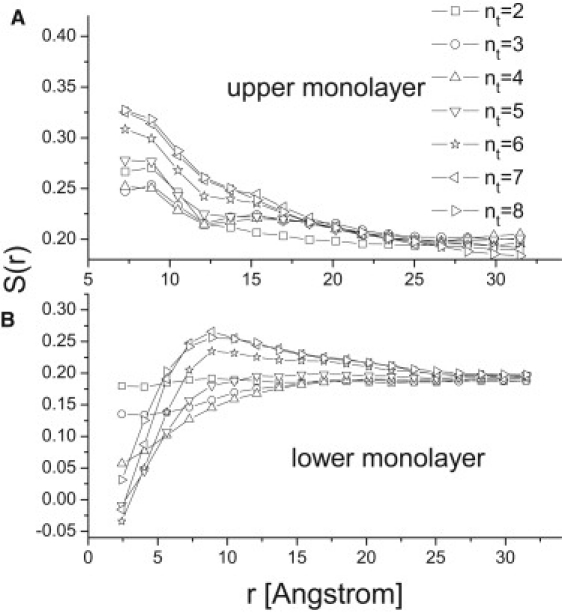
The order parameter S(r) of lipids in (A) the upper monolayer and (B) lower monolayer as a function of the distance r from the upper and lower hydrophobic surfaces of anchored proteins, respectively.
The order parameter for the lipids in the lower monolayer behaves completely differently from that in the upper monolayer. Fig. 4 B shows the order parameters of lipids surrounding the proteins in the lower monolayer. For the protein of nt < 5, the order parameter of surrounding lipids is not significantly changed. The order parameters decay monotonously, and are found to be less than that of the pure lipid bilayer. However, when the protein penetration depths are much longer than half the membrane thickness (e.g., nt = 6, 7, and 8), the order parameters of the lipids in the lower monolayer no longer decay monotonously. Instead, they first increase to a maximum value and then decrease as the distance from the proteins increases. This is because the lipids below or nearest to the proteins have to tilt significantly to adapt to the intrusion of the protein into the lower monolayer. In the domain next nearest to the proteins, they tend to parallel with the orientation of the proteins, similar to their orientations in the upper monolayer.
The above simulation results show that the order parameters of lipids are changed by the insertion of an anchored protein. When the anchored protein deeply penetrates the bilayer, the trend of order parameters indicates that the conformation of lipid chains both in the upper and opposing leafs would be significantly restricted. Thus, lipids surrounding the deeply inserted proteins have lower entropy due to their constrained configuration as compared to their counterparts in an unperturbed bilayer. This decrease in entropy may be expected to drive a clustering of anchored proteins, similar to the formation of oil droplet in aqueous mixtures. However, if its penetration depth is less than half the membrane thickness, the conformational freedom of the lipid tails in the lower monolayer will not be affected significantly by the anchored protein.
In addition to the entropy loss from the constraints on the lipid conformations surrounding an anchored protein, there is another source of entropy loss if the penetration depth of the anchored protein exceeds half the membrane thickness. In this case, the internal degrees of freedom in the lower monolayer of the fluidlike lipid membrane can be further constrained by the upper monolayer due to the protein coupling the two monolayers. Thus, there exists an enhanced coupling between the two monolayers if the protein deeply penetrates the bilayer. Consequently, the entropic cost due to the loss of the internal degrees of freedom of the bilayer may drive the aggregation of anchored proteins.
In general, in this section we studied how the insertion of an anchored protein deforms the upper and lower monolayers, separately and differently. The intermonolayer coupling of the upper and lower monolayers makes the membrane thickness a good indicator of the membrane deformation induced by the insertion of anchored proteins. Studies on the local structures of membranes indicate weak perturbation of bilayer thickness for a shallowly inserted protein, while there is significant perturbation for a more deeply inserted protein. The mechanism of membrane-mediated protein-protein interaction is twofold. One is the entropy loss caused both by the conformation restriction for the lipid chains surrounding the proteins and by the enhanced intermonolayer coupling for deeply inserted proteins. This decrease in entropy may be expected to drive a clustering of anchored proteins. The other is the perturbation of membrane thickness due to the insertion anchored proteins. The thickness mismatch between the protein and the bilayer as well as the thickness mismatch between the deformed and undeformed bilayers give rise to an energy cost. The mismatch would then cause the aggregation of anchored proteins.
Comparison with transmembrane protein
The cluster formation mechanism of anchored proteins in our work is ascribed to the different local perturbations on the upper and lower monolayers and the intermonolayer coupling. The mechanism is different from that of hydrophobic mismatch (31) for transmembrane protein (see Fig. 5, A and B). As a comparison with the anchored proteins, we also simulated the self-assembly of the transmembrane proteins with different hydrophobic lengths and the same hydrophilic parts. The transmembrane protein model is similar to that of the anchored protein, except that there are two hydrophilic parts at both ends of the protein. Seven different proteins with different hydrophobic lengths, i.e., nt = 4, 5, 6, 7, 8, 9, and 10, were simulated in the same conditions as those for anchored proteins. The aggregation kinetics is shown in Fig. 5 C. Obviously, the dynamics and aggregation number depends on the extent of hydrophobic mismatch, which is agreement with the work of Schmidt et al. (29).
Figure 5.
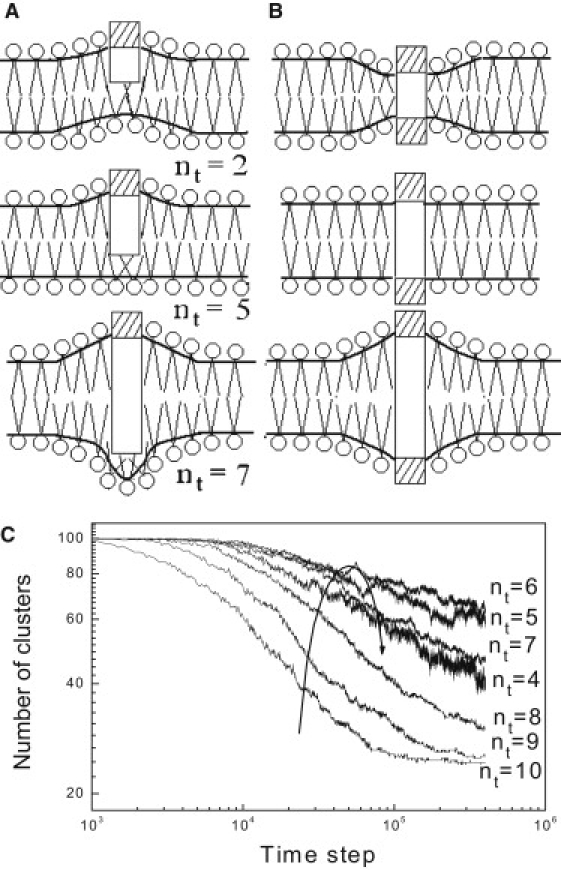
Schematic drawings of (A) the membrane deformation for anchored proteins with different penetration depths, and (B) the membrane deformation caused by transmembrane proteins with negative, zero, and positive hydrophobic mismatches, respectively. The rod with a single head represents anchored protein and the rod with two heads represents transmembrane protein. The small open circles represent headgroups of lipids and the lines are tailgroups. (C) The time evolutions of the number of clusters (including monomer) of transmembrane proteins with different hydrophobic lengths. The results are averaged over three independent runs.
The aggregate mechanism for anchored proteins and that for transmembrane proteins are in fact different, as is schematically shown in Fig. 5, A and B. When compared to the membrane deformations by anchored proteins (see Fig. 5 A), it is found that for the transmembrane proteins, the symmetry of their structures imposes the same influence on both leaflets of the membrane (see Fig. 5 B). For anchored proteins, they perturb the upper and lower monolayer, separately and differently. Moreover, for a transmembrane protein, to match the hydrophobic length of the protein and the hydrophobic thickness of the membrane it embeds, the membrane would be deformed regardless of whether the protein is too long or too short to be accommodated. For an anchored protein, only when the protein deeply penetrates the membrane would the structure of the lower monolayer be significantly deformed.
For the two kinds of proteins, their different lipid-protein interactions result in different cluster formation mechanisms. The cluster formation mechanism of transmembrane proteins was ascribed to hydrophobic mismatch (31). It suggests that mismatch between the hydrophobic surface of the transmembrane proteins and the hydrophobic interior of the membrane induces the protein clustering to minimize the effects of the mismatch. For anchored proteins, the cluster formation mechanism is ascribed to the different local perturbations on the upper and lower monolayers and the intermonolayer coupling, as was discussed above. This mechanism suggests that only when the anchored proteins deeply penetrate the bilayer, or are at least greater than half the membrane thickness, could the substantial aggregation of proteins be observed.
It is the different cluster formation mechanisms that result in the different aggregation trends between transmembrane proteins and anchored proteins. The hydrophobic mismatch, regardless of the positive or negative, favors the cluster formation of transmembrane proteins when compared with the protein with zero hydrophobic mismatch (see Fig. 5 C). In contrast, the clustering rate of anchored proteins increases monotonously with the hydrophobic length (see Fig. 2 A).
Conclusions
The cluster formation of anchored proteins embedded in the membrane has been studied in this work with the help of computer simulations. It is found from simulations that the rate and extent of clustering is dependent on the hydrophobic length, or more appropriately, the penetration length of anchored proteins in the membrane. We have quantified such clustering and explored the relationship between the protein aggregation and protein-protein interaction mediated by membrane perturbation. Our results suggest that the insertion of protein perturbs the local structure of membrane, which in turn results in the protein-protein interaction.
The cluster formation mechanism of anchored proteins in our work is ascribed to the different local perturbations on the upper and lower monolayers and the intermonolayer coupling. Only when the anchored proteins deeply penetrate the bilayer, or are at least more than half the membrane thickness, can the structure of the lower monolayer be significantly deformed. Studies on the local structures of membranes indicate weak perturbation of bilayer thickness for a shallowly inserted protein, while there is significant perturbation for a more deeply inserted protein.
There are two mechanisms of membrane-mediated protein-protein interaction. One is the entropy loss caused both by the conformation restriction for the lipid chains surrounding the proteins and by the enhanced intermonolayer coupling for a deeply inserted protein. This decrease in entropy may provide the driving force for the clustering of anchored proteins. The other mechanism is the local perturbation of the membrane thickness due to the insertion of anchored proteins. The thickness mismatch between the protein and the bilayer as well as the thickness mismatch between the deformed and undeformed bilayers give rise to an energy cost. The mismatch would then react on the proteins with effective forces aiming to reach a minimum surface energy, which then causes the aggregation of anchored proteins.
Finally, in this study we addressed the difference of cluster formation mechanisms between anchored proteins and transmembrane proteins. In our work, the cluster formation mechanism for anchored proteins is different from the mechanism of hydrophobic mismatch (31) for transmembrane proteins. This is because, for the transmembrane proteins, the symmetry of their structure imposes the same influence on both leaflets of the membrane. For anchored proteins, they deform the upper and lower monolayer separately and differently.
Acknowledgments
The authors thank the “Chemical Grid Project” of Beijing University of Chemical Technology and the Supercomputing Center, the Computer Network Information Center, and the Chinese Academy of Science for the generous allocations of computer time and excellent technical assistance.
This work was financially supported by the National Natural Science Foundation of China (grant No. 20736005 and grant No. 20876004) and the Research Foundation for Young Researchers of the Beijing University of Chemical Technology.
References
- 1.Sackmann E. Biological membranes architecture and function. In: Lipowsky R., Sackmann E., editors. Structure and Dynamics of Membranes. Elsevier Publishing; Amsterdam, The Netherlands: 1995. [Google Scholar]
- 2.Picot D., Loll P.J., Garavito R.M. The x-ray crystal structure of the membrane protein prostaglandin H2 synthase-1. Nature. 1994;367:243–249. doi: 10.1038/367243a0. [DOI] [PubMed] [Google Scholar]
- 3.Wendt K.U., Poralla K., Schulz G.E. Structure and function of a squalene cyclase. Science. 1997;277:1811–1815. doi: 10.1126/science.277.5333.1811. [DOI] [PubMed] [Google Scholar]
- 4.Binda C., Newton-Vinson P., Mattevi A. Structure of human monoamine oxidase B, a drug target for the treatment of neurological disorders. Nat. Struct. Biol. 2002;9:22–26. doi: 10.1038/nsb732. [DOI] [PubMed] [Google Scholar]
- 5.Bracey M.H., Hanson M.A., Cravatt B.F. Structural adaptations in a membrane enzyme that terminates endocannabinoid signaling. Science. 2002;298:1793–1796. doi: 10.1126/science.1076535. [DOI] [PubMed] [Google Scholar]
- 6.Williams P.A., Cosme J., McRee D.E. Mammalian microsomal cytochrome P450 monooxygenase: structural adaptations for membrane binding and functional diversity. Mol. Cell. 2000;5:121–131. doi: 10.1016/s1097-2765(00)80408-6. [DOI] [PubMed] [Google Scholar]
- 7.Bracey M.H., Cravatt B.F., Stevens R.C. Structural commonalities among integral membrane enzymes. FEBS Lett. 2004;567:159–165. doi: 10.1016/j.febslet.2004.04.084. [DOI] [PubMed] [Google Scholar]
- 8.Balali-Mood K., Bond P.J., Sansom M.S.P. Interaction of monotopic membrane enzymes with a lipid bilayer: a coarse-grained MD simulation study. Biochemistry. 2009;48:2135–2145. doi: 10.1021/bi8017398. [DOI] [PubMed] [Google Scholar]
- 9.Fowler P.W., Coveney P.V. A computational protocol for the integration of the monotopic protein prostaglandin H2 synthase into a phospholipid bilayer. Biophys. J. 2006;91:401–410. doi: 10.1529/biophysj.105.077784. [DOI] [PMC free article] [PubMed] [Google Scholar]
- 10.Nina M., Bernèche S., Roux B. Anchoring of a monotopic membrane protein: the binding of prostaglandin H2 synthase-1 to the surface of a phospholipid bilayer. Eur. Biophys. J. 2000;29:439–454. doi: 10.1007/pl00006649. [DOI] [PubMed] [Google Scholar]
- 11.Rajamani R., Gao J.L. Balancing kinetic and thermodynamic control: the mechanism of carbocation cyclization by squalene cyclase. J. Am. Chem. Soc. 2003;125:12768–12781. doi: 10.1021/ja0371799. [DOI] [PubMed] [Google Scholar]
- 12.Schwab F., van Gunsteren W.F., Zagrovic B. Computational study of the mechanism and the relative free energies of binding of anticholesteremic inhibitors to squalene-hopene cyclase. Biochemistry. 2008;47:2945–2951. doi: 10.1021/bi702067h. [DOI] [PubMed] [Google Scholar]
- 13.Fowler P.W., Balali-Mood K., Sansom M.S. Monotopic enzymes and lipid bilayers: a comparative study. Biochemistry. 2007;46:3108–3115. doi: 10.1021/bi602455n. [DOI] [PubMed] [Google Scholar]
- 14.Pantano D.A., Klein M.L. Characterization of membrane-protein interactions for the leucine transporter from Aquifex aeolicus by molecular dynamics calculations. J. Phys. Chem. B. 2009;113:13715–13722. doi: 10.1021/jp901840u. [DOI] [PubMed] [Google Scholar]
- 15.Ollila O.H.S., Risselada H.J., Marrink S.J. 3D pressure field in lipid membranes and membrane-protein complexes. Phys. Rev. Lett. 2009;102:078101. doi: 10.1103/PhysRevLett.102.078101. [DOI] [PubMed] [Google Scholar]
- 16.Periole X., Huber T., Sakmar T.P. G Protein-coupled receptors self-assemble in dynamics simulations of model bilayers. Langmuir. 2007;23:12617–12623. doi: 10.1021/ja0706246. [DOI] [PubMed] [Google Scholar]
- 17.Fukuda M., Kanno E., Mikoshiba K. Mechanism of the SDS-resistant synaptotagmin clustering mediated by the cysteine cluster at the interface between the transmembrane and spacer domains. J. Biol. Chem. 2001;276:40319–40325. doi: 10.1074/jbc.M105356200. [DOI] [PubMed] [Google Scholar]
- 18.Garcia M., Mirre C., Le Bivic A. GPI-anchored proteins associate to form microdomains during their intracellular transport in Caco-2 cells. J. Cell Sci. 1993;104:1281–1290. doi: 10.1242/jcs.104.4.1281. [DOI] [PubMed] [Google Scholar]
- 19.Kanazawa K., Kudo A. Self-assembled RANK induces osteoclastogenesis ligand independently. J. Bone Miner. Res. 2005;20:2053–2060. doi: 10.1359/JBMR.050706. [DOI] [PubMed] [Google Scholar]
- 20.Navaratnam D., Bai J.P., Santos-Sacchi J. N-terminal-mediated homomultimerization of prestin, the outer hair cell motor protein. Biophys. J. 2005;89:3345–3352. doi: 10.1529/biophysj.105.068759. [DOI] [PMC free article] [PubMed] [Google Scholar]
- 21.Neumann-Giesen C., Falkenbach B., Tikkanen R. Membrane and raft association of reggie-1/flotillin-2: role of myristoylation, palmitoylation and oligomerization and induction of filopodia by overexpression. Biochem. J. 2004;378:509–518. doi: 10.1042/BJ20031100. [DOI] [PMC free article] [PubMed] [Google Scholar]
- 22.Petersen N.O., Brown C., Wiseman P.W. Analysis of membrane protein cluster densities and sizes in situ by image correlation spectroscopy. Faraday Discuss. 1999;111:289–305. doi: 10.1039/a806677i. [DOI] [PubMed] [Google Scholar]
- 23.Ronzon F., Desbat B., Roux B. Structure and orientation of a glycosylphosphatidyl inositol anchored protein at the air/water interface. J. Phys. Chem. B. 2002;106:3307–3315. [Google Scholar]
- 24.Sieber J.J., Willig K.I., Lang T. Anatomy and dynamics of a supramolecular membrane protein cluster. Science. 2007;317:1072–1076. doi: 10.1126/science.1141727. [DOI] [PubMed] [Google Scholar]
- 25.Uhles S., Moede T., Leibiger I.B. Isoform-specific insulin receptor signaling involves different plasma membrane domains. J. Cell Biol. 2003;163:1327–1337. doi: 10.1083/jcb.200306093. [DOI] [PMC free article] [PubMed] [Google Scholar]
- 26.Willig K.I., Rizzoli S.O., Hell S.W. STED microscopy reveals that synaptotagmin remains clustered after synaptic vesicle exocytosis. Nature. 2006;440:935–939. doi: 10.1038/nature04592. [DOI] [PubMed] [Google Scholar]
- 27.Stradner A., Sedgwick H., Schurtenberger P. Equilibrium cluster formation in concentrated protein solutions and colloids. Nature. 2004;432:492–495. doi: 10.1038/nature03109. [DOI] [PubMed] [Google Scholar]
- 28.Dan N., Pincus P., Safran S.A. Membrane-induced interactions between inclusions. Langmuir. 1993;9:2768–2771. [Google Scholar]
- 29.Schmidt U., Guigas G., Weiss M. Cluster formation of transmembrane proteins due to hydrophobic mismatching. Phys. Rev. Lett. 2008;101:128104. doi: 10.1103/PhysRevLett.101.128104. [DOI] [PubMed] [Google Scholar]
- 30.Botelho A.V., Huber T., Brown M.F. Curvature and hydrophobic forces drive oligomerization and modulate activity of rhodopsin in membranes. Biophys. J. 2006;91:4464–4477. doi: 10.1529/biophysj.106.082776. [DOI] [PMC free article] [PubMed] [Google Scholar]
- 31.Venturoli M., Smit B., Sperotto M.M. Simulation studies of protein-induced bilayer deformations, and lipid-induced protein tilting, on a mesoscopic model for lipid bilayers with embedded proteins. Biophys. J. 2005;88:1778–1798. doi: 10.1529/biophysj.104.050849. [DOI] [PMC free article] [PubMed] [Google Scholar]
- 32.Reynwar B.J., Illya G., Deserno M. Aggregation and vesiculation of membrane proteins by curvature-mediated interactions. Nature. 2007;447:461–464. doi: 10.1038/nature05840. [DOI] [PubMed] [Google Scholar]
- 33.Gil T., Ipsen J.H., Zuckermann M.J. Theoretical analysis of protein organization in lipid membranes. Biochim. Biophys. Acta. 1998;1376:245–266. doi: 10.1016/s0304-4157(98)00022-7. [DOI] [PubMed] [Google Scholar]
- 34.Owicki J.C., McConnell H.M. Theory of protein-lipid and protein-protein interactions in bilayer membranes. Proc. Natl. Acad. Sci. USA. 1979;76:4750–4754. doi: 10.1073/pnas.76.10.4750. [DOI] [PMC free article] [PubMed] [Google Scholar]
- 35.Kranenburg M., Nicolas J.P., Smit B. Comparison of mesoscopic phospholipid-water models. Phys. Chem. Chem. Phys. 2004;6:4142–4151. [Google Scholar]
- 36.Español P., Warren P. Statistical-mechanics of dissipative particle dynamics. Europhys. Lett. 1995;30:191–196. [Google Scholar]
- 37.Groot R.D., Warren P.B. Dissipative particle dynamics: bridging the gap between atomistic and mesoscopic simulation. J. Chem. Phys. 1997;107:4423–4435. [Google Scholar]
- 38.Hoogerbrugge P.J., Koelman J.M.V.A. Simulating microscopic hydrodynamic phenomena with dissipative particle dynamics. Europhys. Lett. 1992;19:155–160. [Google Scholar]
- 39.Gao L.H., Lipowsky R., Shillcock J. Tension-induced vesicle fusion: pathways and pore dynamics. Soft Matter. 2008;4:1208–1214. doi: 10.1039/b801407h. [DOI] [PubMed] [Google Scholar]
- 40.Gao L.H., Shillcock J., Lipowsky R. Improved dissipative particle dynamics simulations of lipid bilayers. J. Chem. Phys. 2007;126:015101. doi: 10.1063/1.2424698. [DOI] [PubMed] [Google Scholar]
- 41.Grafmüller A., Shillcock J., Lipowsky R. Pathway of membrane fusion with two tension-dependent energy barriers. Phys. Rev. Lett. 2007;98:218101. doi: 10.1103/PhysRevLett.98.218101. [DOI] [PubMed] [Google Scholar]
- 42.Kranenburg M., Smit B. Phase behavior of model lipid bilayers. J. Phys. Chem. B. 2005;109:6553–6563. doi: 10.1021/jp0457646. [DOI] [PubMed] [Google Scholar]
- 43.Kranenburg M., Venturoli M., Smit B. Molecular simulations of mesoscopic bilayer phases. Phys. Rev. E Stat. Nonlin. Soft Matter Phys. 2003;67:060901. doi: 10.1103/PhysRevE.67.060901. [DOI] [PubMed] [Google Scholar]
- 44.Kranenburg M., Venturoli M., Smit B. Phase behavior and induced interdigitation in bilayers studied with dissipative particle dynamics. J. Phys. Chem. B. 2003;107:11491–11501. [Google Scholar]
- 45.Kranenburg M., Vlaar M., Smit B. Simulating induced interdigitation in membranes. Biophys. J. 2004;87:1596–1605. doi: 10.1529/biophysj.104.045005. [DOI] [PMC free article] [PubMed] [Google Scholar]
- 46.Li S.Y., Zhang X.R., Wang W. Computer simulations of solute exchange using micelles by a collision-driven fusion process. Langmuir. 2008;24:9344–9353. doi: 10.1021/la801521b. [DOI] [PubMed] [Google Scholar]
- 47.Li S.Y., Zhang X.R., Wang W.C. Coarse-grained model for mechanosensitive ion channels. J. Phys. Chem. B. 2009;113:14431–14438. doi: 10.1021/jp9053567. [DOI] [PubMed] [Google Scholar]
- 48.Li S.Y., Zheng F.X., Wang W. Stability and rupture of archaebacterial cell membrane: a model study. J. Phys. Chem. B. 2009;113:1143–1152. doi: 10.1021/jp808079h. [DOI] [PubMed] [Google Scholar]
- 49.Malfreyt P., Tildesley D.J. Dissipative particle dynamics simulations of grafted polymer chains between two walls. Langmuir. 2000;16:4732–4740. [Google Scholar]
- 50.Rekvig L., Frenkel D. Molecular simulations of droplet coalescence in oil/water/surfactant systems. J. Chem. Phys. 2007;127:134701. doi: 10.1063/1.2780865. [DOI] [PubMed] [Google Scholar]
- 51.Shillcock J.C., Lipowsky R. Equilibrium structure and lateral stress distribution of amphiphilic bilayers from dissipative particle dynamics simulations. J. Chem. Phys. 2002;117:5048–5061. [Google Scholar]
- 52.Shillcock J.C., Lipowsky R. Tension-induced fusion of bilayer membranes and vesicles. Nat. Mater. 2005;4:225–228. doi: 10.1038/nmat1333. [DOI] [PubMed] [Google Scholar]
- 53.Groot R.D., Rabone K.L. Mesoscopic simulation of cell membrane damage, morphology change and rupture by nonionic surfactants. Biophys. J. 2001;81:725–736. doi: 10.1016/S0006-3495(01)75737-2. [DOI] [PMC free article] [PubMed] [Google Scholar]
- 54.Goetz R., Lipowskya R. Computer simulations of bilayer membranes: self-assembly and interfacial tension. J. Chem. Phys. 1998;108:7397–7409. [Google Scholar]
- 55.Hong B.B., Qiu F., Yang Y. Budding dynamics of individual domains in multicomponent membranes simulated by N-varied dissipative particle dynamics. J. Phys. Chem. B. 2007;111:5837–5849. doi: 10.1021/jp066046h. [DOI] [PubMed] [Google Scholar]
- 56.Hansen P.L., Miao L., Ipsen J.H. Fluid lipid bilayers: intermonolayer coupling and its thermodynamic manifestations. Phys. Rev. E Stat. Phys. Plasmas Fluids Relat. Interdiscip. Topics. 1998;58:2311–2324. [Google Scholar]