

Abstract
A fusion pore composed of lipid is an obligatory kinetic intermediate of membrane fusion, and its formation requires energy to bend membranes into highly curved shapes. The energetics of such deformations in viral fusion is well established, but the role of membrane bending in Ca2+-triggered exocytosis remains largely untested. Amperometry recording showed that during exocytosis in chromaffin and PC12 cells, fusion pores formed by smaller vesicles dilated more rapidly than fusion pores formed by larger vesicles. The logarithm of 1/(fusion pore lifetime) varied linearly with vesicle curvature. The vesicle size dependence of fusion pore lifetime quantitatively accounted for the nonexponential fusion pore lifetime distribution. Experimentally manipulating vesicle size failed to alter the size dependence of fusion pore lifetime. Manipulations of membrane spontaneous curvature altered this dependence, and applying the curvature perturbants to the opposite side of the membrane reversed their effects. These effects of curvature perturbants were opposite to those seen in viral fusion. These results indicate that during Ca2+-triggered exocytosis membrane bending opposes fusion pore dilation rather than fusion pore formation. Ca2+-triggered exocytosis begins with a proteinaceous fusion pore with less stressed membrane, and becomes lipidic as it dilates, bending membrane into a highly curved shape.
Introduction
Lipid bilayers become highly curved during the fusion of viral membranes as well as liposomes, and evaluating the energetics of these deformations has contributed greatly to our understanding of membrane trafficking (1). However, in Ca2+-triggered exocytosis the role of membrane bending has been more difficult to address experimentally. Thus, we cannot judge the applicability to exocytosis of models that have provided a valuable conceptual framework for the investigation of other forms of membrane fusion.
Lipidic fusion pores are fusion intermediates with highly curved membrane, and deforming membranes into such an hour-glass shape requires a substantial amount of energy. By contrast, a fusion pore composed of protein can connect two membranes without bending them. Reports have indicated that the fusion pores of exocytosis could be either protein (2,3) or lipid (4), and there is as yet no consensus on this issue (1,5). The stability of a fusion pore will be sensitive to its molecular make-up, and investigating how fusion pore kinetics depend on membrane bending energetics may offer insight into the question of a fusion pore's molecular composition. Smaller vesicles have greater curvature, so studying vesicle size effects may provide clues about the role of membrane bending. Amperometry data reported in this study showed that the stability of an initial fusion pore depended strongly on vesicle size. We observed effects of curvature perturbation that were not consistent with an initial fusion pore composed of lipid, but rather suggested that an initial proteinaceous fusion pore dilates during a transition to a pore composed of lipid.
Methods
Methods for PC12 cell culture and amperometry recording follow those described previously (6). PC12 cells were plated at 1–2 × 10⁵ cells in 35-mm dishes coated with 50 μg/mL poly-D-lysine plus 50 μg/mL collagen I, and cultured in Dulbecco's modified Eagle's medium (DMEM) supplemented with 4.5 mg/mL glucose, 3.7 mg/mL NaHCO3, 5% horse serum, and 5% iron-supplemented calf serum at 37°C in a humidified 10% CO2-90% air atmosphere. PC12 cells were loaded the day before experiments with 1.5 mM norepinephrine (NE) and 0.5 mM ascorbate.
Chromaffin cells were prepared by collecting rat adrenal glands in ice cold Hanks' balanced salt solution (HBSS) (http://www.natureprotocols.com/2006/09/29/rat_chromaffin_cells_primary_c.php). Medullas were cut into small pieces and dissociated in HBSS with the additions of 2.6 mg/mL collagenase type I, 3 mg/mL bovine serum albumin, 0.15 mg/mL DNase I, and 0.15 mg/mL hyaluronidase I-S at 37°C for 25–30 min. The tissue was triturated, and after adding 10 mL cold HBSS the cell suspension was centrifuged at 800 rpm for 10 min at 4°C. Cells were resuspended in 0.8 mL DMEM + 10% fetal bovine serum and plated on glass coverslips coated with poly-D-lysine. After 1 h, 0.5 mL DMEM + 10% fetal bovine serum was added and cells were maintained at 37°C in 5% CO2-air. Culture medium was replaced every 48 h and cells were used within 1–4 days.
NE release was measured with a VA-10 amperometry amplifier (ALA Scientific Instruments, Westbury, NY) and 5-μm carbon fiber electrodes polarized to 650 mV (7). Current was filtered at 1 kHz and digitized at 4 kHz with a digidata interface and a PC running PCLAMP 8 (Molecular Devices, Union City, CA). Recordings were carried out at room temperature (20–23°C) with cells bathing in a solution containing (in mM) 150 NaCl, 4.2 KCl, 1 NaH2PO4, 0.7 MgCl2, 2 CaCl2, 10 HEPES, pH 7.4. Exocytosis was triggered by pressure ejection of a depolarizing solution or by voltage steps under voltage clamp. The depolarizing solution was applied using pressure from a Picospritzer (Parker-Hannefin, Cleveland, OH) to puff a solution identical to the bathing solution but with 105 mM KCl and 5 mM NaCl. Puffs of 6 s were applied up to five times to a cell at 1–2 min intervals from a micropipette ∼10 μm away. For cumulative spike-count plots only the first puff was used. Exocytosis was triggered in voltage clamped cells by a 6-s pulse from −80 mV to 0 mV.
Spikes and prespike feet (PSF) were analyzed with a computer program developed in this laboratory that allows semi-automated measurements of individual events (6). PSF onset was taken as the time where current rose 5×RMS above a rolling current average. Time of PSF end (spike onset) was located by fitting a line to the rising phase of a spike. PSF lifetime, τ, was taken as the intervening time interval. The total event area was taken as the integral from the PSF onset to the time where the spike current fell to 5xRMS of baseline. PSF were only analyzed if the peak of a spike was >20 pA. PSF can generally be observed with smaller spikes but the accuracy of their measurement is not as good. PSF were only analyzed with τ ≥ 0.75 ms because briefer events cannot be detected reliably.
For electron microscopy, cells on glass coverslips were fixed for 2 h with 4% paraformaldehyde and 0.1% glutaraldehyde in 0.1 M phosphate buffer pH 7.4, rinsed three times with this buffer, and dehydrated in a graded ethanol series to 100%. Samples were infiltrated with LR White (Electron Microscopy Sciences, Hatfield, PA) and embedded in gelatin. Embedding medium was polymerized for 48 h at 60°C. Areas of interest were sectioned (100 nm) to coated slot grids, and viewed with a Philips CM120 electron microscope. The computer program, Image J, was used to measure vesicle diameters.
PS content of phospholipids extracted from PC12 cells was determined using high performance liquid chromatography (8). Cell lines were prepared that overexpress PSS1, PSS2, PSS1-R95K, and PSS2-R97K by inserting the DNA into a neomycin resistance vector, transfecting PC12 cells with Lipofectamine, and growing in neomycin (9).
Results
Relating vesicle size and fusion pore stability
In amperometry recordings, the first stage of release from a vesicle is the PSF (Fig. 1 A), which reflects the low level of release as NE trickles out of a vesicle through a nascent metastable fusion pore (10–12). The PSF is followed directly by a spike, and this second stage begins with a sharp increase in NE release as a fusion pore dilates. The total content of one vesicle can be obtained by integrating the amperometric signal for an entire single-vesicle release event. This quantity, denoted here as Q (Fig. 1 A), has been shown to scale with the volume of a vesicle (13,14). Thus, a larger spike reflects the exocytosis of a larger vesicle. The duration of the PSF, denoted here as τ (Fig. 1 A), provides an estimate of the stability of the initial fusion pore. In general, little is known about the relation between vesicle content, Q, and fusion pore lifetime, τ.
Figure 1.
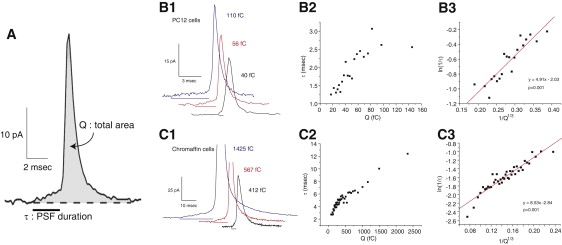
(A) An expanded view of a single-vesicle release event recorded by amperometry from a PC12 cell. The shaded region indicates the area of the entire event, which provides a measure of Q, the total vesicle content. The PSF duration, τ, indicated by the horizontal bar, is the lifetime of the initial fusion pore. Amperometry traces from PC12 cells (B1) and chromaffin cells (C1) show events with a larger Q are more likely to have longer τ. Q is stated for each displayed trace (1 C × 48,250 = mols of NE, assuming 1 mol of NE yields 2 electrons). Binning events with similar Q (50 events per bin), averaging τ for those events, and plotting shows a correlation for both PC12 cells (1163 spikes from 80 cells) (B2) and chromaffin cells (3956 spikes from 107 cells) (C2). Transforming to ln(1/τ) versus 1/Q1/3 gives linear plots for PC12 (B3) and chromaffin cells (C3).
Examining many single-vesicle release events revealed a strong correlation between Q and τ. Individual events illustrate this correlation from two different kinds of NE-releasing cells, PC12 cells and chromaffin cells. In three selected single-vesicle traces from PC12 cells (Fig. 1 B1) and chromaffin cells (Fig. 1 C1), the larger events have longer τ. Linear regression of scatter plots of Q versus τ for >1000 points for the two cell types showed the correlation to be highly significant (p < 0.0001; Fig. S1 in Supporting Material). Binning Q and averaging τ within each bin produced plots with strikingly clear correlations (Fig. 1, B2 and C2). This correlation cannot be explained by the variable distance from the release site to the amperometry electrode. If the site on the cell surface at which a particular fusion event occurs is a few micrometers farther from the recording electrode, the greater distance will reduce Q because more NE will diffuse away without striking the electrode surface. The increased distance will prolong τ, and these two potential distortions would produce a negative correlation between Q and τ rather than a positive correlation as observed. Furthermore, to minimize this form of distortion, our analysis was conducted on spikes with peak amplitudes >20 pA. PSF are well resolved in these large spikes. Simulations have shown that release from sites closer to the amperometry electrode give rise to larger, temporally sharper events (15,16), and this proximity improves NE capture while reducing temporal distortion by diffusion. Finally, we note that the vesicle content lost during the PSF is a small fraction of the total vesicle content. This fraction increased very slightly with Q (Fig. S2) in parallel with the increase in τ (Fig. 1, B2 and C2), but remained low for the entire range of Q; for the smallest vesicles this fraction was ∼0.07 in chromaffin cells. This indicates that loss of norepinephrine during long PSF will not introduce a significant sampling bias by depleting vesicles and selectively reducing the spike amplitude of events with long PSF below the 20 pA threshold used to select events for PSF analysis. Thus, the correlation between Q and τ in Fig. 1, B2 and C2, indicates that when larger vesicles fuse they form fusion pores that are more stable than the fusion pores seen with smaller vesicles. The more stable fusion pores in cell types with larger vesicles (17) may reflect an intrinsic property of vesicles as they fuse.
To gain physical insight into the nature of the correlation between τ and Q, we noted that reaction rates are generally exponential functions of energy. Thus, we transformed the y axis to ln(1/τ). A vesicle of radius Rv has a membrane curvature of 1/Rv, and because the volume of a vesicle scales with Q (13,14), the curvature of a spherical vesicle should vary as 1/Q1/3. Transforming the τ-versus-Q plots in Fig. 1, B2 and C2, to plots of ln(1/τ) versus 1/Q1/3 made them linear (Fig. 1, B3 and C3). Including a second order term (1/Q2/3) failed to improve the fits, and using only a second order term gave much poorer fits. These plots show that the relation between τ and Q has a specific functional form. It is significant that this same functional form was observed in data from both PC12 cells and chromaffin cells.
To relate fusion pore stability to membrane curvature we developed a model based on the classical theory of elastic deformations of lipid bilayers (Fig. 2 and Appendix A). This analysis considers changes in membrane bending energy associated with the remodeling of the vesicle and plasma membrane (Fig. 2 A) into highly curved membrane within the fusion pore (Fig. 2 B). For a given fusion pore radius, reducing the vesicle radius Rv increases the angle of contact, ϕ (Fig. 2 B), between the vesicle and the fusion pore. Increasing ϕ reduces the amount of highly curved membrane within the fusion pore. Appendix A develops this point to derive the following expression for the energy change, ΔE, of the transition illustrated in Fig. 2 (Eq. A9)
| (1) |
Wp′ is the limiting energy when Rv is very large. C0 is the spontaneous curvature of the lipid bilayer. Rp is the radius of the lipidic fusion pore. B is the membrane flexural rigidity; Rr and Rh are related to fusion pore geometry as defined in Appendix A and illustrated in Fig. 2 C. Taking the reaction rate as 1/τ and assuming an exponential dependence of rate on ΔE, we obtain the rate of the transition. Taking the logarithm gives (Eq. A10)
| (2) |
where A is a preexponential factor, k is the Boltzmann constant, T is temperature, and ψ is a linear scaling parameter between ΔE and the energy of the kinetic barrier of the transition.
Figure 2.
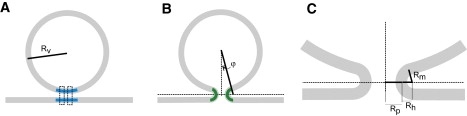
(A) Initial state of vesicle (radius Rv) and plasma membrane. The membrane to be incorporated into a fusion pore is blue. The proteinaceous pore is indicated by two dotted rectangles. (B) Vesicle and plasma membrane connected by a lipidic fusion pore (green). The dotted horizontal line indicates the plane where the pore is narrowest. (C) A blow-up of the lipidic fusion pore shows key pore dimensions including the pore radius, Rp, the horizontal extension of the pore, Rh, and the distance along a radius through the pore-vesicle junction from the vesicle membrane to the horizontal plane, Rm. Appendix A derives an expression for the elastic energy of a fusion pore using these geometric parameters.
The linear plots in Fig. 1, B3 and C3, agree with Eq. 2, providing an initial test of the theoretical model developed in Appendix A. This result suggests the existence of an elastic resistance to fusion pore dilation that is directly proportional to the membrane curvature within a lipidic fusion pore. Because a lipidic fusion pore with a smaller vesicle contains a smaller area of highly curved membrane, it will be easier to form such a pore when a vesicle is smaller, and this will shorten the lifetime of the state immediately upstream. If the PSF reports a fusion pore that evolves to a lipidic pore, then we can explain our fundamental observation of the increase in τ with Q in terms of the energetics of the configuration arrived at on termination of a PSF. The initial structure depicted in Fig. 2 A can readily incorporate a proteinaceous fusion pore. A proteinaceous pore may introduce some membrane curvature, but this curvature will be small compared to that in the lipidic pore, and the curvature of membrane around a proteinaceous pore should not depend strongly on vesicle size.
We must also consider the possibility that the PSF reports opening of a lipidic pore. If this is the case then bilayer bending mechanics would have to depend on vesicle size in a way that allows pores with smaller vesicles to expand more rapidly. A difference in the ease of expansion of lipidic fusion pores could contribute to the greater tendency of small liposomes to fuse (18). To distinguish between these two possibilities we manipulated membrane properties and vesicle size and tested the effects on exocytosis. But before presenting these results we examined the variations in vesicle size and PSF duration in more detail.
Variation in vesicle size
NE is contained within dense-core vesicles and these vesicles come in a range of sizes. To relate these size variations to variations in Q we compared the distribution of Q1/3 to the distribution of vesicle radius measured in the electron microscope (Fig. 3, A and B). In both PC12 cells and chromaffin cells Gaussian functions fitted the distributions well for both Rv and Q1/3 (Fig. 3, C and D), and the distribution of Rv was similar to that of Q1/3 after normalizing to the corresponding peaks. As noted above, amperometry events selected for analysis had peak amplitudes >20 pA. Including smaller events skewed the distribution of Q1/3 to the left and resulted in poorer Gaussian fits (data not shown). The similarities between the Q1/3 and Rv distributions indicated that selecting spikes >20 pA effectively selected events where the amperometric recording electrode efficiently captured released NE. These comparisons suggest that variations in Rv constitute the primary source of variation in Q. We exploited this parallel and converted Q1/3 to Rv by scaling according to the peaks of the Gaussian fits. We will use Rv determined from Q1/3 in this way from this point on.
Figure 3.
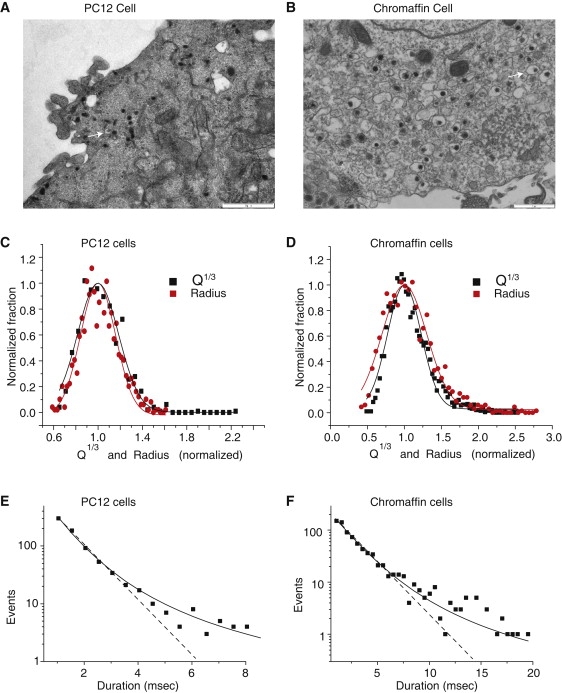
Electron micrographs of (A) PC12 cells and (B) chromaffin cells show dense-core vesicles (white arrows; scale bar = 1 μm). Distributions of Q1/3 from amperometry and vesicle radius (Rv) from electron microscopy, for (C) PC12 cells and (D) chromaffin cells. The distributions were normalized to the values at the peak (x coordinate) and maximum (y coordinate) of the fitted Gaussian. Gaussian fits gave means and standard deviations of 45.3 nm and 20.3 nm (Rv, PC12 cells); 3.53 fC1/3 and 1.84 fC1/3 (Q1/3, PC12 cells); 101.4 nm and 86.7 nm (Rv, chromaffin cells); 6.74 fC1/3 and 4.33 fC1/3 (Q1/3, chromaffin cells). Standard errors never exceeded 5% of the means. For diameters, 895 vesicles for PC12 cells and 1057 vesicles for chromaffin cells; for Q1/3 the data sets were from Fig. 1. Distributions of τ deviated from a single exponential for (E) PC12 cells and (F) chromaffin cells. The dotted line shows the exponential fit, and the solid curve shows the fit of Eq. 4 with Q01/3 and S0 fixed at the values from the fits in C and D, and β taken from the fits in Fig. 1, B3 and C3. The fits yielded α values of −1.71 ms−1 and −0.56 ms−1 for PC12 cells and chromaffin cells, respectively.
A comparison between the two cell types studied here confirmed a previously reported correlation between vesicle size and τ for three different types of cells (17). Chromaffin cells have a mean Rv of 108.9 ± 1.1 nm and a mean τ of 2.5 ± 0.01 ms. PC12 cells have a smaller mean Rv of 45.5 ± 0.2 nm and also have a smaller mean τ of 0.91 ± 0.02 ms (mean ± SE).
Distributions of τ are often fitted to an exponential (10,12,19). Although fusion pore transitions are stochastic, their lifetime distributions generally have not been evaluated critically and a recent report in chromaffin cells noted that a single exponential fitted the data poorly (20). The size dependence of τ just described should make fusion pore kinetics deviate from exponential behavior, and on close examination, our data from both PC12 cells (Fig. 3 E) and chromaffin cells (Fig. 3 F) confirmed this. To incorporate the Rv dependence into a τ distribution, we focused on the rate of exit from the open fusion pore (k = 1/τ) and invoked the linear relationship between 1/Rv and ln (1/τ) (Fig. 1, B3 and C3). Taking the exponential then gives the following expression for the rate as a function of Rv:
| (3) |
where α and β are the parameters from the fits in Fig. 1, B3 and C3. This also agrees with the theoretical model of Appendix A (Eq. A10 has the same basic form). We assume that vesicles of a given Rv will have a single-exponential distribution for τ with a decay constant given by Eq. 3. The τ distribution for the entire range of sizes can now be obtained by taking the convolution of this exponential distribution with the Gaussian distribution for Rv.
| (4) |
Taking Rv0 and S0 from the Gaussian fits (Fig. 3, C and D), Eq. 4 fitted the τ distributions quite well (Fig. 3, E and F). The only parameters varied in these fits were α and the parameter that scales p(τ) to the number of events. β was fixed to the value from the fits in Fig. 1, B3 and C3. These fits had the same number of free parameters as an exponential so the improvement provided by Eq. 4 indicates that it is a better model. Thus, an interaction between τ and Rv offers a satisfactory explanation for the nonexponential distribution of τ. These results confirm the results presented in Fig. 1 showing that τ and Rv are related by Eq. 2.
Manipulating vesicle size
Having found a relation between τ and Rv, we returned to the question of whether this relation can be used to evaluate the contribution of membrane bending energy to fusion pore kinetics. To address this question we treated chromaffin cells with reagents to alter vesicle size, and used amperometry to look for changes in the relation between τ and Rv. The results were then interpreted with the theoretical model discussed above and analyzed in Appendix A.
To alter vesicle size we treated chromaffin cells for 90 min with L-DOPA (100 μM), which increases NE loading of vesicles, and reserpine (100 nM), an uptake blocker that reduces NE loading. These manipulations have been shown to alter Q and Rv in parallel (13,14). L-DOPA increased the frequency of fusion events whereas reserpine reduced it (Fig. 4, A and B). As expected, Q was increased by L-DOPA and reduced by reserpine (Fig. 4 D). In contrast to results from PC12 cells (14), L-DOPA did not alter τ, and reserpine made τ longer rather than shorter (Fig. 4 E). Importantly, neither of these treatments altered the slope of the line obtained from plots of ln(1/τ) versus 1/Rv (Fig. 4, C and F). The small unexpected changes in the intercepts of these plots indicate an effect that is independent of membrane curvature, and as with the changes in event frequency (Fig. 4, A and B), may reflect compensatory responses of chromaffin cells. C0 should not be affected by altered vesicle loading, so it is significant that the slopes of the plots in Fig. 4 C did not change (Eq. 2). These results indicate that changing Rv independently of membrane compliance does not affect the interaction between Rv and τ.
Figure 4.
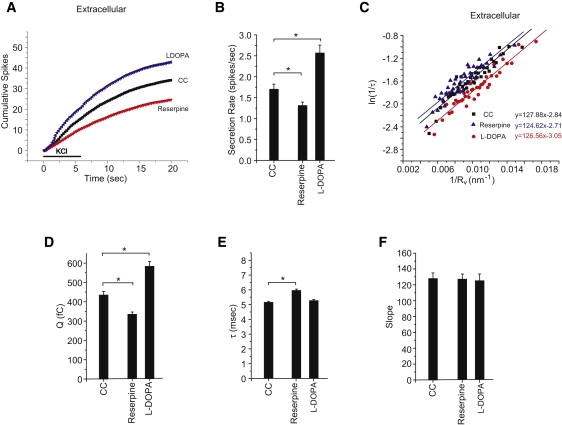
Vesicle size and exocytosis. (A) Cumulative spike-count time course in control chromaffin cells and cells treated with 100 nM reserpine or 100 μM L-DOPA (90 min each). Bar indicates depolarization with high KCl. (B) Secretion rates (spikes per cell in the first 20 s) from A. (C) ln(1/τ) versus 1/Rv plots. Q1/3 was converted to Rv using the scaling parameters from fits in Fig. 3D. Best fitting lines were drawn and stated in the corresponding color. (D) Mean Q values for each of the treatments tested in A. (E) Mean τ values. (F) Slopes from the linear fits in D. ∗Indicates p < 0.05 by the Student's t-test. For extracellular additions, 1710–3956 spikes were recorded from 104–130 cells.
Extracellular manipulation membrane spontaneous curvature
We then manipulated C0 using cone-shaped and inverted-cone-shaped amphipathic molecules that insert into lipid bilayers and perturb their structure (1). To promote positive curvature (spread the headgroups) in the outer leaflet in the plasma membrane we added 2 μM lysophosphatidylcholine (LPC, oleoyl) to the recording solution. This inverted-cone-shaped lipid penetrates a bilayer and spreads out the headgroups more than the hydrocarbon chains. To promote negative curvature (spread the hydrocarbon tails) we added 2 μM oleic acid (OA), which is cone-shaped and spreads out the hydrocarbon chains of a bilayer but not the headgroups. LPC is known to remain in the outer leaflet of a lipid bilayer for times longer than the duration of our experiments (21), and although OA does flip between the two leaflets, the results presented here were opposite to those obtained with LPC, suggesting that most of the OA remained in the plasma membrane during our experiments. The interactions of these molecules with lipid bilayers are illustrated in Fig. 5 A for a proteinaceous fusion pore and in Fig. 5 B for a lipidic fusion pore. Fig. 5, A and B, each illustrate good matches of lipid to membrane curvature on the left side of each drawing; these should stabilize a structure. The bad matches, which are destabilizing, are illustrated on the right.
Figure 5.
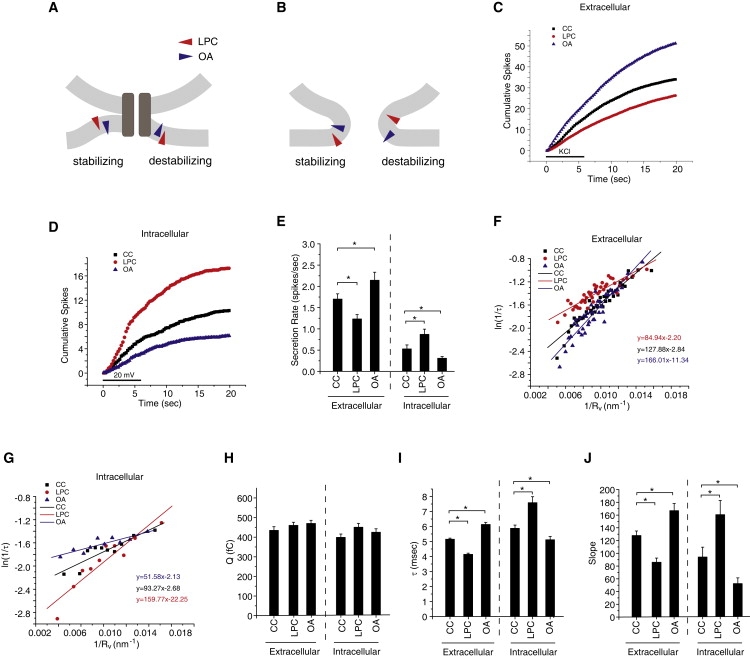
Membrane curvature and exocytosis. (A and B) Molecules with different effects on membrane curvature (colored triangles) stabilize or destabilize fusion pores depending on the side of the membrane. LPC (red) induces positive curvature by spreading the headgroups, and OA (blue) does the opposite. (A) For a proteinaceous pore, LPC induces curvature to favor a transition to a lipidic pore. OA at the same location induces curvature to oppose this transition. Presenting these molecules to the inside of a cell reverses their actions. (B) In a lipidic pore, LPC has a favorable interaction with the outside fusion pore membrane but an unfavorable interaction with the inside. OA has an unfavorable interaction with the outside but a favorable interaction with the inside. (C) Cumulative spike-count time course in control chromaffin cells and cells treated with 2 μM LPC, or 2 μM OA (added immediately before recording). The bar indicates depolarization with high KCl. (D) Cumulative spike-count time course in patch clamped chromaffin cells with control pipette solution and pipette solutions containing either 5 μM LPC or 5 μM OA. Note that patch clamping reduces secretion so control spike counts are lower in D than in B. (E) Secretion rates (spikes per cell in the first 20 s) from C and D. (F and G) ln(1/τ) versus 1/Rv plots in exocytosis. Q1/3 was converted to Rv using the scaling parameters obtained from fits in Fig. 3D. Best fitting lines were drawn and stated in the corresponding color. (H) Mean Q values for each of the treatments tested in C and D. (I) Mean τ values. (J) Slopes from the linear fits in F and G. ∗Denotes p < 0.05 by the Student's t-test. For extracellular additions, 1245–3956 spikes were recorded from 96–153 cells. For intracellular additions, 339–563 spikes were recorded from 24–25 patch-clamped cells.
Addition of 2 μM LPC to the bathing solution immediately before recording reduced the frequency of fusion events whereas 2 μM OA increased it (Fig. 5, C and E). Extracellular LPC reduced τ (Fig. 5 I) but had no effect on Q (Fig. 5 H). OA increased τ (Fig. 5 I), and also failed to alter Q (Fig. 5 H). Thus, LPC and OA both influenced fusion pore stability without changing vesicle size. In contrast to L-DOPA and reserpine, LPC and OA altered the slopes of plots of ln(1/τ) versus 1/Rv (Fig. 5, F and J). OA increased the slope and LPC reduced it. Arachidonic acid (at 2 μM), like OA, also induces negative curvature, and had similar effects on the relation between τ and Rv (data not shown). Using Eq. A11 from Appendix A, assuming C0 = 0 under control conditions, and taking Rr in the range 3–6 nm yielded a range of C0 values for each addition from the ratio of the slopes of the plots in Fig. 5 F. For LPC we obtained C0 = 0.020 to 0.039 nm−1 and for OA we obtained C0 = −0.016 to −0.032 nm−1.
These effects of LPC and OA on fusion pore kinetics can be interpreted within the framework of membrane bending energy provided that we take the lipidic fusion pore (Fig. 2B and Fig. 5B) as a model for a state immediately downstream from the fusion pore responsible for the PSF. Thus, LPC will dimple membranes to destabilize a proteinaceous fusion pore (Fig. 5 A, right) and promote the transition to a lipidic pore (Fig. 5 B). OA will bend membrane around the proteinaceous fusion pore in a direction that opposes the transition to a lipidic fusion pore. The changes in slopes in Fig. 5 F are thus consistent with the known actions of LPC and OA on membrane curvature (1,22). By contrast, if the PSF arose from a lipidic pore, LPC would stabilize it and OA would destabilize it. Thus, these results argue against the view that the increase in τ with increasing Rv reflects differences in the tendency of lipidic fusion pores to dilate when they are associated with vesicles of different sizes.
Intracellular manipulation of membrane spontaneous curvature
In the experiments described, LPC and OA were presented extracellularly by simply adding them to the bathing medium. Thus, they were incorporated into the outer leaflet of the plasma membrane. Presenting LPC and OA intracellularly will allow these reagents to enter the inner leaflet of the plasma membrane (as well as the outer leaflet of the vesicle membrane). Because these leaflets join to form the cytoplasmic face of the fusion pore, C0 will change in the opposite direction to that produced by extracellular application. LPC (5 μM) was introduced to the inside of a cell through a whole-cell patch clamp recording, allowing the LPC to diffuse into the cell. Exocytosis was then induced by voltage steps. The effects of these reagents on event frequency were reversed (Fig. 5 D) compared to extracellular application (Fig. 5 C). Note that event frequencies in Fig. 5 D were reduced for all conditions compared to Fig. 5 C because patch clamping cells reduces their exocytosis. LPC applied to the inside of the cell in this way increased τ (Fig. 5 I) as well as the slope of the plot of ln(1/τ) versus 1/Rv (Fig. 5, G and J). From the ratio of this slope to the control slope we determined a range for C0 of −0.037 to −0.076 nm−1 (with Eq. A11). Conversely, intracellular OA decreased τ (Fig. 5 I) as well as the slope (Fig. 5, G and J), and yielded a range for C0 of 0.026–0.053 nm−1.
These results are the opposite to those just described for extracellular application, and reflect the interactions of LPC and OA with the cytoplasmic face of the fusion pore. The arguments just stated for extracellular presentation of these reagents can be readily extended to intracellular presentation (Fig. 5, A and B). It is worth noting that because meridian curvature is energetically more important than parallel curvature in lipid fusion pores (23,24), positive C0 (spreading the headgroups) can be expected to reduce Wp′ (of Eq. 1 and Eq. 2), whereas negative C0 will increase Wp′. These changes in Wp′ are therefore consistent with the signs of the changes in the intercepts in Fig. 5, F and G. These experiments with intracellular LPC and OA provide additional support for the hypothesis that fusion pore bending energy acts as a vesicle size-dependent obstacle to the transition from an initial fusion pore state (signaled by the PSF) to a lipidic state. The opposite effects of OA and LPC, and the reversal of their effects on presentation to the cell interior further argue that these molecules alter fusion pores by changing C0 rather than by interacting with proteins that control fusion pores.
Phosphatidylserine in the inner leaflet of the plasma membrane
Phosphatidylserine (PS) is unusual among major naturally occurring lipids in having an inverted-cone shape and a large positive C0 (25,26). We increased the PS content in PC12 cells by either addition of PS to the culture medium, or by generating cell lines that overexpress various forms of the biosynthetic enzyme PS synthase, or by both in combination. PS levels were then measured by high performance liquid chromatography. Localization to the inner leaflet of the plasma membrane was verified by staining with Annexin-V-FITC. These manipulations of PS levels were shown not to alter Ca2+ current, vesicle size, vesicle number, or levels of other major exocytotic proteins (9). Because PS goes to the inner leaflet of the plasma membrane the positive monolayer C0 of PS induces negative bilayer C0. This experiment is comparable to the experiment described above with intracellular presentation of LPC.
Elevating PS in PC12 cells enhanced exocytosis, possibly due to enhanced Ca2+-dependent binding to synaptotagmin (9). The specific effects due to perturbation of membrane curvature are shown in plots of ln(1/τ) versus 1/Rv (Fig. 6 A). In cells with higher PS the slopes were increased in a manner consistent with a decrease in C0. For 9 different conditions of elevated PS, τ increased with PS content, as did the slope of the ln(1/τ) versus 1/Rv plots (Fig. 6 B). Eq. 2 can account for these changes through the expected decrease in C0, thus providing another validation of this model. These results thus offer independent support for the identification of the PSF with a precursor fusion pore (Fig. 5 A), and the lipidic fusion pore (Fig. 5 B) as a downstream state formed as a PSF ends and a spike begins.
Figure 6.
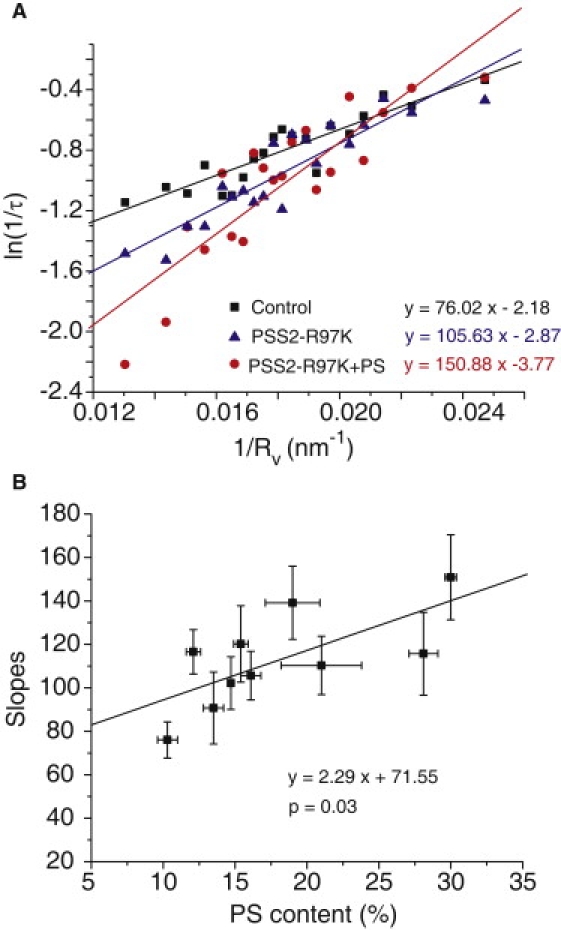
(A) Plots of ln(1/τ) versus 1/Rv for PC12 cells with different PS content. For control PC12 cells and cells expressing PS synthase 2 harboring the function enhancing mutation R97K, the PS contents were 10.7 ± 0.7% and 16.1 ± 0.7%, respectively. For cells expressing this enzyme and also treated with 100 μM PS for 1 day before recording, the PS content was 30.0 ± 0.4% (9). (B) The slopes of plots as in A were plotted versus PS content, showing a statistically significant dependence on PS content (p = 0.03).
Discussion
The results presented in this study document a strong interaction between vesicle size and fusion pore stability. The dependence of τ on vesicle size also accounted quantitatively for the nonexponential form of the τ distribution (Fig. 3, E and F). We observed a linear relation between ln(1/τ) and 1/Rv (Fig. 1, B3 and C3, Fig. 4 C, Fig. 5, F and G, and Fig. 6 B), and this result indicated that membrane curvature makes an energetic contribution to the dilation of fusion pores. A theoretical analysis suggested that this contribution arises from the bending elasticity of the membrane, which opposes formation of a lipidic fusion pore. An alternative interpretation, that the longer τ of larger vesicles reflects a vesicle size dependence for dilation of a lipidic fusion pore, is not consistent with the results of our experiments with curvature perturbants. If the PSF reflected a lipidic fusion pore then these reagents would have changed τ in the opposite direction.
Bilayer curvature perturbants have also been tested in virus-mediated membrane fusion, where the initial fusion pore is thought to be composed of lipid, and the effects on fusion pore stability were opposite to those described here for Ca2+-triggered exocytosis. In fusion pores that form during influenza virus-mediated fusion, LPC presented in a manner comparable to our extracellular application shortened the time to viral fusion, whereas here LPC slowed down exocytosis (Fig. 5 C). LPC doubled the median open time of viral fusion pores (24), but our results showed that LPC reduced fusion pore lifetimes (Fig. 5 I). Molecules that like OA promote negative C0, had effects opposite to those of LPC in viral fusion (24), and thus had effects opposite to those of OA reported here for exocytosis. Because the actions of membrane curvature perturbing molecules are viewed as some of the strongest evidence in support of the stalk/hemifusion mechanisms in viral and lipid bilayer fusion (1), the results in this study make a strong argument that Ca2+-triggered exocytosis uses a different mechanism. In contrast to viral fusion, during exocytosis the formation of the initial fusion pore requires much less bending of membrane. In exocytosis membrane bending occurs not when a fusion pore opens but when it starts to dilate.
In addition to perturbing membrane curvature with LPC and OA, we also elevated levels of PS. PS has a positive C0 (25) and accumulates in the inner leaflet of the plasma membrane (9). Thus, its action will be similar to that of intracellular LPC or extracellular OA, and the finding that it increased the slope of ln(1/τ) versus 1/Rv plots in the same manner provides an independent test of the role of membrane bending energy in fusion pore dilation.
This study has identified membrane curvature as an important physical force in Ca2+-triggered exocytosis. But in contrast to liposome and viral membrane fusion, the energetic cost of deforming membrane into a lipidic fusion pore stabilizes the precursor fusion pore responsible for the PSF. This suggests that the PSF reflects flux through a fusion pore composed of protein (3,27), or of lipid that is highly constrained by protein (20). The hypothesis of a proteinaceous fusion pore builds on previous work suggesting that a ring of syntaxin transmembrane segments lines a fusion pore through the plasma membrane (2,3). The idea that the PSF ends in an abrupt transition from a proteinaceous pore to a lipidic pore is consistent with the finding that the fusion pore dilation rate has a strong temperature dependence and a high activation energy, and implies that this transition entails large scale structural rearrangements (6). However, this view differs from that put forward in studies showing that LPC enhanced exocytosis (28,29), whereas arachidonic acid did the opposite (28). These results directly contradict our results, and this issue requires further study. The idea of an initial fusion pore composed of protein is also difficult to reconcile with the finding that membrane label was lost during kiss-and-run exocytosis (4). It is possible that during kiss-and-run a fusion pore can evolve past its initial proteinaceous state and still reverse. Alternatively, the initial fusion pore could contain both protein and lipid, configured in such a way to allow lipid flux along a proteinaceous pore (20,30).
This study exploited the principal that membrane bending energy can influence fusion pores in opposite ways depending on whether they are initially proteinaceous or lipidic. With this understanding of the timing for the formation of a fusion intermediate with highly curved membrane, we can develop hypotheses for how proteins that deform membranes catalyze membrane fusion (26), and begin to consider how the membrane bending activity of synaptotagmin allows Ca2+ to trigger exocytosis (31,32). The lower stability of fusion pores for small vesicles suggests that the general appearance of small vesicles at rapid synapses serves an adaptive role in allowing fusion to proceed through a lower energy pathway and release neurotransmitter with greater speed (33).
Appendix A: Theory for the Dependence of Fusion Pore Stability on Vesicle Size
To interpret these results in terms of membrane bending energetics, a model was developed to evaluate how the amount of curved membrane in a fusion pore varies with vesicle size. Deforming the bilayers of a flat plasma membrane and a spherical vesicle (Fig. 2 A) into a fusion pore (Fig. 2 B) requires energy to overcome the elastic resistance to bending. Part of the vesicle membrane curves toward the plasma membrane and a part of the plasma membrane curves toward the vesicle. Fig. 2 illustrates two ways in which vesicle size can make a difference. First, smaller vesicles have greater bending energy per unit of surface area, so taking a patch of the same area out of a smaller vesicle to form the pore will release more energy (Fig. 2 A, blue). Second, with smaller vesicles there is less curved membrane within the fusion pore (Fig. 2 B, green). Both of these factors indicate that forming a lipid fusion pore from a small vesicle will be easier than from a large vesicle.
These two vesicle-size-dependent contributions to pore energy can be evaluated with a continuum elasticity model (34) that has been used extensively in the field of membrane fusion (1,26). We focus on the contact angle ϕ between the vesicle and fusion pore (Fig. 2 B). ϕ → 0 in the limit of a large vesicle but increases as a vesicle becomes smaller. The pore radius, Rp, is taken as the distance from the pore axis to the center of the bilayer at the narrowest part of the pore (Fig. 2 C). Rm is the distance along a vesicle radius at the contact angle from the vesicle midplane to the horizontal plane. For a toroidal fusion pore, Rm is the meridian radius of curvature of the toroid (35). (The analysis is simpler if one assumes that the pore is toroidal, but a more general approach shows that the key theoretical result does not depend on this assumption). Finally, define Rh along the horizontal plane from the bilayer midplane to the intersection with an extended vesicle radius through the contact angle. Consider a triangle formed from 1), the pore axis; 2), an extended vesicle radius at ϕ; and 3), the horizontal line through the narrowest part of the pore. We then have
| (A1) |
Because ϕ is small and Rv >> Rm, we approximate
| (A2) |
For a spherical vesicle of radius Rv the membrane bending energy per unit area is , where B is the flexural rigidity of a lipid bilayer and C0 is the spontaneous curvature. The area of membrane lost by the vesicle on forming the fusion pore (Fig. 2 A) is ≈πRv2ϕ2 for small ϕ. Thus, we obtain the bending energy within the vesicle released during fusion pore formation:
| (A3) |
Note that if C0 ≠ 0 the energy before fusion pore formation will include an additional positive term arising from part of the plasma membrane equal to πB(Rp + Rh)2C02/2 (Fig. 2 A, lower blue strip). This term does not depend strongly on vesicle size so it is neglected here. Substituting for ϕ from Eq. A2 gives
| (A4) |
Turning now to the bending energy of the membrane within the fusion pore, we start with a full-sized pore in the limit of a very large vesicle where the pore connects two essentially parallel membranes. Taking this limiting energy as Wp, we then consider a vesicle of finite size so that the area of membrane within the fusion pore will be reduced by an amount δAp. We obtain the energy of this fusion pore by calculating δApB/2 times the mean curvature squared of the membrane in the pore rim and subtracting this quantity from Wp. The relevant region of the pore rim is small enough that the meridian curvature will be essentially uniform. We will take this curvature as 1/Rr. We can neglect parallel curvature because it goes to zero at the rim of a full-sized pore. This gives the membrane bending energy of the fusion pore as
| (A5) |
δAp is the area of an annulus formed as a surface of revolution of an arc of length Rrϕ around the pore axis. The diameter at the pore rim is Rp + Rh so we have
| (A6) |
Substituting ϕ from Eq. A2 and using this expression for δAp in Eq. A5 leads to
| (A7) |
The change in bending energy of pore formation is the fusion-pore contribution (Eq. A7) minus the vesicle contribution (Eq. A4).
| (A8) |
Note that the coefficients for 1/Rv and 1/Rv2 are similar in magnitude. Because Rv > ∼50 nm, the second order term will be < ∼2% of the first order term and can be neglected. Incorporating the size independent parts of Eq. A8 into Wp′ and neglecting the second order term gives
| (A9) |
To relate the energy of pore formation to τ, we assume that the activation energy of the transition scales linearly with its driving force according to a scaling factor ψ. We can obtain the rate constant for transitions from Fig. 2 A to Fig. 2 B by multiplying ΔE from Eq. A9 by ψ. The logarithm of the rate constant (1/τ) then becomes
| (A10) |
with A as a preexponential factor. Eq. A10 generates the observed experimental behavior (e.g., Fig. 1, B3 and C3).
Eq. A10 is useful in the analysis of plots of ln(1/τ) versus 1/Rv. Take the slope of such a plot from an experiment with nonzero C0 and divide it by the slope from a control experiment where C0 is assumed to be zero gives a quadratic equation in C0.
| (A11) |
This can be solved for C0 given a reasonable value of Rr. If we assume the pore has a toroidal shape (35) then Rr is simply half the distance between the horizontal planes of the two bilayers. The repulsive hydration forces between bilayers prevents Rr from falling below ∼3 nm (36). The toroidal model overestimates the energy of lipid fusion pores and the energy can be reduced by increasing Rh and Rr (23). Here we solved Eq. A11 using Rr = 3 and 6 nm to obtain a range for C0. Rh = 3 nm is a lower bound for a toroidal pore, and Rm = 6 nm follows from a reasonable reduction of curvature for a shape that minimizes bending energy (23).
Supporting Material
Two figures are available at http://www.biophysj.org/biophysj/supplemental/S0006-3495(10)00323-1.
Supporting Material
Acknowledgments
We thank Mike Edwardson, Leonid Chernomordik, Fredric Cohen, Ed Chapman, and Enfu Hui for helpful discussions and comments on this manuscript.
This work was supported by the National Institutes of Health (NS44057).
References
- 1.Chernomordik L.V., Kozlov M.M. Mechanics of membrane fusion. Nat. Struct. Mol. Biol. 2008;15:675–683. doi: 10.1038/nsmb.1455. [DOI] [PMC free article] [PubMed] [Google Scholar]
- 2.Han X., Jackson M.B. Electrostatic interactions between the syntaxin membrane anchor and neurotransmitter passing through the fusion pore. Biophys. J. 2005;88:L20–L22. doi: 10.1529/biophysj.104.056739. [DOI] [PMC free article] [PubMed] [Google Scholar]
- 3.Han X., Wang C.T., Jackson M.B. Transmembrane segments of syntaxin line the fusion pore of Ca2+-triggered exocytosis. Science. 2004;304:289–292. doi: 10.1126/science.1095801. [DOI] [PubMed] [Google Scholar]
- 4.Taraska J.W., Almers W. Bilayers merge even when exocytosis is transient. Proc. Natl. Acad. Sci. USA. 2004;101:8780–8785. doi: 10.1073/pnas.0401316101. [DOI] [PMC free article] [PubMed] [Google Scholar]
- 5.Jackson M.B., Chapman E.R. The fusion pores of Ca(2+)-triggered exocytosis. Nat. Struct. Mol. Biol. 2008;15:684–689. doi: 10.1038/nsmb.1449. [DOI] [PMC free article] [PubMed] [Google Scholar]
- 6.Zhang Z., Jackson M.B. Temperature dependence of fusion kinetics and fusion pores in Ca2+-triggered exocytosis from PC12 cells. J. Gen. Physiol. 2008;131:117–124. doi: 10.1085/jgp.200709891. [DOI] [PMC free article] [PubMed] [Google Scholar]
- 7.Chow R.H., von Rüden L. Electrochemical detection of secretion from single cells. In: Sakmann B., Neher E., editors. Single-Channel Recording. Plenum Press; New York, NY: 1995. pp. 245–275. [Google Scholar]
- 8.Van Kessel W.S., Hax W.M., De Gier J. High performance liquid chromatographic separation and direct ultraviolet detection of phospholipids. Biochim. Biophys. Acta. 1977;486:524–530. doi: 10.1016/0005-2760(77)90102-3. [DOI] [PubMed] [Google Scholar]
- 9.Zhang Z., Hui E., Jackson M.B. Phosphatidylserine regulation of Ca2+-triggered exocytosis and fusion pores in PC12 cells. Mol. Biol. Cell. 2009;20:5086–5095. doi: 10.1091/mbc.E09-08-0691. [DOI] [PMC free article] [PubMed] [Google Scholar]
- 10.Chow R.H., von Rüden L., Neher E. Delay in vesicle fusion revealed by electrochemical monitoring of single secretory events in adrenal chromaffin cells. Nature. 1992;356:60–63. doi: 10.1038/356060a0. [DOI] [PubMed] [Google Scholar]
- 11.Jankowski J.A., Schroeder T.J., Wightman R.M. Temporal characteristics of quantal secretion of catecholamines from adrenal medullary cells. J. Biol. Chem. 1993;268:14694–14700. [PubMed] [Google Scholar]
- 12.Wang C.-T., Grishanin R., Jackson M.B. Synaptotagmin modulation of fusion pore kinetics in regulated exocytosis of dense-core vesicles. Science. 2001;294:1111–1115. doi: 10.1126/science.1064002. [DOI] [PubMed] [Google Scholar]
- 13.Gong L.W., Hafez I., Lindau M. Secretory vesicles membrane area is regulated in tandem with quantal size in chromaffin cells. J. Neurosci. 2003;23:7917–7921. doi: 10.1523/JNEUROSCI.23-21-07917.2003. [DOI] [PMC free article] [PubMed] [Google Scholar]
- 14.Sombers L.A., Hanchar H.J., Ewing A.G. The effects of vesicular volume on secretion through the fusion pore in exocytotic release from PC12 cells. J. Neurosci. 2004;24:303–309. doi: 10.1523/JNEUROSCI.1119-03.2004. [DOI] [PMC free article] [PubMed] [Google Scholar]
- 15.Wightman R.M., Schroeder T.J., Pihel K. Time course of release of catecholamines from individual vesicles during exocytosis at adrenal medullary cells. Biophys. J. 1995;68:383–390. doi: 10.1016/S0006-3495(95)80199-2. [DOI] [PMC free article] [PubMed] [Google Scholar]
- 16.Haller M., Heinemann C., Neher E. Comparison of secretory responses as measured by membrane capacitance and by amperometry. Biophys. J. 1998;74:2100–2113. doi: 10.1016/S0006-3495(98)77917-2. [DOI] [PMC free article] [PubMed] [Google Scholar]
- 17.Alvarez de Toledo G., Fernández-Chacón R., Fernández J.M. Release of secretory products during transient vesicle fusion. Nature. 1993;363:554–558. doi: 10.1038/363554a0. [DOI] [PubMed] [Google Scholar]
- 18.Malinin V.S., Frederik P., Lentz B.R. Osmotic and curvature stress affect PEG-induced fusion of lipid vesicles but not mixing of their lipids. Biophys. J. 2002;82:2090–2100. doi: 10.1016/S0006-3495(02)75556-2. [DOI] [PMC free article] [PubMed] [Google Scholar]
- 19.Zhou Z., Misler S., Chow R.H. Rapid fluctuations in transmitter release from single vesicles in bovine adrenal chromaffin cells. Biophys. J. 1996;70:1543–1552. doi: 10.1016/S0006-3495(96)79718-7. [DOI] [PMC free article] [PubMed] [Google Scholar]
- 20.Fang Q., Berberian K., Lindau M. The role of the C terminus of the SNARE protein SNAP-25 in fusion pore opening and a model for fusion pore mechanics. Proc. Natl. Acad. Sci. USA. 2008;105:15388–15392. doi: 10.1073/pnas.0805377105. [DOI] [PMC free article] [PubMed] [Google Scholar]
- 21.Mohandas N., Wyatt J., Shohet S.B. Lipid translocation across the human erythrocyte membrane. Regulatory factors. J. Biol. Chem. 1982;257:6537–6543. [PubMed] [Google Scholar]
- 22.Fuller N., Rand R.P. The influence of lysolipids on the spontaneous curvature and bending elasticity of phospholipid membranes. Biophys. J. 2001;81:243–254. doi: 10.1016/S0006-3495(01)75695-0. [DOI] [PMC free article] [PubMed] [Google Scholar]
- 23.Jackson M.B. Minimum membrane bending energies of fusion pores. J. Membr. Biol. 2009;231:101–115. doi: 10.1007/s00232-009-9209-x. [DOI] [PMC free article] [PubMed] [Google Scholar]
- 24.Razinkov V.I., Melikyan G.B., Cohen F.S. Effects of spontaneous bilayer curvature on influenza virus-mediated fusion pores. J. Gen. Physiol. 1998;112:409–422. doi: 10.1085/jgp.112.4.409. [DOI] [PMC free article] [PubMed] [Google Scholar]
- 25.Fuller N., Benatti C.R., Rand R.P. Curvature and bending constants for phosphatidylserine-containing membranes. Biophys. J. 2003;85:1667–1674. doi: 10.1016/s0006-3495(03)74596-2. [DOI] [PMC free article] [PubMed] [Google Scholar]
- 26.Zimmerberg J., Kozlov M.M. How proteins produce cellular membrane curvature. Nat. Rev. Mol. Cell Biol. 2006;7:9–19. doi: 10.1038/nrm1784. [DOI] [PubMed] [Google Scholar]
- 27.Lindau M., Almers W. Structure and function of fusion pores in exocytosis and ectoplasmic membrane fusion. Curr. Opin. Cell Biol. 1995;7:509–517. doi: 10.1016/0955-0674(95)80007-7. [DOI] [PubMed] [Google Scholar]
- 28.Amatore C., Arbault S., Verchier Y. Regulation of exocytosis in chromaffin cells by trans-insertion of lysophosphatidylcholine and arachidonic acid into the outer leaflet of the cell membrane. ChemBioChem. 2006;7:1998–2003. doi: 10.1002/cbic.200600194. [DOI] [PubMed] [Google Scholar]
- 29.Lam A.D., Tryoen-Toth P., Stuenkel E.L. SNARE-catalyzed fusion events are regulated by Syntaxin1A-lipid interactions. Mol. Biol. Cell. 2008;19:485–497. doi: 10.1091/mbc.E07-02-0148. [DOI] [PMC free article] [PubMed] [Google Scholar]
- 30.Jackson M.B. In search of the fusion pore of exocytosis. Biophys. Chem. 2007;126:201–208. doi: 10.1016/j.bpc.2006.05.022. [DOI] [PMC free article] [PubMed] [Google Scholar]
- 31.Hui E., Johnson C.P., Chapman E.R. Synaptotagmin-mediated bending of the target membrane is a critical step in Ca(2+)-regulated fusion. Cell. 2009;138:709–721. doi: 10.1016/j.cell.2009.05.049. [DOI] [PMC free article] [PubMed] [Google Scholar]
- 32.Martens S., Kozlov M.M., McMahon H.T. How synaptotagmin promotes membrane fusion. Science. 2007;316:1205–1208. doi: 10.1126/science.1142614. [DOI] [PubMed] [Google Scholar]
- 33.Smith S.M., Renden R., von Gersdorff H. Synaptic vesicle endocytosis: fast and slow modes of membrane retrieval. Trends Neurosci. 2008;31:559–568. doi: 10.1016/j.tins.2008.08.005. [DOI] [PMC free article] [PubMed] [Google Scholar]
- 34.Helfrich W. Elastic properties of lipid bilayers: theory and possible experiments. Z. Naturforsch. [C] 1973;28(11, C):693–703. doi: 10.1515/znc-1973-11-1209. [DOI] [PubMed] [Google Scholar]
- 35.Chizmadzhev Y.A., Cohen F.S., Zimmerberg J. Membrane mechanics can account for fusion pore dilation in stages. Biophys. J. 1995;69:2489–2500. doi: 10.1016/S0006-3495(95)80119-0. [DOI] [PMC free article] [PubMed] [Google Scholar]
- 36.Parsegian V.A., Fuller N., Rand R.P. Measured work of deformation and repulsion of lecithin bilayers. Proc. Natl. Acad. Sci. USA. 1979;76:2750–2754. doi: 10.1073/pnas.76.6.2750. [DOI] [PMC free article] [PubMed] [Google Scholar]
Associated Data
This section collects any data citations, data availability statements, or supplementary materials included in this article.