

Abstract
The cross-bridge stiffness can be used to estimate the number of S1 that are bound to actin during contraction, which is a critical parameter for elucidating the fundamental mechanism of the myosin motor. At present, the development of active tension and the increase in muscle stiffness due to S1 binding to actin are thought to be linearly related to the number of cross-bridges formed upon activation. The nonlinearity of total stiffness with respect to active force is thought to arise from the contribution of actin and myosin filament stiffness to total sarcomere elasticity. In this work, we reexamined the relation of total stiffness to tension during activation and during exposure to N-benzyl-p-toluene sulphonamide, an inhibitor of cross-bridge formation. In addition to filament and cross-bridge elasticity, our findings are best accounted for by the inclusion of an extra elasticity in parallel with the cross-bridges, which is formed upon activation but is insensitive to the subsequent level of cross-bridge formation. By analyzing the rupture tension of the muscle (an independent measure of cross-bridge formation) at different levels of activation, we found that this additional elasticity could be explained as the stiffness of a population of no-force-generating cross-bridges. These findings call into question the assumption that active force development can be taken as directly proportional to the cross-bridge number.
Introduction
Striated muscle generates mechanical work by a cyclic interaction of myosin heads (S1) projecting from the thick filaments with binding sites on the thin (actin) filaments. The energy expended is obtained from the free energy of hydrolysis of ATP. The number of S1 bound to actin (termed the “cross-bridge number”) at any given moment or under any given experimental condition, and the changes in this number that occur in response to muscle activity perturbations, by various means, define the average force and stiffness associated with an individual S1-actin interaction, the duty cycle of ATP hydrolysis by S1, and permit S1 optical probe orientation to define precise angles of lever arm tilting. It is therefore a crucial unknown parameter in the tilting lever arm model of the muscle power stroke, and an essential factor in elucidating the mechanics and energetics of muscular contraction. One can assess changes in the number of actin-bound S1 in contracting fibers by measuring fiber stiffness, which is usually done by applying fast length changes (dl; either step or oscillations (1–5)) to one end of a fiber and measuring the resulting force changes (dP) at the other end. Given the parallel disposition of cross-bridges in a half-sarcomere and assuming that an elastic element is present in the S1 structure, one would expect the stiffness to be directly proportional to the number of S1 bound to actin. However, this proportionality implies several assumptions, the most important of which are that 1), actin and myosin filaments are rigid enough to contribute negligibly to the total half-sarcomere compliance; 2), fiber stiffness and force are both directly proportional to attached S1 number; and 3), elasticity within S1 is Hookean. These assumptions were considered generally valid (1,2,4) until it was demonstrated by means of the x-ray diffraction technique (6,7) that filament compliance is much greater than previously assumed (2–4,8), and is comparable to cross-bridge compliance at full activation. This finding significantly complicated the interpretation of fiber stiffness changes in terms of cross-bridge number. In the simplest case of assumed Hookean filament and S1 elasticity, the effect of total compliance in series with cross-bridges, which can be easily calculated (4,9–11), is to introduce a nonlinearity into the relation between active tension and fiber stiffness. Relative stiffness is always greater than relative tension below maximum (P0), an effect that was recognized well before the demonstration that myofilaments are compliant (1). Thus, the well-known nonlinearity of the tension-stiffness relation measured on the tetanus rise (1,2,12) was attributed to the presence of a series linear compliance located in the myofilaments (13,6,7), in contrast to other hypotheses (1,2,14). If, however, the S1 or myofilament elasticity is nonlinear, knowledge of their stress-strain relations is required to correlate the fiber or half-sarcomere stiffness changes with the cross-bridge number. We recently demonstrated that, as an alternative to stiffness measurements, we were able to obtain the relative cross-bridge number in a contracting skeletal muscle fiber by measuring the force (critical force, Pc) required to forcibly detach the cross-bridge ensemble by a fast stretch (15,16). The advantage of this method over stiffness measurements is that Pc is insensitive to series elasticity. We found that during the tetanus rise, tetanus relaxation under length-clamp conditions, and submaximal contractions in the presence of various 2,3-butanedione monoxime (BDM) concentrations, the critical force was always linearly correlated with the tension developed by the fiber and therefore with the cross-bridge number (15). This was in contrast to stiffness measurements that showed, under all of the above conditions, nonlinearity between relative stiffness and tension (17–20).
Although it has been generally assumed that filament compliance is responsible for the nonlinearity mentioned above, a detailed quantitative analysis of filament compliance effect on the half-sarcomere stiffness and on cross-bridge number in skeletal muscle fibers is still lacking. Recently, Linari et al. (21) measured the tension-stiffness relation in single muscle fibers during submaximal tetanic contractions of various amplitudes obtained by depressing tetanic tension with N-benzyl-p-toluene sulphonamide (BTS), a well-known tension inhibitor (22–24), at various concentrations. The relation showed a greater nonlinearity than previously reported (1,2), which resulted in an estimated filament compliance corresponding to 66% of the half-sarcomere compliance at tetanus plateau, with cross-bridges accounting for the remaining 34%.
In the experiments reported here, we used Ringer with BTS (1 μM) in single muscle fibers to modulate the tetanic force and cross-bridge number so that we could study the relationship between tension and stiffness, and between tension and critical force. We also compared the data with those obtained in normal Ringer on the tetanus rise. Data obtained in BTS-treated fibers and during the tetanus rise showed the same nonlinearity, in similarity to our previous reports (1,2). However, contrary to our expectations, the nonlinearity could not be attributed solely to the presence of the filament compliance; instead, we accounted for the data by assuming that a constant fraction (∼14%) of cross-bridge stiffness at tetanus plateau was independent of tension. This fraction could be associated with attached cross-bridges generating no force. The analysis also indicated that filament and cross-bridge compliance account for 37% and 63%, respectively, of the total half-sarcomere compliance at full activation.
The relation between the critical tension needed to forcibly detach cross-bridges and active tension was the same in BTS-treated fibers and during the tetanus rise in normal Ringer. Critical tension plotted against isometric force produced a straight line relation that did not pass through the origin, consistent with the presence of a fraction of no-force-generating cross-bridges hypothesized on the basis of our stiffness measurements.
Materials and Methods
Frogs (Rana esculenta) were killed by decapitation, followed by destruction of the spinal cord, according to the procedure recommended by the Animal Care and Use Committee of the University of Florence and the official regulations of the European Community Council (Directive 86/609/EEC). Single intact fibers, dissected from the tibialis anterior muscle (4–5.5 mm long, 60–120 μm diameter), were mounted by means of aluminum foil clips between the lever arms of a force transducer (natural frequency: 40–60 kHz) and a fast electromagnetic motor (minimum stretch time: 100 μs) in a thermostatically controlled chamber that contained a glass floor for both white and laser light illumination. Stimuli of alternate polarity, 0.5 ms duration, and 1.5-fold threshold strength were applied transversely to the fiber by means of platinum-plate electrodes at the minimum frequency necessary to obtain fused tetanic contractions. Sarcomere length was measured using the striation follower device (25) in a fiber segment (1.0–2.5 mm long) selected for striation uniformity in a region as close as possible to the force transducer. Sinusoidal length oscillations of 4 kHz frequency and ∼1 nm hs−1 peak to peak (p-p) amplitude were applied to one end of an activated fiber while force response was measured at the other. At this frequency, the mechanism of the quick recovery (3,8) produces a negligible effect on stiffness measurements. Fiber stiffness was calculated as the ratio between the p-p amplitude of force (dP) and length (dl) sinusoids averaged for at least 10 cycles. To obtain submaximal tetanic contractions, the fiber was bathed with Ringer plus BTS at a concentration of 1 μM (BTS-Ringer). When the solution was switched from normal Ringer to BTS-Ringer, the tetanic tension started to decrease progressively toward an equilibrium value, which was usually reached in ∼60–90 min. Stiffness and tension measurements were performed during this time on submaximal tetanic contractions evoked every 3 min.
To measure both the critical force and the sarcomere elongation at Pc (critical length, Lc), fast ramp-shaped stretches of 0.3–0.5 ms duration and 15–28 nm per half-sarcomere (hs−1) amplitude (corresponding to a stretching speed of 30–90 fiber length s−1) were applied to the fibers. Stretches were applied only when tension was <∼70% of tetanus plateau tension (P0) in normal Ringer to reduce fiber damage. Critical force and stiffness measurements were terminated when tension was reduced to <∼0.20 P0, because the appearance of a measurable phase shift between force and sarcomere length sinusoids indicated that the fiber was not behaving as a pure elastic element. No difference was found when the procedure was reversed and measurements were taken during the recovery in normal Ringer after perfusion with BTS-Ringer. However, this procedure was used only in a few fibers, since the complete recovery took some hours and required repeated washing of the experimental chamber. The experimental temperature was set to 5°C, and the resting sarcomere length was between 2.1 and 2.2 μm.
Stretch application induced an almost linear force increase up to a peak representing the cross-bridge rupture force. This phase was usually preceded by a small and faster force rise (lasting <0.1 ms) at the start of the stretch, whose amplitude was roughly proportional to the stretching speed. This effect, which was very variable from one fiber to the other, was probably due to passive properties of the activated fiber, such as inertia or viscosity (26), and therefore the peak force was corrected for it. To that end, the slower linear part of the force rise was extrapolated back to the starting time of the stretch, and the intercept on the ordinate was considered zero tension. The passive force response was negligible and no correction was made for it.
The Ringer solution had the following composition (mM): NaCl, 115; KCl, 2.5; CaCl2, 1.8; NaH2PO4, 0.85; and Na2HPO4, 2.15. BTS-Ringer was obtained by adding the appropriate amount of a stock solution of 5 mM BTS dissolved in dimethyl sulphoxide. The effects of BTS have been described in previous studies (21–24) and were not further investigated here. BTS was simply used as cross-bridge number modulator.
Stimuli and stretches were driven by custom-written software (LabView National Instruments, Austin, TX) that was also used to record force, fiber length, and sarcomere length signals with 1 ms and 5 μs time resolution. Statistical analysis and linear and nonlinear fittings were performed using the Origin 8Pro software (OriginLab, Northampton, MA).
Results
BTS-Ringer
To measure half-sarcomere stiffness, sinusoidal length oscillations were applied to the contracting fibers at various tension levels on the tetanus rise in normal Ringer and at the plateau of reduced tetanic contractions obtained with BTS-Ringer (1 μM). Because of the very slow BTS action, it was usually possible to obtain more than 20 stiffness and tension measurements before the tetanic tension attained the final steady-state level of 0.1–0.2 P0.
Fig. 1 A shows an example of the records obtained at plateau tension in normal Ringer (thick traces) and in BTS-Ringer when tension was reduced to 0.25 P0 (thin traces). The pooled half-sarcomere stiffness data from eight fibers are plotted in Fig. 2 as a function of tetanic tension. Stiffness was measured by the ratio dP/dl averaged for at least 10 cycles. Both stiffness and tension were normalized for the values measured at P0 in normal Ringer solution. The relation shows the same kind of nonlinearity found previously during tetanus rise in normal Ringer (1,2). The relatively high scatter present in the data is mostly due to variability of the sarcomere length signal. This is shown in Fig. 3, in which dl is plotted as a function of the tension developed in BTS-Ringer, for constant amplitude of the length oscillations applied to the fiber. Because of the very small amplitude (mean 0.92 ± 0.026 nm hs−1 p-p; n = 8), the scatter is relatively high, but it is clear that the length oscillations at the sarcomere level have a constant amplitude at any tension developed by the fiber. If dl is constant, then the relative half-sarcomere stiffness can be measured simply by the ratio of force change dp at any tension to the force change measured at plateau tension in normal Ringer (dP0). Fig. 4 shows the stiffness-tension relation obtained in this way. The scatter is now very much reduced and the shape of the relationship is much clearer.
Figure 1.
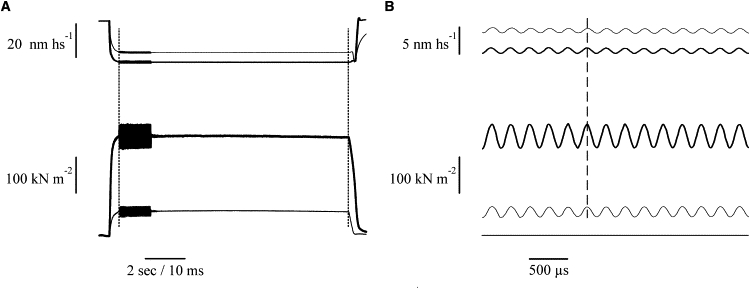
Force and sarcomere length records in a contracting frog muscle fiber during the application of sinusoidal length oscillations at tetanus plateau in normal Ringer solution (thick traces) and in the presence of 1 μM BTS (thin traces) at a time when tetanic tension was reduced to 0.25 P0. Upper traces: sarcomere length; lower traces: tension. (A) Vertical dotted lines indicate changes of sampling from slow to fast and vice versa. (B) Part of the traces in A expanded to show the quality of the length and force sinusoidal responses (4 kHz oscillation frequency, 1 nm hs−1 p-p amplitude). Note the absence of phase shift between force and length sinusoids (vertical dashed line). Fiber length: 5040 μm; segment length: 1364 μm; sarcomere length: 2.21 μm.
Figure 2.
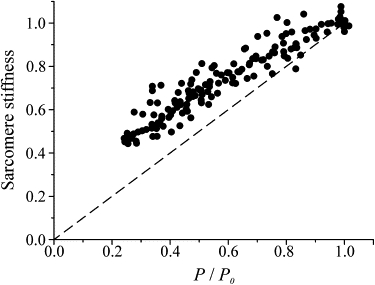
Relation between sarcomere stiffness (dp/dl) and tetanic tension developed in contractions of different amplitudes evoked at different times after the start of perfusion with BTS-Ringer. Pooled data from eight fibers are shown. Stiffness and tension are expressed relative to their maximum values in normal Ringer solution. The dashed line represents 1:1 proportionality.
Figure 3.
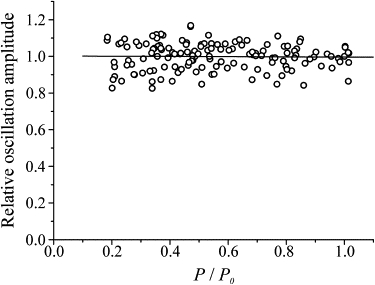
Relation between sarcomere length oscillation amplitude (for a constant length oscillation applied to the fiber) and tetanic tension developed in contractions of different amplitudes in BTS-Ringer. Pooled data from eight fibers are shown. For each fiber, oscillation amplitude and tension are expressed relative to the values measured at P0 in normal Ringer solution. The horizontal continuous line (representing the equation amplitude = 1.0022 − 0.0061 P/P0) is the best linear fitting of the data.
Figure 4.
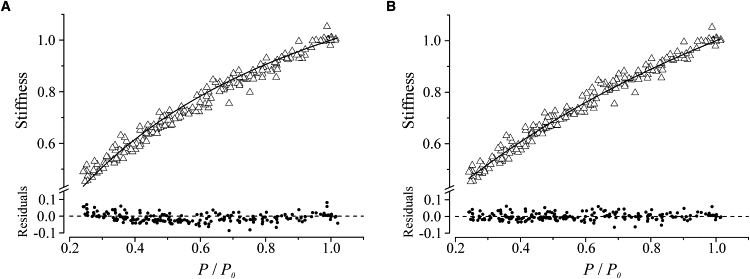
Stiffness-tension relation (open triangles) during submaximal tetanic contractions in the presence of 1 μM BTS and residuals (solid circles) of the best fitting (continuous line) of data with model 1 (A, see text) and model 2 (B, see text). Pooled data from eight fibers are shown. Both stiffness and tension are expressed relative to their plateau values in normal Ringer.
The next step was to fit the data with a simple model (model 1; see Fig. 5) assuming that 1), cross-bridge stiffness is directly proportional to the number of cross-bridges; 2), all cross-bridges develop the same individual tension and have the same stiffness, and therefore cross-bridge stiffness and tension are directly proportional; and 3), filament and S1 stiffness are both independent of tension (Hookean) and arranged in series.
Figure 5.
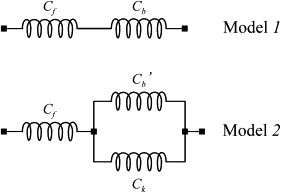
Simple lumped models of the half-sarcomere compliance of a skeletal muscle fiber. Model 1 is composed of the filament compliance, Cf, in series with the cross-bridge compliance at tetanus plateau, Cb. Model 2 includes a fixed cross-bridge compliance, Ck, in parallel with cross-bridge compliance, Cb′. The cross-bridge and filament compliances are actually distributed in a complex network; however, they are treated here as lumped elements arranged in series, since under our experimental conditions the compliance calculated for the two different dispositions differs by at most <2.3% (see Supporting Material for details).
The half-sarcomere stiffness (Sh) of the lumped model 1 in Fig. 5, expressed relative to the control value at P0, at any relative tension developed, P/P0, is then equal to
| (1) |
where n = P/P0, and Cf and Cb are the fractional filament and cross-bridge compliances at P0, respectively. The equation was fitted to the experimental data with the use of a nonlinear fitting program and the results are shown in Fig. 4 A. The best fitting (continuous line) indicates that the relative compliances of the cross-bridges and myofilaments are 0.42 ± 0.01 and 0.58 ± 0.01, respectively. It is clear, however, that the fitting is not satisfactory, as the curvature of the model response is clearly greater than that of the experimental data. The R2 and χ2 were 0.968 and 0.00079, respectively; however, the analysis of residuals shows a clear systematic deviation of the fitted equation from the data, suggesting that the simple model of Eq. 1 is very likely incorrect. This indicates that either the S1 and filament compliances are not Hookean, or the proportionality between cross-bridge tension and stiffness is not fully obeyed. Since the introduction of nonlinearity of the filament compliance and S1 would not account for the cross-bridge rupture data (see further below), we hypothesized a nonproportionality between cross-bridge tension and stiffness. This could arise, for instance, from the presence of a fixed number of cross-bridges attached and contributing to stiffness but generating no force, as suggested in the past (1,2,14). We investigated this possibility by fitting the experimental data with the following equation, which models the condition above:
| (2) |
where Cb′ is the compliance of the force-generating cross-bridge, and Ck is the compliance of the cross-bridges that are attached but generate no force.
The results presented in Fig. 4 B show that the fitting is definitely better than that achieved with model 1. This is because Eq. 2 does not constrain the fitted line to pass through the origin at zero tension. The correspondence between simulated and experimental data is now very good. R2 increased to 0.981(χ2 = 0.00049), but more importantly, the residuals are on a straight line with no detectable systematic deviations. The best fit indicates that the relative compliances of the cross-bridges and myofilaments are now 0.63 ± 0.03 and 0.37 ± 0.03, respectively, and thus are quite different from those calculated with the model (model 1). The fixed stiffness, attributed to non-force-generating cross-bridges, was 14.3% of the total cross-bridge stiffness at plateau. The two model responses were statistically compared (also see the Supporting Material) using the extra sum-of-squares F-test, which is suitable for comparing nested models. The F-value was 86.48, from which we derived a probability, p, that the best fitting of model 2 will occur by chance of <0.0001. This strongly indicates that model 1 should be rejected and model 2 accepted.
Data on the tetanus rise in normal Ringer
Sinusoidal length oscillations were also applied throughout the whole tetanus rise in normal Ringer to the same fibers used for the BTS experiments, and stiffness was measured with a similar procedure. The obtained stiffness-tension relation, shown in Fig. 6, is very similar to that in BTS-Ringer. Because of the smaller scattering, the fit with model 1 (Fig. 6 A) shows more clearly the same problem observed in BTS-Ringer, giving a more curved relation than the experimental data. Again, the simulation with model 2 (Fig. 6 B) gives a much better fitting to the data, with calculated cross-bridge and filament compliances of 0.63 ± 0.04 and 0.37 ± 0.04, respectively. The fraction of no-force, attached bridges was 14.1% of the total. All of these parameters are practically identical to those obtained with BTS-Ringer. In this case, too, the F-test indicated the validity of model 2. Thus, our results show no difference between the stiffness-tension relationship measured on tetanus rise or in BTS-treated fibers, consistent with the finding that BTS inhibits tension by reducing the number of attached cross-bridges (21).
Figure 6.
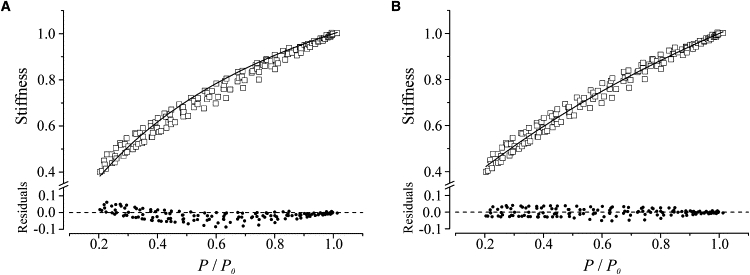
Stiffness-tension relation (open squares) during the tetanus rise in normal Ringer solution and residuals (solid circles). The continuous line represents the best fitting of the data with model 1 (A) and model 2 (B). Pooled data from seven fibers are shown. The data of a given fiber were all obtained in just a single contraction with the length oscillations superimposed throughout the whole tetanus rise. This accounts for the smaller data scattering compared to the BTS-Ringer results (Fig. 4).
Half-sarcomere strain
To compare our results with recent reports in the literature (21,27), we also plotted our data (pooled BTS and tetanus rise data) as a relation between the tension developed and the strain of the elastic components of the half-sarcomere. The results are shown in Fig. 7. The strain values are plotted relative to the plateau value, which was 3.87 nm hs−1 ± 0.21 (n = 8). It can be seen that, as expected from the stiffness data of Fig. 4 and contrary to previous results (21,27), the relation is not linear. This means that the overall half-sarcomere elasticity is not Hookean, and indicates that some source of nonlinearity is present in the myofilaments or cross-bridge elasticity. Again, a very good fitting (continuous line) was obtained with model 2, and the resulting parameters (Cf = 0.39 ± 0.024 and Cb = 0.61 ± 0.036) and the fraction of no-force-generating bridges (13.3%) do not differ from those obtained from the stiffness data. This means that the cross-bridge extension at tetanus plateau is 2.36 ± 0.26 nm, whereas the filament extension is 1.51 ± 0.17 nm.
Figure 7.
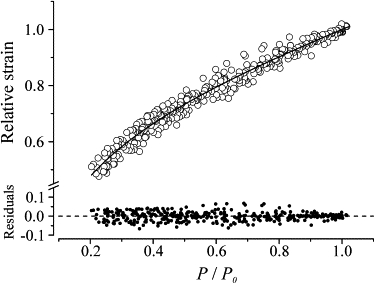
Relative half-sarcomere extension as a function of the relative tension developed. Pooled data from BTS and tetanus rise experiments are shown. The strain was calculated as the ratio between relative tension and relative stiffness. The equation fitted to the data (continuous line) is the same of model 2 applied to strain rather than to stiffness.
Response to fast stretches
If there is a fixed fraction of attached cross-bridges generating no-force, as suggested by our stiffness data, it should be possible to detect their presence by measuring the force, Pc, needed to forcibly detach the cross-bridge ensemble by a fast stretch. Pc is, in fact, assumed to be proportional to the cross-bridge number independently of the individual force developed (15). Pc was measured both in normal Ringer during the tetanus rise and in BTS-treated fibers. The protocol used (Fig. 8) allowed us to measure both stiffness (with oscillations) and critical force and critical length (with stretches) during the same contraction (15,28) The results are shown in Fig. 9. Critical tension increases linearly with the tension with a mean Pc/P ratio of 3.24 ± 0.19 (n = 7) during the tetanus rise and 3.41 ± 0.16 in BTS-Ringer (n = 6), in agreement with previous data (15). The two ratios are not statistically different, confirming the similarity of the two conditions. The fitting of the pooled data (BTS-Ringer and tetanus rise) deviates slightly from the 1:1 proportion, giving an extrapolated intercept on the ordinate of 0.096 ± 0.007. This means that, at zero tension, we would still obtain a critical force of ∼10% of that at plateau, which can be explained by assuming that 10% of the plateau cross-bridges develop zero force. These bridges would account for most of the fixed stiffness (1/Ck) needed to fit the stiffness data with model 2.
Figure 8.
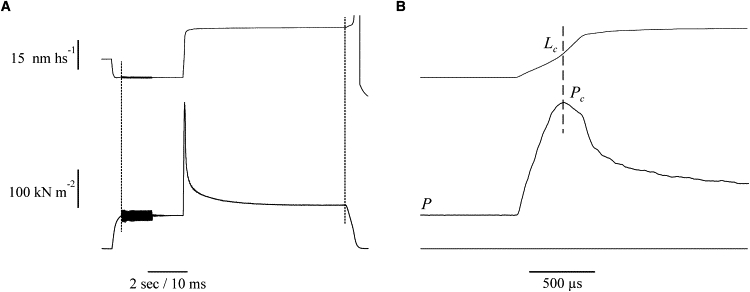
Force response to a fast ramp stretch (22 nm hs−1 amplitude, 370 μs time to tension peak) applied to a single fiber at tetanic tension (P) of 0.62 P0 in the presence of 1 μM BTS, 8 ms after the end of an 8 ms burst of sinusoidal length oscillations at 4 kHz. Upper traces: sarcomere length; lower traces: tension. The dotted vertical lines in A delimit the fast time base. The length oscillations start at the same time as the fast time base. (B) Part of the traces in A at a faster time base. The force peak (Pc) represents the force needed to detach the cross-bridge ensemble. The intercept of the vertical dashed line with the upper trace indicates the sarcomere length (critical length, Lc) at which the rupture of the cross-bridge ensemble occurs. Fiber length: 5450 μm; segment length: 1085 μm; sarcomere length: 2.13 μm.
Figure 9.
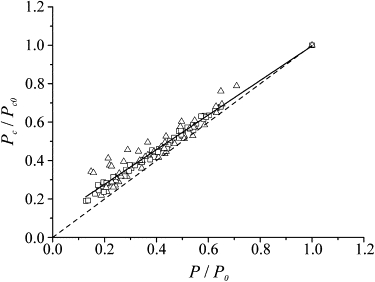
Critical tension against tension during the tetanus rise in normal Ringer solution (square) and at the plateau of reduced tetanic contractions in the presence of 1 μM BTS (triangles). Pooled data from 13 fibers are shown. Critical tension and tension are expressed relative to the values measured in normal Ringer solution. For each fiber, the value of critical tension at plateau (Pc0) was extrapolated assuming a linear relationship. The continuous line, representing the best linear fitting of the data, intercepts the ordinate at ∼0.1. The dashed line represents the 1:1 proportionality.
Another parameter measured in the stretch experiments was the sarcomere elongation needed to detach the cross-bridges, the critical length, Lc. The plot of Lc measured in both BTS-treated fibers and normal Ringer during the tetanus rise is shown in Fig. 10 as a function of the relative tension developed by the fiber. The BTS-Ringer and normal Ringer data were pooled because they did not differ significantly. It can be seen that there is a slight tendency for Lc to increase at low tensions. The mean value at plateau in normal Ringer was 11.88 ± 0.45 nm hs−1, in similarity to previous data (15).
Figure 10.
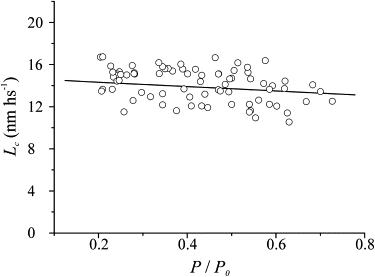
Critical length (Lc) against relative tension during the tetanus rise in normal Ringer solution and at the plateau of reduced tetanic contractions in the presence of 1 μM BTS. Data from 10 fibers are shown. The continuous line, representing the best linear fitting of data (equation Lc = 15.63 − 3.75 P/P0), shows that Lc increases slightly at low tension.
Discussion
Changes in the cross-bridge number that occur under given experimental conditions constitute a critical parameter in the interpretation of both mechanical and energetic data of muscular contraction. A mechanical method that has been widely used to assess cross-bridge number is the measurement of fiber stiffness (1–5). This is a relatively simple method; however, converting fiber or half-sarcomere stiffness changes into the cross-bridge number requires knowledge of the stress-strain relation of both myofilament and cross-bridge elasticity. If we assume that filament and cross-bridge compliances are both Hookean, and that force and stiffness are both directly proportional to the cross-bridge number, we can easily predict the effects of cross-bridge number changes on the half-sarcomere stiffness (4,9–11). The presence of the filament compliance introduces a nonlinearity on the plot of relative tension against relative stiffness, making the relation curve downward (as in Fig. 2). Thus, previous studies (1,2) attributed the nonlinearity found on the tetanus rise to the presence of myofilament compliance, in contrast to other hypotheses (1,2,14). However, that conclusion has never been carefully tested quantitatively to verify its compatibility with experimental results. In this study, our goal was to clarify this point by taking advantage of 1), the ability of BTS to reduce the number of attached cross-bridges; and 2), the possibility to assess the attached cross-bridge number, in addition to stiffness, by the force needed to detach the cross-bridge ensemble by fast stretches.
BTS-treated fibers
The stiffness-tension relations obtained in fibers bathed with BTS-Ringer (Figs. 2 and 4) show the same kind of nonlinearity found previously during the tetanus rise (1,2). Fitting of the relations with the simple model 1, in which filament and cross-bridge stiffness are both assumed to be Hookean, and tension and stiffness are both directly proportional to the cross-bridge number, yielded a series filament compliance amounting to ∼58% of the total half-sarcomere compliance, which is somewhat smaller than that recently obtained in the same preparation (21). However, as shown in the Results section, model 1 is unable to fit the data satisfactorily, which suggests that fiber stiffness is also influenced by an unknown factor or factors. On the basis of the cross-bridge rupture results, we hypothesized a nonproportionality between cross-bridge tension and stiffness, caused by the presence of a fixed fraction of attached cross-bridges that contributed to stiffness but not to tension. As shown in Fig. 4 B, model 2, which was obtained by introducing this cross-bridge fraction into model 1, fits the experimental data quite well. The best fit indicates that the fixed stiffness is ∼14% of the total cross-bridge stiffness at P0. The main effect of the fixed stiffness is that the calculated filament compliance drops from 0.58 for model 1 to 0.37 for model 2. Symmetrically, cross-bridge compliance rises from 0.42 to 0.63.
Tetanus rise in normal Ringer
The results collected during the tetanus rise were almost identical to those obtained with BTS-Ringer. Again, only model 2 gave a satisfactory fitting of the experimental data. The fraction of fixed stiffness was ∼14%, whereas the relative filament and cross-bridge compliance were 0.37 and 0.63, respectively. Thus, the stiffness versus tension relations measured in BTS-treated fibers and during the tetanus rise in normal Ringer were practically identical.
Critical tension
We tested for the presence of a fraction of cross-bridges generating no force by studying the force responses to fast stretches that forcibly detached the cross-bridge ensemble. The data of Fig. 9 show that the critical tension was linearly correlated to the tension developed in the same way in BTS-Ringer or during the tetanus rise in normal Ringer. The relation deviates from perfect proportionality, and the fitted line intercepts the ordinate at 0.096, indicating that a fraction of ∼10% of the plateau bridge stiffness is independent of force. This is not too far from the figure of 14.5% postulated to explain the shape of the stiffness-tension relation. Thus, two independent kinds of measurement—critical tension and half-sarcomere stiffness—both suggest the presence of a similar fixed fraction of cross-bridges generating no force. The presence of these bridges has a great effect on the calculated series compliance, which in turn strongly affects the conversion of half-sarcomere stiffness changes into cross-bridge number. It is likely that attached, no-force-generating cross-bridges populate the prepower-stroke state and generate force only upon stretching until they are forced to detach, in similarity to force-generating cross-bridges (29).
All of our calculations assumed that filament compliance is Hookean; however, our data do not exclude the possibility that this parameter is nonlinear. Actually, a good fitting of the data with model 2 could also be obtained when filament stiffness was assumed nonlinear increasing by 20% as the tension rises from zero to P0 (see Section S3 of the Supporting Material). The resulting value of the fraction of the fixed stiffness (10.4%) would not conflict with cross-bridge rupture data. In contrast, the fitting was considerably worsened by the introduction of nonlinearity of individual cross-bridge stiffness, making this possibility unlikely (Section S4 of the Supporting Material).
It should be noted that a small portion (10–15%) of the fixed stiffness fraction is attributable to the so-called static stiffness attributed to titin stiffness during activation (30).
Critical length
Lc represents the half-sarcomere strain (cross-bridge plus filament strain) needed to detach forcibly the cross-bridges by stretching. If the cross-bridges were the only source of half-sarcomere compliance, Lc should be insensitive to their number, since cross-bridges are in parallel. The presence of filament compliance, however, modifies this expectation. In fact, as the number of cross-bridges decreases (e.g., with BTS treatment), critical tension also decreases, and so does the filament strain at the rupture force, thus reducing Lc. The greater the filament compliance, the greater is the Lc reduction. It can be calculated that with 40% of compliance in the filament, we expect the critical length to be reduced by ∼20% as the tension decreases from P0 to 0.5 P0. This is in contrast to the data in Fig. 9 showing an 8% increase. The results of model 1 with a relative filament compliance of 58% would exacerbate this discrepancy, whereas the presence of the unstrained prepower-stroke cross-bridges of model 2 could explain, at least partially, the above discrepancy. In fact, the shorter extension of these bridges reduces the total average cross-bridge extension, making a greater average Lc necessary to reach their rupture force (15). Thus, due to the fixed fraction of no-force-generating cross-bridges, the average cross-bridge force and strain are both dependent on the cross-bridge number.
Comparison with previous data
Most previous stiffness-tension data were obtained on the tetanus rise in normal Ringer (1,2,5,12), and the deviation from linearity was, in general, close to that reported here. In most studies, stiffness data were collected at only a few tension levels, and a full quantitative analysis to evaluate the consistency of the model with the experimental data was not performed. Recently, the stiffness-tension and the half-sarcomere strain-tension relations were investigated in single frog fibers bathed with different concentrations of BTS to modulate tetanic force (21). In that study, analysis was performed with the simple model 1 which yielded a relative filament compliance Cf at P0 of 0.66 and cross-bridge compliance Cb of 0.34, with a ratio Cb/Cf of 0.51. A similar analysis on skinned human soleus fibers activated at various pCa gave inverted values of 0.66 for cross-bridge compliance and 0.34 for filament compliance; however, this result was attributed to the lower stiffness of the slow myosin isoform of soleus muscle (27).
In our study, in contrast to those reports, model 1 was clearly unable to fit the data. As shown in Fig. 7, our half-sarcomere strain-tension relationship cannot be fitted by a straight line, indicating that a different model is needed. The reason for this discrepancy is not clear. It may be related to the better resolution achieved in this study due to our use of sinusoidal-length oscillations rather than steps, which allowed us to describe more precisely the stiffness-tension relation. Each stiffness point in Figs. 4 and 6 represents the average value from several oscillations cycles, which reduces the scattering. In addition, since our protocol allowed to take at least 15–20 measurements for each fiber in both BTS-Ringer and during the tetanus rise, our fittings were performed on 150–198 data points arising from eight experiments. The use of the length clamp as described by Linari et al. (21) would not affect the results in BTS, since length oscillations were applied at the tetanus plateau where sarcomere length was nearly constant.
When the data were fitted with the appropriate model (model 2), we found that the filament and cross-bridge compliances were 0.37 and 0.63, respectively, with a ratio Cb/Cf of 1.7. These values are substantially different from those previously obtained.
To emphasize the importance of filament compliance in estimating the cross-bridge number from stiffness measurements, we note, for example, that doubling the number of S1 bound present at P0 when the relative filament compliance is 0.66 (as previously found with model 1 (21)) would result in a 20% increase of the half-sarcomere stiffness. In contrast, if the relative filament compliance is 0.37 (as in our data, obtained with model 2), the same increase in half-sarcomere stiffness would correspond only to a 41% increase of S1 bound (see Section S4 of the Supporting Material). It is clear that the interpretation of cross-bridge population changes from stiffness measurements is critically dependent on the characteristics assumed for filament compliance and on the model assumed.
Conclusions
The results reported here show that, in contrast to the general assumption, the deviation from linearity of the relationship between tension and stiffness during submaximal tension development cannot be explained solely by the presence of filament compliance in series with cross-bridges. We were only able to achieve a satisfactory fitting of the data by assuming that, in addition to filament and cross-bridge stiffness, a fixed stiffness (i.e., independent of tension) corresponding to ∼14% of plateau cross-bridge stiffness, was present in the half-sarcomere. This stiffness fraction could be due to attached cross-bridges contributing to stiffness but not to force, as suggested in the past (1,2,14). The presence of these bridges leads to 1), a considerable modification of the relation between sarcomere stiffness changes and cross-bridge number; and 2), a significant dependence of the average cross-bridge force and extension from the tension developed by the fiber.
Supporting Material
Three figures are available at http://www.biophysj.org/biophysj/supplemental/S0006-3495(10)00265-1.
Supporting Material
Acknowledgments
This research was supported by the Ministero dell'Università e della Ricerca (PRIN 2006058094, 2007ABK385-002), Ente Cassa di Risparmio di Firenze (2007), and University of Florence.
References
- 1.Cecchi G., Griffiths P.J., Taylor S.R. Muscular contraction: kinetics of crossbridge attachment studied by high-frequency stiffness measurements. Science. 1982;217:70–72. doi: 10.1126/science.6979780. [DOI] [PubMed] [Google Scholar]
- 2.Cecchi G., Griffiths P.J., Taylor S. Stiffness and force in activated frog skeletal muscle fibers. Biophys. J. 1986;49:437–451. doi: 10.1016/S0006-3495(86)83653-0. [DOI] [PMC free article] [PubMed] [Google Scholar]
- 3.Ford L.E., Huxley A.F., Simmons R.M. Tension responses to sudden length change in stimulated frog muscle fibres near slack length. J. Physiol. 1977;269:441–515. doi: 10.1113/jphysiol.1977.sp011911. [DOI] [PMC free article] [PubMed] [Google Scholar]
- 4.Ford L.E., Huxley A.F., Simmons R.M. The relation between stiffness and filament overlap in stimulated frog muscle fibres. J. Physiol. 1981;311:219–249. doi: 10.1113/jphysiol.1981.sp013582. [DOI] [PMC free article] [PubMed] [Google Scholar]
- 5.Julian F.J., Morgan D.L. Tension, stiffness, unloaded shortening speed and potentiation of frog muscle fibres at sarcomere lengths below optimum. J. Physiol. 1981;319:205–217. doi: 10.1113/jphysiol.1981.sp013902. [DOI] [PMC free article] [PubMed] [Google Scholar]
- 6.Huxley H.E., Stewart A., Irving T. X-ray diffraction measurements of the extensibility of actin and myosin filaments in contracting muscle. Biophys. J. 1994;67:2411–2421. doi: 10.1016/S0006-3495(94)80728-3. [DOI] [PMC free article] [PubMed] [Google Scholar]
- 7.Wakabayashi K., Sugimoto Y., Amemiya Y. X-ray diffraction evidence for the extensibility of actin and myosin filaments during muscle contraction. Biophys. J. 1994;67:2422–2435. doi: 10.1016/S0006-3495(94)80729-5. [DOI] [PMC free article] [PubMed] [Google Scholar]
- 8.Bagni M.A., Cecchi G., Poggesi C. Tension and stiffness of frog muscle fibres at full filament overlap. J. Muscle Res. Cell Motil. 1990;11:371–377. doi: 10.1007/BF01739758. [DOI] [PubMed] [Google Scholar]
- 9.Forcinito M., Epstein M., Herzog W. Theoretical considerations on myofibril stiffness. Biophys. J. 1997;72:1278–1286. doi: 10.1016/S0006-3495(97)78774-5. [DOI] [PMC free article] [PubMed] [Google Scholar]
- 10.Bagni M.A., Cecchi G., Colomo F. Sarcomere tension-stiffness relation during the tetanus rise in single frog muscle fibres. J. Muscle Res. Cell Motil. 1999;20:469–476. doi: 10.1023/a:1005582324129. [DOI] [PubMed] [Google Scholar]
- 11.Mijailovich S.M., Fredberg J.J., Butler J.P. On the theory of muscle contraction: filament extensibility and the development of isometric force and stiffness. Biophys. J. 1996;71:1475–1484. doi: 10.1016/S0006-3495(96)79348-7. [DOI] [PMC free article] [PubMed] [Google Scholar]
- 12.Ford L.E., Huxley A.F., Simmons R.M. Tension transients during the rise of tetanic tension in frog muscle fibres. J. Physiol. 1986;372:595–609. doi: 10.1113/jphysiol.1986.sp016027. [DOI] [PMC free article] [PubMed] [Google Scholar]
- 13.Goldman Y.E., Huxley A.F. Actin compliance: are you pulling my chain? Biophys. J. 1994;67:2131–2133. doi: 10.1016/S0006-3495(94)80700-3. [DOI] [PMC free article] [PubMed] [Google Scholar]
- 14.Bagni M.A., Cecchi G., Schoenberg M. A model of force production that explains the lag between crossbridge attachment and force after electrical stimulation of striated muscle fibers. Biophys. J. 1988;54:1105–1114. doi: 10.1016/S0006-3495(88)83046-7. [DOI] [PMC free article] [PubMed] [Google Scholar]
- 15.Bagni M.A., Cecchi G., Colombini B. Crossbridge properties investigated by fast ramp stretching of activated frog muscle fibres. J. Physiol. 2005;565:261–268. doi: 10.1113/jphysiol.2005.085209. [DOI] [PMC free article] [PubMed] [Google Scholar]
- 16.Colombini B., Bagni M.A., Cecchi G. Characterization of actomyosin bond properties in intact skeletal muscle by force spectroscopy. Proc. Natl. Acad. Sci. USA. 2007;104:9284–9289. doi: 10.1073/pnas.0611070104. [DOI] [PMC free article] [PubMed] [Google Scholar]
- 17.Cecchi G., Griffiths P.J., Taylor S. The kinetics of cross-bridge attachment and detachment studied by high frequency stiffness measurements. Adv. Exp. Med. Biol. 1984;170:641–655. doi: 10.1007/978-1-4684-4703-3_60. [DOI] [PubMed] [Google Scholar]
- 18.Griffiths P.J., Ashley C.C., Cecchi G. Cross-bridge attachment and stiffness during isotonic shortening of intact single muscle fibers. Biophys. J. 1993;64:1150–1160. doi: 10.1016/S0006-3495(93)81481-4. [DOI] [PMC free article] [PubMed] [Google Scholar]
- 19.Ford L.E., Huxley A.F., Simmons R.M. Tension transients during steady shortening of frog muscle fibres. J. Physiol. 1985;361:131–150. doi: 10.1113/jphysiol.1985.sp015637. [DOI] [PMC free article] [PubMed] [Google Scholar]
- 20.Colombini B., Nocella M., Bagni M.A. Crossbridge properties during force enhancement by slow stretching in single intact frog muscle fibres. J. Physiol. 2007;585:607–615. doi: 10.1113/jphysiol.2007.141440. [DOI] [PMC free article] [PubMed] [Google Scholar]
- 21.Linari M., Piazzesi G., Lombardi V. The effect of myofilament compliance on kinetics of force generation by myosin motors in muscle. Biophys. J. 2009;96:583–592. doi: 10.1016/j.bpj.2008.09.026. [DOI] [PMC free article] [PubMed] [Google Scholar]
- 22.Cheung A., Dantzig J.A., Straight A.F. A small-molecule inhibitor of skeletal muscle myosin II. Nat. Cell Biol. 2002;4:83–88. doi: 10.1038/ncb734. [DOI] [PubMed] [Google Scholar]
- 23.Pinniger G.J., Bruton J.D., Ranatunga K.W. Effects of a myosin-II inhibitor (N-benzyl-p-toluene sulphonamide, BTS) on contractile characteristics of intact fast-twitch mammalian muscle fibres. J. Muscle Res. Cell Motil. 2005;26:135–141. doi: 10.1007/s10974-005-2679-2. [DOI] [PubMed] [Google Scholar]
- 24.Shaw M.A., Ostap E.M., Goldman Y.E. Mechanism of inhibition of skeletal muscle actomyosin by N-benzyl-p-toluenesulfonamide. Biochemistry. 2003;42:6128–6135. doi: 10.1021/bi026964f. [DOI] [PubMed] [Google Scholar]
- 25.Huxley A.F., Lombardi V., Peachey L.D. A system for fast recording of longitudinal displacement of a striated muscle fibre. J. Physiol. 1981;317:12P–13P. [Google Scholar]
- 26.Bagni M.A., Cecchi G., Colomo F. Force responses to fast ramp stretches in stimulated frog skeletal muscle fibres. J. Muscle Res. Cell Motil. 1998;19:33–42. doi: 10.1023/a:1005348209816. [DOI] [PubMed] [Google Scholar]
- 27.Seebohm B., Matinmehr F., Kraft T. Cardiomyopathy mutations reveal variable region of myosin converter as major element of cross-bridge compliance. Biophys. J. 2009;97:806–824. doi: 10.1016/j.bpj.2009.05.023. [DOI] [PMC free article] [PubMed] [Google Scholar]
- 28.Flitney F.W., Hirst D.G. Cross-bridge detachment and sarcomere ‘give’ during stretch of active frog's muscle. J. Physiol. 1978;276:449–465. doi: 10.1113/jphysiol.1978.sp012246. [DOI] [PMC free article] [PubMed] [Google Scholar]
- 29.Getz E.B., Cooke R., Lehman S.L. Phase transition in force during ramp stretches of skeletal muscle. Biophys. J. 1998;75:2971–2983. doi: 10.1016/S0006-3495(98)77738-0. [DOI] [PMC free article] [PubMed] [Google Scholar]
- 30.Bagni M.A., Cecchi G., Colomo F. A non-cross-bridge stiffness in activated frog muscle fibers. Biophys. J. 2002;82:3118–3127. doi: 10.1016/S0006-3495(02)75653-1. [DOI] [PMC free article] [PubMed] [Google Scholar]
Associated Data
This section collects any data citations, data availability statements, or supplementary materials included in this article.