

Abstract
Current methods for screening cell receptor internalization often require complex image analysis with limited sensitivity. Here we describe a novel bioassay based on detection of changes in global fluorescence lifetime above a gold substrate, with superresolution axial sensitivity and no need for image analysis. We show that the lifetime of enhanced green fluorescent protein expressed in a cellular membrane is greatly reduced in close proximity to the gold, resulting in a distance-dependent lifetime distribution throughout the cell. We demonstrate the application of this phenomenon in a screening assay by comparing the efficacies of two small molecule inhibitors interfering with the internalization process of a G protein-coupled receptor.
Introduction
The development of automated screening techniques has revolutionized the use of microscopy as an analytical tool; a fast quantitative assessment of differences in cellular phenotype can be made using assays to monitor protein cellular localization (1). A receptor-ligand pair currently attracting considerable interest is CXCR4 and CXCL12 (SDF-1α), which is critical for embryonic development and cellular migration in adults. Furthermore, these proteins are involved in a variety of diseases including HIV (2) and cancer (3). An important aspect of CXCR4 function involves the recruitment of components of the endocytic machinery, which leads to receptor internalization (see Fig. 4 a in Signoret et al. (4)). To determine the efficacy of small molecule inhibitors in disrupting this process, most assays currently in use utilize, e.g., GTP and receptor binding, Ca2+-flux, and chemotaxis; however, none of these assays measures receptor internalization directly. Receptor binding assays give the most explicit measure of disruption, but do not give any indication of the fate of the receptor.
Figure 4.
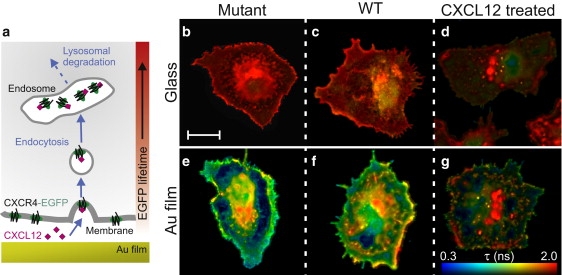
(a) Schematic showing CXCR4-mediated endocytosis of CXCL12. The Au film produces a spatial variation in the EGFP lifetime. (b–g) FLIM images of mammary adenocarcinoma cells on glass (top row) and on a 30-nm Au film (bottom row). Scale bar, 10 μm. Each image was acquired in the focal plane of the substrate and has the same lifetime scale. (b and e) Mutant cells expressing internalization defective Δ34-CXCR4-EGFP. (c and f) WT cells expressing CXCR4-EGFP. (d and g) WT cells after treatment with 100 nM of CXCL12 for 45 min.
Current screening systems that are able to discriminate internalization are fluorescence-intensity based and use high-resolution confocal microscopy and sophisticated automated image analysis algorithms (5,6): to get unambiguous results, this analysis requires the identification and parameterization of a large number of features for any particular image, necessitating a substantial technical knowledge in implementation and significant care in evaluation. Furthermore, conventional confocal imaging has an axial resolution of ∼500 nm, at best—which greatly limits the sensitivity of this technique to subtle membrane-bound protein dynamics. Although total internal reflection microscopy can be used to monitor these membrane events (7), this technique is insensitive to processes in the bulk of the cell; it also relies on intensity-based image analysis that is limited by uncertainty over spatial variations in fluorophore concentration.
Fluorescence lifetime imaging microscopy (FLIM) has become established as an extremely powerful tool in the physical and life sciences (8), and is a key optical technique for imaging protein interactions in situ (9–11). Lifetime-based techniques are generally insensitive to sample inhomogeneity and variations in fluorophore concentration. This offers significant advantages over intensity-based techniques in cellular assays, especially in automated systems. The modification of fluorescence lifetime via Förster resonance energy transfer has been investigated for unsupervised screening applications (12,13), but this technique requires multiple fluorescence labels and a large number of image acquisition and analysis steps. The photophysics of fluorescent molecules can also be strongly modified by the presence of a metallic structure, leading to changes in emission intensity, quantum efficiency, and radiative and nonradiative decay rates (14–17). Intensity-based effects have led to the development of a range of potential biomedical applications (18), and Le Moal et al. (19) have measured a fourfold increase in collected fluorescence signal using metal-coated slides. However, to date, lifetime-based effects have not been utilized for image-free cellular assays. Here we report a novel, reproducible, and sensitive assay to measure receptor internalization that utilizes distance-dependent changes in fluorescence lifetime above a gold film, with no need for image analysis.
Materials and Methods
Slide preparation
Sixteen-well LabTek chamber slides (Thermo Fisher Scientific, Roskilde, Denmark) were disassembled, and 30–60-nm-thick gold films were deposited on the slides by thermal evaporation of Au (Agar Scientific, Stansted, UK; 99.99% purity) in a vacuum chamber at 10−6 Torr (E306A; Edwards, Crawley, UK). The nominal thickness of gold deposited onto the glass was measured during evaporation with a quartz crystal oscillator (E5550; Quorum Technologies, Ringmer, UK). The chamber slides were reassembled and tested for integrity.
Lifetime calibration
Polymer microspheres conjugated with fluorescein isothiocyanate (FITC) (M0162; Sigma, Gillingham, UK) with an average diameter of 8.5 μm were used as a lifetime calibration standard. Two-hundred microliters of the microspheres were centrifuged at 5000 rpm for 2 min. The supernatant was removed, and 100 μL of Mowiol (ICN, Irvine, CA) containing Dabco as an antifade was added and well mixed. A few drops of the microspheres were placed on a 50-nm Au film and covered with a glass coverslip.
Cloning, generation of stable cell lines, and cell culture
The DNA of the human chemokine receptor CXCR4 was fused to the N-terminus of enhanced green fluorescent protein (EGFP) by subcloning its coding sequence between the HindIII and EcoR1 sites of pEGFP-N1 (Clontech, Saint-Germain-en-Laye, France). Subsequently, this C-terminal fusion protein was subcloned into the retroviral expression vector pLPCX (Clontech). In contrast to other binding assays, here the N-terminus of the CXCR4 is left unmodified and is thus able to bind to a ligand unimpeded. To make an internalization-defective mutant, CXCR4 was generated lacking the C-terminal 34 amino acids (4). This mutant receptor was also fused to EGFP and then subcloned into pLPCX. Both constructs were confirmed by sequence analysis and a virus was produced by standard techniques. Mammary adenocarcinoma cells (MTLn3E) stably expressing human CXCR4-EGFP or Δ34-CXCR4-EGFP were obtained after retroviral infection, selection with puromycine (1 μg/mL), and fluorescence-activated cell sorting in order to obtain single clones with comparable expression levels. One single clone was selected and used for all further experiments. All cell lines were cultured in αMEM supplemented with 5% fetal bovine serum, penicillin/streptomycin (100 IU), and L-glutamine in an atmosphere containing 5% CO2 (v/v) either in the presence or the absence of the respective selection antibiotic. Cells were trypsinized and plated in wells of the Au-covered chamber slides.
Treatment and fixing of cells
Once attached to the gold films, cells were grown to the desired cell densities; specific wells were treated with the CXCR4 ligand CXCL12 (Peprotech, London, UK) at the indicated concentrations for 45 min either in the presence or the absence of CXCR4 inhibitors. CXCR4 inhibitors used were AMD3100 (Sigma, Dorset, UK) or Cu2CBbicyclam, which is a second-generation metallodrug with restricted conformational freedom (20). Subsequently, cells were fixed in 4% (w/v) paraformaldehyde for 15 min, treated with NaBH4 (1 mg/mL), and mounted in Mowiol. All standard chemicals were either from Sigma-Aldrich or VWR (Lutterworth, UK).
Fluorescence lifetime imaging
Fluorescence lifetime and intensity images were obtained using a scanning confocal microscope (TCSP2; Leica, Mannheim, Germany) scanning at 400 Hz with a 63× oil immersion lens (1.4 NA; Leica). Photon detection was with a photomultiplier tube (PCM-100; Becker and Hickl, Berlin, Germany) and a synchronous time-correlated single photon counting module (SPC-830; Becker and Hickl). A 464-nm long-pass filter (XE458; Omega Optical, Brattleboro, VT) and EGFP band-pass filter (525/50M; Chroma Technology, Rockingham, VT) were fitted before the detector. Excitation was at 442 nm and 76 MHz using a Ti:Sapphire laser (Mira 900; Coherent Laser, Santa Clara, CA) with frequency doubler. All lifetime measurements were acquired in the focal plane of the Au film. The microscope confocal aperture was opened to the maximum size (5 Airy units, 575 μm), except for results explicitly described as confocal, where it was 1 Airy unit (115 μm). The larger aperture gave a higher degree of contrast in lifetime between cell phenotypes due to the increased sampling depth, and a approximately fivefold increase in signal. The laser power was adjusted to give average photon counting rates of ∼105–106 photons s−1 (<5 μW), below the maximum rate of the photon counting electronics and far below the fluorescence saturation level. The photon arrival times were binned into 256 time windows over a period of 10 ns.
Spatially integrated lifetime measurements were acquired from areas containing >20 cells (80–100 μm dimensions). An integration time of 5–10 s was used to give a total decay transient with a preexponential intensity of >5 × 10⁴ photons: this integration time was mainly limited by the laser scanning rate; integrating for 1 s at 1000 Hz gave equivalent statistics. The decay transient was fitted with a stretched exponential function (see below) using iterative reconvolution software (TRI2) (21), including an instrument response time of ∼180 ps. Spatially resolved fluorescence lifetime images were acquired for 300–600 s at a resolution of 256 × 256 pixels. A circular bin of radius 5–8 pixels was applied to give a preexponential signal >103 photons, using a low threshold of 1% of the maximum intensity. The decay transient for each pixel bin was fitted with a stretched exponential to give spatially resolved images of τ, h, and the reduced χ2 (see Fig. S1 in the Supporting Material).
The stretched exponential (Kohlrausch decay) function has the form
| (1) |
where I(t) is the fluorescence intensity at time t, Z is the background, A is the preexponential intensity, τ is the characteristic timescale of the decay, and h is a heterogeneity parameter; an h value of 1 indicates a single homogeneous lifetime (22). A discussion on the suitability of different fitting models is given in the Supporting Material.
Data analysis
Data analysis and graphing was performed in Origin 8 (MicroCal, Northampton, MA). Statistical significance was calculated using a two-tailed Welch's t-test for testing two independent samples with unequal sizes and variances. Concentration response curves and IC50 values were obtained from sigmoidal (logistic) fits.
Results and Discussion
Lifetime calibration
The modification of fluorescence lifetime and intensity for a fluorophore above a metal surface is well known, and is discussed in detail elsewhere (17,23,24); in particular, for sub-wavelength separations, a large increase in nonradiative damping leads to a predominant drop in both intensity and lifetime. To quantify this lifetime change above an Au film for our experimental configuration, we used a calibration system that closely mimics cell geometry, with photophysical properties that are similar to EGFP (Fig. 1). FLIM images were acquired in the focal plane of the Au film by imaging through a microsphere, as shown in Fig. 1 a: we find that the lifetime of a fluorophore decreases approximately exponentially <100 nm from the surface of an Au film, as expected (Fig. 1 d). The small (±5%) oscillations in lifetime observed in Fig. 1 d arise from interference effects and are qualitatively consistent with previous reports (14,25); a more detailed theoretical analysis requires careful consideration of other factors such as polarization. As expected, there is no detectable lifetime variation above a glass surface. We conservatively estimate the FLIM system to be sensitive to a 5% change in fluorescence lifetime (∼0.1 ns); from Fig. 1 d this corresponds to a distance sensitivity of ≲20 nm. It is important to stress that, although the volume probed by a laser spot is not significantly changed in the presence of an Au film, these results indicate that a superresolution axial position sensitivity can be obtained in FLIM measurements without any additional optics.
Figure 1.
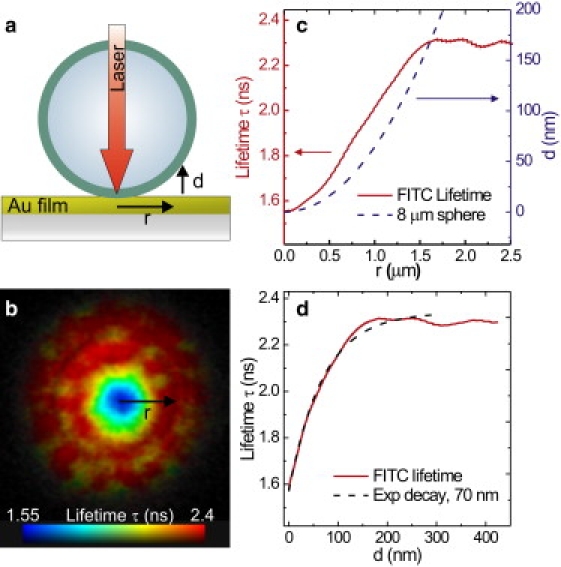
Distance-dependent lifetime calibration using an 8-μm diameter FITC-labeled latex microsphere as a model of a membrane-labeled cell, on a 30-nm Au film. (a) Schematic of the experimental geometry: lifetimes were measured in the focal plane of the Au film by imaging through the sphere; r is the radial distance from the point of contact, and d the vertical distance above the film. (b) 10 × 10 μm FLIM image calculated from a biexponential fit with a fixed 170-ps component. (c) (Left axis) Radial lifetime profile obtained from b by averaging 10 line profiles. (Right axis) Geometrical cross section of an 8-μm sphere. (d) FITC lifetime versus distance from Au film, calculated from panel c. The average unmodified lifetime of conjugated FITC is 2.3 ns and the lifetime decays approximately exponentially near to the film with a constant of 70 nm.
These metal-induced lifetime modifications were investigated for mutant cells expressing CXCR4-EGFP in the membrane, grown on an Au film: Fig. 2 a shows a schematic of the geometry with the expected distance-dependence of the fluorescence lifetime. The cross-section confocal FLIM image of a cell in Fig. 2 c shows that the EGFP lifetime is significantly reduced in the bottom membrane nearest to the film, but is unmodified in parts of the cell further above the Au film.
Figure 2.
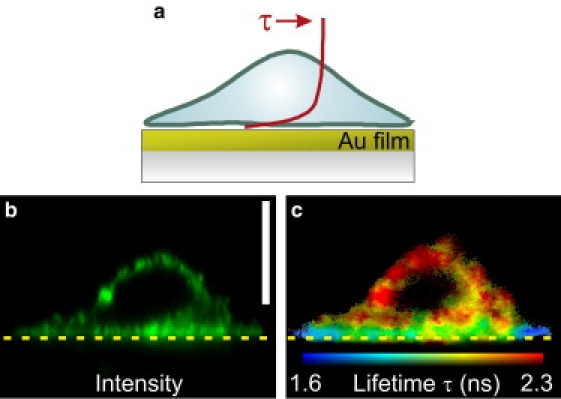
Confocal xz cross-section fluorescence images of a mutant cell on a 30-nm Au film. (a) Schematic of the experimental geometry. The curve shows the approximate distance-dependence of the fluorescence lifetime (Fig. 1d). (b) EGFP fluorescence intensity. The vertical scale bar is 5 μm. (c) Corresponding FLIM image calculated from a biexponential fit.
FLIM
To investigate the sensitivity of these lifetime effects to redistribution of the fluorophores throughout the cell, wild-type (WT) and internalization-defective mutant cell lines were treated with CXCL12 to induce internalization; before treatment, mutant and WT cells give essentially indistinguishable intensity images (Fig. 3, a and b). After treatment with CXCL12, the membrane-bound EGFP is internalized in the WT cells via receptor-mediated endocytosis (Fig. 4 a), which results in localized emission hotspots and a reduced contribution from the membrane (Fig. 3 c). Intensity-weighted FLIM images were acquired from individual cells on glass and on a 30-nm Au film (Fig. 4); a stretched exponential fitting function has been used with characteristic lifetime τ and homogeneity parameter h. All of the cells on glass have very narrow lifetime distributions at ∼2 ns with no concentration-induced lifetime quenching effects (Fig. 4, b–d). In contrast, similar cells on the Au film show a greater-than-sixfold lifetime reduction in certain regions (16). Importantly, there is a clear difference in the lifetime distributions of WT cells without and with CXCL12 treatment (Fig. 4, f and g, respectively); this is a direct result of the distance-dependence of the EGFP lifetime above the Au film (Fig. 4 a).
Figure 3.

Fluorescence images of different cell types on a 60-nm Au film (80 × 80 μm). (a) Mutant, (b) WT, and (c) WT treated with 10-nM CXCL12 for 45 min.
To quantify these changes in the EGFP lifetime between various cell phenotypes, spatially integrated lifetimes were obtained for each phenotype from random areas (n ≥ 15) each containing ∼20 cells, on an Au film and on glass. Fig. 5 a shows FLIM images of typical areas, but in practice only a single spatially integrated decay transient was acquired for each area (Fig. 5 b), from which the fitting parameters τ and h were obtained. For the cells on the Au film, the data are clustered into well-defined regions in the parameter space (Fig. 5 c); in contrast, on glass all of the cell types have essentially identical fluorescence decay characteristics.
Figure 5.
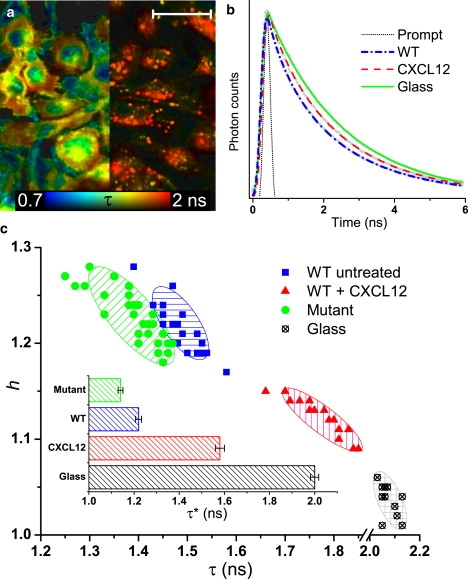
(a) FLIM images from areas of ∼20 WT cells on a 30-nm Au film: (left) untreated, (right) after treatment with CXCL12. Scale bar, 25 μm. (b) Spatially integrated decay transients with stretched exponential fits from 100 × 100 μm areas of WT cells with (dashed red) and without (dash-dot blue) CXCL12 on a 30-nm Au film and on glass (solid green line). The thin dotted line shows the system response. (c) Scatter plot of the parameters τ and h obtained from the fits in panel b, for multiple measurements. Hatched regions are guides to the eyes. (Inset) Mean ± SE of τ∗ = τ/h for each data set.
For the purposes of a simple univariate screening assay, we have calculated the reduced lifetime τ∗ = τ/h for each measurement taken. The τ∗ values for each cell phenotype were found to be approximately normally distributed (see Fig. S2). The mean τ∗ value for each cell phenotype (inset, Fig. 5 c) is significantly different (t-test, P < 0.0001) and thus each phenotype can be uniquely identified with a relatively small sample size. This is especially important in identifying subtle variations in phenotype which might not be detected by assays that are based on image analysis algorithms, such as between the mutant and WT cells (compare Fig. 3, a and b).
Agonist and antagonist assays
As this technique requires only one parameter, a set of reference values can be easily established from control samples, so that an unknown phenotype can be quickly parameterized and identified in subsequent measurements. To validate this method as a viable screening assay, WT cells were treated with varying concentrations of CXCL12 before fixing. The τ∗ values were then obtained from random sample areas at each concentration, and the average value calculated (Fig. 6 a). A simulated concentration response curve shows that the data fits well with the expected EC50 (50% effective concentration) value of ∼3 nM obtained using existing techniques (26). In contrast, there is no measurable difference in τ∗ for the internalization-defective mutant cells treated with CXCL12, indicating that the observed lifetime change is not simply a direct result of the presence of CXCL12.
Figure 6.
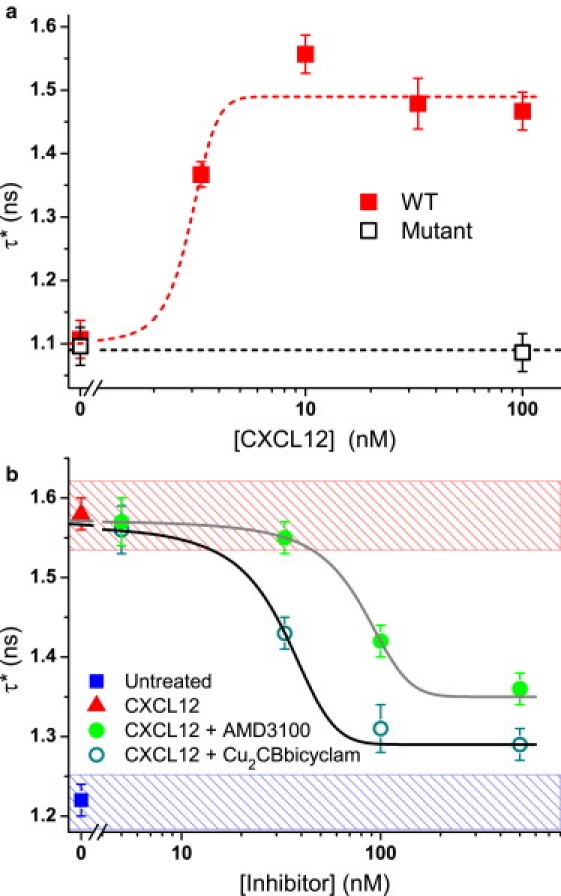
(a) CXCL12 concentration response obtained from a lifetime-based CXCR4 agonist assay of WT and mutant cells on a 60-nm Au film. The simulated curve has an EC50 value of 3 nM and a Hill slope of 1. (b) Concentration response curves for AMD3100 and Cu2CBbicyclam obtained from lifetime-based CXCR4 antagonist assays of WT cells on a 30-nm Au film (100 nM CXCL12). The fitted curves have IC50 values of 80 ± 3 and 32 ± 2 nM, respectively. The hatched regions indicate 95% CIs of the controls with untreated and internalized cells. Data points are mean ± SE (n ≥ 15). Note that the shift in τ∗ values between a and b is due to the difference in Au film thickness.
Subsequently, we tested the suitability of this novel technique for screening small molecule inhibitors that interfere with receptor internalization: an antagonist assay was investigated for CXCL12 in the presence of increasing concentrations of the CXCR4 inhibitors AMD3100 or Cu2CBbicyclam (see Methods) (Fig. 6 b). For both inhibitors, with fewer than 20 measurements the mean τ∗ value at saturation concentrations is significantly lower (P < 0.0001) than that of the internalized CXCL12 control. Response curves have been calculated for AMD3100 and Cu2CBbicyclam inhibition of CXCR4-EGFP internalization, with associated IC50 values of 80 ± 3 and 32 ± 2 nM, respectively: for AMD3100 this value is comparable to those obtained from other assays involving CXCL12 mediation (e.g., 27 ± 2.2 nM for GTP-binding, 51 ± 17 nM for chemotaxis in T-cells) (27). The lower IC50 value of Cu2CBbicyclam is consistent with the previously reported superior performance of this compound relative to AMD3100 (20).
Conclusion
We have quantitatively measured the distance-dependent variation in fluorescence lifetime above a gold film in a cellular environment, and obtain an axial position sensitivity of ≲20 nm above the surface. By fusing EGFP to the G protein-coupled receptor CXCR4, we find a significant reduction in lifetime occurs only in the bottom cellular membrane in close proximity to the film. CXCL12-induced internalization of the receptor results in an increase in EGFP lifetime during endocytosis. We have utilized this phenomenon in a novel assay that provides a direct measurement of receptor internalization and its inhibition based on a simple one-parameter analysis of global fluorescence lifetime. This technique is highly sensitive to variations in cell phenotype and we are able to discriminate between wild-type and mutant cell lines. Tests of two different small molecule inhibitors show a significant difference in efficacies, and this technique could be adapted for a large variety of other agonist and antagonist assays. In contrast to intensity-based total internal reflection microscopy, this technique is sensitive to processes in both the cell membrane and body and is insensitive to variations in fluorophore concentration. Furthermore, high-resolution confocal imaging and sophisticated image analysis are not required; thus, large areas of cells can be averaged over, providing results that require fewer measurements but are actually more accurate. Simultaneous monitoring of different protein channels could be easily implemented using multiple fluorescence labels and suitable detection filters.
Supporting Material
Two figures are available at http://www.biophysj.org/biophysj/supplemental/S0006-3495(10)00346-2.
Supporting Material
Acknowledgments
We thank S. Ameer-Beg, F. Festy, and K. Suhling (King's College London) for helpful discussions and advice.
This work was supported by Cancer Research UK, the Engineering and Physical Sciences Research Council, the Medical Research Council, the Department of Health, and the King's College London and University College London Comprehensive Cancer Imaging Centre (C1519/A10331).
References
- 1.Evanko D. Imaging through automation. Nat. Methods. 2009;6:34. [Google Scholar]
- 2.Bleul C.C., Farzan M., Springer T.A. The lymphocyte chemoattractant SDF-1 is a ligand for LESTR/fusin and blocks HIV-1 entry. Nature. 1996;382:829–833. doi: 10.1038/382829a0. [DOI] [PubMed] [Google Scholar]
- 3.Müller A., Homey B., Zlotnik A. Involvement of chemokine receptors in breast cancer metastasis. Nature. 2001;410:50–56. doi: 10.1038/35065016. [DOI] [PubMed] [Google Scholar]
- 4.Signoret N., Rosenkilde M.M., Marsh M. Differential regulation of CXCR4 and CCR5 endocytosis. J. Cell Sci. 1998;111:2819–2830. doi: 10.1242/jcs.111.18.2819. [DOI] [PubMed] [Google Scholar]
- 5.Blake R.A. Cellular screening assays using fluorescence microscopy. Curr. Opin. Pharmacol. 2001;1:533–539. doi: 10.1016/s1471-4892(01)00092-3. [DOI] [PubMed] [Google Scholar]
- 6.Haasen D., Merk S., Heilker R. Pharmacological profiling of chemokine receptor-directed compounds using high-content screening. J. Biomol. Screen. 2008;13:40–53. doi: 10.1177/1087057107312128. [DOI] [PubMed] [Google Scholar]
- 7.Axelrod D. Total internal reflection fluorescence microscopy in cell biology. Traffic. 2001;2:764–774. doi: 10.1034/j.1600-0854.2001.21104.x. [DOI] [PubMed] [Google Scholar]
- 8.Levitt J.A., Matthews D.R., Suhling K. Fluorescence lifetime and polarization-resolved imaging in cell biology. Curr. Opin. Biotechnol. 2009;20:28–36. doi: 10.1016/j.copbio.2009.01.004. [DOI] [PubMed] [Google Scholar]
- 9.Ng T., Squire A., Parker P.J. Imaging protein kinase Cα activation in cells. Science. 1999;283:2085–2089. doi: 10.1126/science.283.5410.2085. [DOI] [PubMed] [Google Scholar]
- 10.Festy F., Ameer-Beg S.M., Suhling K. Imaging proteins in vivo using fluorescence lifetime microscopy. Mol. Biosyst. 2007;3:381–391. doi: 10.1039/b617204k. [DOI] [PubMed] [Google Scholar]
- 11.Makrogianneli K., Carlin L.M., Ng T. Integrating receptor signal inputs that influence small Rho GTPase activation dynamics at the immunological synapse. Mol. Cell. Biol. 2009;29:2997–3006. doi: 10.1128/MCB.01008-08. [DOI] [PMC free article] [PubMed] [Google Scholar]
- 12.Esposito A., Dohm C.P., Wouters F.S. Unsupervised fluorescence lifetime imaging microscopy for high content and high throughput screening. Mol. Cell. Proteomics. 2007;6:1446–1454. doi: 10.1074/mcp.T700006-MCP200. [DOI] [PubMed] [Google Scholar]
- 13.Talbot C.B., McGinty J., French P.M. High speed unsupervised fluorescence lifetime imaging confocal multiwell plate reader for high content analysis. J. Biophotonics. 2008;1:514–521. doi: 10.1002/jbio.200810054. [DOI] [PubMed] [Google Scholar]
- 14.Chance R.R., Miller A.H., Silbey R. Fluorescence and energy transfer near interfaces: The complete and quantitative description of the Eu+3/mirror systems. J. Chem. Phys. 1975;63:1589–1595. [Google Scholar]
- 15.Fort E., Grésillon S. Surface enhanced fluorescence. J. Phys. D Appl. Phys. 2008;41:013001. [Google Scholar]
- 16.Zhang J., Fu Y., Lakowicz J.R. Enhanced fluorescence images for labeled cells on silver island films. Langmuir. 2008;24:12452–12457. doi: 10.1021/la801749f. [DOI] [PMC free article] [PubMed] [Google Scholar]
- 17.Cade N.I., Ritman-Meer T., Richards D. The plasmonic engineering of metal nanoparticles for enhanced fluorescence and Raman scattering. Nanotechnology. 2009;20:285201. doi: 10.1088/0957-4484/20/28/285201. [DOI] [PubMed] [Google Scholar]
- 18.Aslan K., Lakowicz J.R., Geddes C.D. Plasmon light scattering in biology and medicine: new sensing approaches, visions and perspectives. Curr. Opin. Chem. Biol. 2005;9:538–544. doi: 10.1016/j.cbpa.2005.08.021. [DOI] [PMC free article] [PubMed] [Google Scholar]
- 19.Le Moal E.L., Fort E., Ricolleau C. Enhanced fluorescence cell imaging with metal-coated slides. Biophys. J. 2007;92:2150–2161. doi: 10.1529/biophysj.106.096750. [DOI] [PMC free article] [PubMed] [Google Scholar]
- 20.Khan A., Nicholson G., Archibald S.J. Binding optimization through coordination chemistry: CXCR4 chemokine receptor antagonists from ultrarigid metal complexes. J. Am. Chem. Soc. 2009;131:3416–3417. doi: 10.1021/ja807921k. [DOI] [PMC free article] [PubMed] [Google Scholar]
- 21.Barber P., Ameer-Beg S., Vojnovic B. Multiphoton time-domain fluorescence lifetime imaging microscopy: practical application to protein-protein interactions using global analysis. J. R. Soc. Interface. 2009;6:S93–S105. [Google Scholar]
- 22.Lee K.C., Siegel J., French P.M. Application of the stretched exponential function to fluorescence lifetime imaging. Biophys. J. 2001;81:1265–1274. doi: 10.1016/S0006-3495(01)75784-0. [DOI] [PMC free article] [PubMed] [Google Scholar]
- 23.Kühn S., Håkanson U., Sandoghdar V. Enhancement of single-molecule fluorescence using a gold nanoparticle as an optical nanoantenna. Phys. Rev. Lett. 2006;97:017402. doi: 10.1103/PhysRevLett.97.017402. [DOI] [PubMed] [Google Scholar]
- 24.Cesa Y., Blum C., Subramaniam V. Manipulation of the local density of photonic states to elucidate fluorescent protein emission rates. Phys. Chem. Chem. Phys. 2009;11:2525–2531. doi: 10.1039/b817902f. [DOI] [PubMed] [Google Scholar]
- 25.Huang F.M., Richards D. Fluorescence enhancement and energy transfer in apertureless scanning near-field optical microscopy. J. Opt. A, Pure Appl. Opt. 2006;8:S234–S238. [Google Scholar]
- 26.Veldkamp C.T., Seibert C., Volkman B.F. Structural basis of CXCR4 sulfotyrosine recognition by the chemokine SDF-1/CXCL12. Sci. Signal. 2008;1:ra4. doi: 10.1126/scisignal.1160755. [DOI] [PMC free article] [PubMed] [Google Scholar]
- 27.Fricker S.P., Anastassov V., Wong R.S. Characterization of the molecular pharmacology of AMD3100: a specific antagonist of the G-protein coupled chemokine receptor, CXCR4. Biochem. Pharmacol. 2006;72:588–596. doi: 10.1016/j.bcp.2006.05.010. [DOI] [PubMed] [Google Scholar]
Associated Data
This section collects any data citations, data availability statements, or supplementary materials included in this article.