

Abstract
Systemic levels of proinflammatory cytokines such as interleukin-6 (IL-6) increase in old age and may contribute to neural atrophy in humans. We investigated IL-6 associations with age in T1-weighted segments and microstructural diffusion indices using MRI in aged rhesus monkeys (Macaca mulatta). Further, we determined if long-term 30% calorie restriction (CR) reduced IL-6 and attenuated its association with lower tissue volume and density. Voxel-based morphometry (VBM) and diffusion-weighted voxel-wise analyses were conducted. IL-6 was associated with less global gray and white matter (GM, WM), as well as smaller parietal and temporal GM volumes. Lower fractional anisotropy (FA) was associated with higher IL-6 levels along the corpus callosum and various cortical and subcortical tracts. Higher IL-6 concentrations across subjects were also associated with increased mean diffusivity (MD) throughout many brain regions, particularly in corpus callosum, cingulum, and parietal, frontal, and prefrontal areas. CR monkeys had significantly lower IL-6 and less associated atrophy. An IL-6*CR interaction across modalities also indicated that CR mitigated IL-6 related changes in several brain regions compared to controls. Peripheral IL-6 levels were correlated with atrophy in regions sensitive to aging and this relationship was decreased by CR.
Keywords: monkey, voxel-based morphometry, calorie restriction, aging, interleukin-6, atrophy
1. Introduction
Peripheral and central production of proinflammatory cytokines (PIC), including interleukin-6 (IL-6), upregulates oxidative stress in brain and increases age-related neural atrophy and risk for neurodegenerative pathologies (Ershler, 1993; Kagiwada et al., 2004; Baranowska-Bik et al., 2008; Qin et al., 2008; Chen et al., 2008; Baune et al., 2009). IL-6 concentrations in sera and spleen typically increase with age (Ferrucci et al., 1999; Ershler & Keller, 2000; Bruunsgaard et al., 2001) and age-related chronic inflammatory states (Brouqui et al. 1994; Devaux et al. 1997; De Keyser et al. 1998), which may prime microglia to overproduce PIC and contribute to neuronal degradation (Godbout et al., 2005; Deng et al., 2006; Cunningham et al., 2007; Kumagai et al., 2007; Perry et al., 2007; Teeling and Perry, 2008). In humans, peripheral IL-6 is related to lower global and regional gray and white matter volume (GM, WM; Hauss-Wegrzyniak et al., 2000; Jefferson et al., 2007; Marsland et al., 2008). Aging is similarly related to diffuse regional atrophy (Sowell et al., 2003), and therefore it was of interest to further investigate the relationship between neural indices and systemic IL-6 using a whole brain voxel-based approach in an aged animal model, the rhesus monkey (Macaca mulatta), that undergoes some of the age-related brain atrophy seen in humans (Roth et al., 2004).
IL-6 is uniquely suited for conducting these analyses and translating results to humans. The protein structure of IL-6 shares greater than 98% homology between monkeys and humans, and there is a strong relationship between peripheral and central IL-6 levels in rhesus monkeys (Reyes and Coe, 1996). In addition, because IL-6 is produced by many types of cells in the body, it is a stable biomarker of many physiological systems (Rao et al., 1994; Willette et al., 2007). By contrast, other PIC such as interleukin-1 and tumor necrosis factor-alpha are quite low in the blood stream in the absence of infection. IL-6 is also more readily measured in the healthy individual, and is widely used as a biomarker for chronic, low-grade systemic inflammation typically associated with aging (Bruunsgaard, 2002) and many disease states (Fonseca et al., 2009).
Neural atrophy related to IL-6 levels may be reduced by a calorically restricted diet (CR), which downregulates mRNA and protein expression of PIC (Spaulding et al., 1997; Arvidsson et al., 2004; You et al., 2007). CR also decreases Alzheimer’s disease-like neural sequelae in animal models (Qin et al., 2006; Halagappa et al., 2007), and can lower proinflammatory or oxidative stress factors in aged murine neocortex (Lee et al., 2000) and hippocampus (Wu et al., 2008). CR-induced reductions in visceral adiposity, body weight, and inflammatory pathologies may mediate decreases in peripheral IL-6 and were determined as possible mediating health factors ((Bruunsgaard, 2002; Bulcão et al., 2006; Colman et al., 2009). Finally, to confirm that IL-6 is a stable biomarker over time (Rao et al., 1994), this protein was assessed twice: when the monkey reached 20 years of age and later at the time of the scan.
This cross-sectional study used animals from a longitudinal CR project initiated in 1989 (Ramsey et al., 2000). Voxel-wise analyses of segmented T1-weighted and diffusion tensor imaging (DTI) data were performed. We hypothesized that higher IL-6 levels acquired proximal to the time of the MRI scan would be associated with: 1) decreased global GM and WM (Pang et al., 2003; Jefferson et al., 2007); and 2) decreased regional volumes, as well as lower fractional anisotropy (FA) and increased mean diffusivity (MD), in diffuse areas and tracts sensitive to age-related atrophy including: cortical and intrahemispheric parietal areas, superior temporal sulcus, corpus callosum, thalamus, the dorsal convexity post central sulcus, cingulate cortex, insula, and dorsal or medial portions of prefrontal cortex (PFC; Hauss-Wegrzyniak et al., 2000; Good et al., 2001; Sowell et al., 2003; Pfefferbaum et al., 2005; Sullivan et al., 2006; Kochunov et al., 2007; Pagani et al., 2008; Alexander et al., 2008; Marsland et al., 2008). FA is typically used to examine intravoxel tract coherence sensitive to changes in myelin and axons, while MD can broadly reflect changes in WM and GM tissue density. CR was expected to lower IL-6 and reduce associated neural atrophy. Further, Colman and colleagues (2009) recently showed that CR interacts with age to protect against atrophy. A complementary set of interaction analyses was thus conducted to assess the extent to which CR monkeys showed less atrophy per picogram/milliliter (pg/ml) increase in IL-6.
2. Materials and methods
2.1. Subjects
Forty-five rhesus monkeys between 19 and 31 years of age were utilized from a longitudinal CR project at the Wisconsin National Primate Research Center (WNPRC). 18 animals were fed a normal diet (mean age = 23.84 ± 2.79 (SD); 12 females, 6 males), while 27 CR subjects had been on a moderately restricted diet (30% reduction of intake) for approximately 12 to 17 years (mean age = 24.32 ± 2.77 (SD); 15 females, 12 males). Details of the CR manipulation have been described previously (Kemnitz et al., 1993; Ramsey et al., 2000). Animals were maintained at 21 °C; humidity 50-65%; 12h/12h light-dark cycle. Food was present for 6-8 hours per day; water was available ad libitum. Animals were individually housed and had continuous visual and auditory contact with other monkeys in the room. Research and care staff regularly inspected and interacted with the cohort approximately three times per day. Manipulanda and other environmental enrichment were provided to alleviate boredom. Scan acquisition, image processing, and IL-6 assays were conducted by personnel blind to dietary condition. The study was approved by the Institutional Animal Care and Use Committee.
2.2. Interleukin-6 assessment
Blood was collected at two time points: 1) within 6 months of the neuroimaging scan date to determine basal levels of circulating IL-6, and 2) when each animal reached 20 years of age. IL-6 was assayed using a commercial Enyzme-Linked Immunosorbent Assay (ELISA; R&D Systems, Minneapolis, MN) using methods similar to those described previously (Willette et al., 2007).
2.3. Body mass, visceral adiposity, and morbidity
Body weight (kg) was recorded within 48 hours prior to the MRI scan. Central adipose tissue in the peritoneum was assessed by MRI using the following procedure. First, a region of interest (ROI) was traced around the viscera of the thoracic cavity subjacent to subcutaneous adipose tissue. Subject-specific intensity thresholding was then used to isolate adipose tissue, followed by summing all voxels to obtain total central adiposity. It has been reported that Body Mass Index (BMI) does not appear to influence the relationship of IL-6 and neural atrophy (Marsland et al., 2008). Thus, for the purposes of this report, only visceral adiposity was evaluated as a correlate of IL-6 values. Finally, the presence of veterinarian-diagnosed inflammatory or illness conditions near the time of scan was considered, because such pathologies might markedly raise PIC (Brouqui et al. 1994; Devaux et al. 1997; De Keyser et al. 1998). The small sample size for glucoregulatory pathologies such as diabetes precluded statistical analysis (controls, n = 4; CR, n = 0). Inflammatory ailments included: arthritis (3), peritonitis (1), endometriosis (3), adenocarcinoma (4), gastric bloat (1), and bloat co-morbid with endometriosis (1). No acute or severe clinical illnesses due to infectious pathogens were noted near the time of sampling or scan. Monkeys were thus grouped into a binary variable as clinically healthy or having an inflammatory condition that could potentially affect IL-6 levels.
2.4. Image acquisition
Animals were sedated and images acquired as previously described on a General Electric 3.0 T Signa MR unit (GE Medical Systems, Milwaukee, WI, USA) using a quadrature Tx/Rx volume coil with an 18cm diameter (McLaren et al., 2009). Briefly, monkeys were maintained immobile in an optimal plane of anesthesia. A three-dimensional head-only coronal T1-weighted inversion recovery-prepped spoiled gradient echo (IR-prepped SPGR) sequence was collected with the following parameters: repetition time (TR) = 8.772 ms; echo time (TE) = 1.876 ms; inversion time (TI) = 600 ms; flip angle = 10°; number of excitations (NEX) = 2; matrix = 256×224; field of view = 160mm. 124 coronal slices were acquired with a thickness of 0.7 mm and no gap resulting in near isotropic 0.625 × 0.625 × 0.7 mm voxels. Head-only DTI data were acquired using a single-shot, spin-echo, diffusion-weighted echo-planar imaging (DW-EPI) sequence with diffusion gradients in twelve optimal directions and was employed using minimum energy criterion (Hasan et al., 2001). A diffusion-weighting of b = 816 s/mm2 was used. Other imaging parameters for this sequence were: axial acquisition; TR/TE = 10000/77.2ms; flip angle = 90°; NEX = 6, field of view = 160 mm; in-plane matrix = 120×120; slice thickness = 2.5mm; slice gap = 2.5mm; 124 slices. Image distortion in the DW-EPI data was minimized by a higher-order shimming protocol that was run before the DTI scan. Voxel size was resampled to 0.5 × 0.5 × 0.5 mm for both scan sequences. Finally, for the torso, a three-dimensional coronal T1-weighted fast gradient echo (FGRE) sequence was acquired during the same scan session. Parameters were: TR/TE = 15.7/1.404 ms; 27 coronal sections; flip angle = 20°; slice thickness = 4 mm; slice gap = 6 mm; NEX = 2; matrix =256 × 128; field of view = 200 mm; 0.781 × 0.781 × 6 mm voxels.
2.5. Head-only MRI pre-processing
T1-weighted images were manually deskulled, rotated, normalized to the 112RM-SL monkey atlas, and segmented into GM and WM probability maps in SPM5 as previously described (McLaren et al., 2009, 2010). Subject data were normalized to a common space for VBM analyses through Diffeomorphic Anatomical Registration using Exponentiated Lie Algebra (DARTEL; Ashburner, 2007; McLaren et al., 2010). These warped and modulated GM and WM images were thus moved into the same space, coordinates, and orientation as the D99-SL brain (Saleem et al., 2002). A 4mm FWHM Gaussian kernel was applied to smooth the images for analysis. An absolute threshold of 0.1 was applied for GM or WM volume to restrict analyses to the tissue class of interest.
The DTI data were processed as follows: image distortions caused by eddy currents were corrected using FSL’s FDT Diffusion Toolbox (http://www.fmrib.ox.ac.uk/fsl/fdt/index.htm). Three-dimensional maps of the diffusion tensor and derived measures were calculated using DTIFIT in FSL, including: FA, MD, axial diffusivity (λ1), and radial diffusivity ([λ2 + λ3] / 2]). In order to bring DTI maps into the 112RM-SL atlas for voxel-wise analysis, each subject’s non-diffusion weighted image (B0 map) was coregistered and normalized to a T2-weighted template through the combination of two transforms, where T2 acquisition has been described elsewhere (McLaren et al., 2009). The normalized images were smoothed using a 4mm FWHM isotropic Gaussian kernel. FA analyses were restricted to WM by using a binary prior probability map, in order discern changes in major fiber tracts; an absolute threshold of 0.1 was applied for each monkey to reduce the influence of morphology on results. MD maps were masked using a binary version of the 112RM-SL rhesus atlas, because MD is not overtly biased toward GM or WM tissue classes relative to FA. MD results did not change when binary GM and WM prior probability maps were separately used as masks and the resulting MD result maps combined.
2.6. Imaging artifacts
Images were inspected by experts (ASF, GX) in order to locate scanner artifacts that could influence volumetric or microstructural results. One T1-weighted scan and nine DTI scans were excluded from analyses due to motion, acquisition, respiration, and other distortion artifacts.
2.7. Statistical analyses and atlases
Due to wide variation in IL-6 levels for each group, a two-tailed Mann-Whitney ranks test using the Z-statistic was used to assess group differences in peripheral IL-6 at time of scan, which is reported as the median and interquartile range (IQR). This nonparametric test is less sensitive to the influence of very high or low values than a comparison of means. Two-tailed Pearson’s r correlations were used to evaluate if IL-6 levels were related to body weight, visceral adiposity, and health status, as well as to TBV, global GM and WM. IL-6 levels at 20 years of age and at time of scan were also compared. Alpha was set at .05 for these analyses.
For neural association analyses, covariates included age, gender, and dietary condition; TBV was additionally incorporated when testing for regional volume associations. GM or WM probability maps were entered into regional analyses of volume as the dependent variable (Ashburner and Friston, 2000). The independent variable for association analyses was IL-6 collected near the time of scan--although the average of IL-6 at both time points was used to confirm the stability of result maps. Of particular interest was if CR monkeys showed incrementally less atrophy per pg/ml unit increase in IL-6 relative to controls, suggesting a protective effect. Thus, an IL-6*CR interaction term was entered into separate general linear models to test for this relationship; IL-6 and dietary condition vectors, in addition to standard covariates, were included to remove their main effects. The t-statistic threshold at the voxel level was set at p < 0.005 (uncorrected). Analyses were corrected for multiple comparisons at the cluster level using Monte Carlo simulations, in the Analysis of Functional NeuroImages (AFNI) package AlphaSim, to derive a cluster corrected p-value less than .05 (Forman et al., 1995). This correction required GM volume clusters to contain at least 875 edge-connected voxels in order to be significant. For WM volume areas, as well as FA maps, the necessary cluster size after correction was 854 voxels. MD analyses examining both GM and WM required a cluster size of at least 1,106 voxels. Although violation of non-stationarity is a concern for cluster correction of structural imaging data, the use of a 4mm FWHM kernel does not appreciably bias the true alpha when using this permutational estimate of cluster size (Hayasaka et al., 2004).
To determine if alterations in myelin or axons predominantly drove FA results (Song et al., 2002), the IL-6 association FA map was used as an explicit mask for post hoc voxel-wise analyses of radial and axial diffusivity thresholded at a voxel alpha of .05 (uncorrected) over 50 contiguous voxels. Coordinates of significant clusters correspond to the space of the Saleem-Logothetis atlas and are displayed on the 112RM-SL underlays (Saleem et al., 2002). Major fiber tracts were designated based on autoradiography conducted in rhesus monkeys (Schmahmann and Pandya, 2006).
3. Results
3.1. Demographics, pathology, body composition, and peripheral interleukin-6
The subject composition of the two dietary conditions did not differ by age or sex. CR monkeys had lower basal IL-6 at the scan time point than did the age- and sex-matched controls [Z(45) = -2.201, p < .05]. There was a median difference of 1.12 pg/ml between the CR and control groups (Median =1.43 pg/ml, IQR=2.05, versus 2.55 pg/ml, IQR=2.43, respectively) (Figure 1). For the healthy monkeys without pathologies at the time of scan, IL-6 was correlated with early values obtained at 20 years of age [r(29) = 0.47, p < .05]. By contrast, monkeys with some type of inflammatory pathology near time of scan did not show this association, which also negated the stability of the IL-6 values over time for all subjects [r(45) = -0.01, N.S.]. The two diet conditions had statistically similar IL-6 values at 20 years of age (Z(45) = -.754, N.S.). Volumetric and microstructural result maps related to IL-6 were comparable whether cytokine data were used from 20 years of age and at time of scan independently or averaged together (data not shown).
Figure 1.
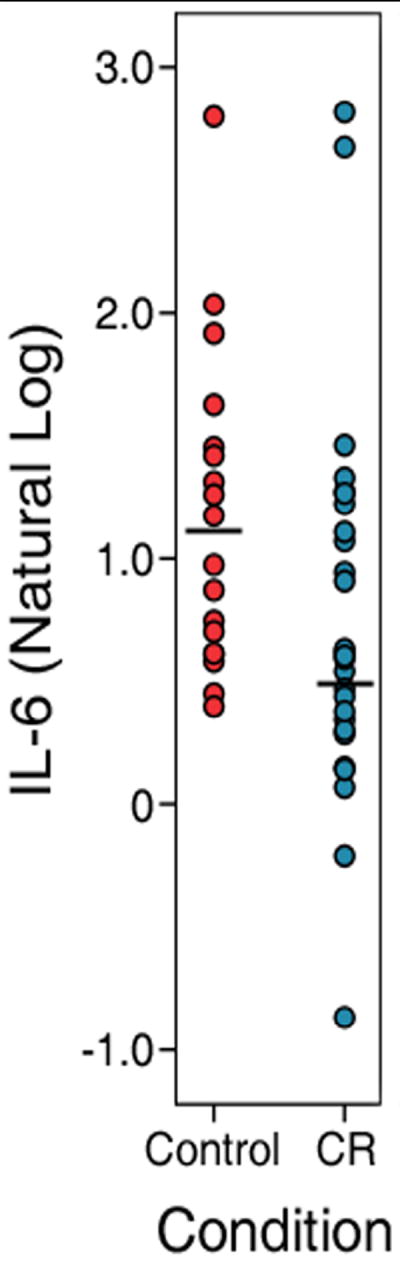
The main effect of a calorie restricted diet on systemic IL-6 levels collected near the time of scan. The black bar in each column indicates the median of each group. High or low IL-6 values did not affect the significance of the result. For display purposes, a scalar transform is used employing the natural log.
The presence of inflammation-related conditions was similar in both CR (n=8) and controls (n = 7) in this sub-sample from the larger project. A binary variable representing this marker of health was correlated with higher IL-6 concentrations near the time of scan [r(45) = 0.35, p < .05] but not at 20 years of age [r(45) = 0.13, N.S]. The two monkeys with the highest IL-6 levels at the time of the scan had been diagnosed with chronic endometriosis. This gynecological condition is common in older female monkeys; therefore, they were included in all neural analyses as representative of normative aging in this species. Central adiposity and total body mass were not correlated with IL-6 sampled near the time of scan.
3.3. Global and regional morphometry
3.3.1. Interleukin-6 and T1-weighted volumetric associations
The TBV of the control and CR monkeys did not differ significantly. Higher peripheral IL-6 near scanning was moderately correlated with lower TBV [r = -.41, p < .01]. This relationship appeared stronger for global GM [r = -.52, p <.001] as compared to WM [r = -.34, p < .05]. IL-6 was associated with reduced GM volume in parietal and temporal regions sensitive to age-related atrophy. Several clusters were found in association cortices along the intraparietal sulcus; medial parietal cortex; and superior temporal sulcus in lateral, medial, and superior temporal areas (Figure 2a-c; Table 1). GM regions typically not associated with age-related atrophy included primary visual cortex and extrastriate areas. There was no significant relationship between IL-6 levels and regional WM volume after correction for multiple comparisons.
Figure 2.

Association of IL-6 and IL-6*CR Status interaction in GM and WM volume in the axial plane in arbitrary units (AU). IL-6 was associated with decreased GM primarily in: (A) intraparietal sulcus; (B) temporo-occipital and extrastriate regions; and (C) superior temporal sulcus. For WM, the interaction indicated that CR monkeys showed less IL-6 related atrophy per pg/ml increase relative to controls along intraparietal sulcus (D), the frontal forceps (E), and subjacent to orbital prefrontal cortex (F). A peak voxel proximal to uncinate fasciculus depicts the CR*IL-6 interaction (G). A scalar employing the natural log of IL-6 is used for display purposes. The ‘warm’ and ‘cool’ color schemes for association and interaction analyses represent t-values. Brains are oriented in neurological space.
Table 1.
Regional Gray Matter and Interleukin-6.
| Location | Coordinates | Peak t-value | Cluster Size (voxels) | ||
|---|---|---|---|---|---|
| x | y | z | |||
| Ventral intraparietal area (IPS) | 14 | 4 | 26 | 4.83 | 4,905 |
| Somatsensory areas (IPS) | 6 | 8 | 34 | 3.15 | |
| Medial parietal cortex | 1 | -2 | 34 | 2.85 | |
| Extrastriate cortex (LS) | 15 | -12 | 32 | 4.06 | 4,847 |
| Medial temporal area (STS) | 19 | -4 | 24 | 3.85 | |
| Extrastriate cortex (IOS) | 28 | -4 | 14 | 3.75 | |
| Primary visual cortex | 13 | -22 | 16 | 4.01 | 3,087 |
| Lateral temporal lobe (STS) | 23 | 18 | 4 | 3.79 | 1,537 |
| Ventral intraparietal area (IPS) | -10 | 6 | 30 | 3.71 | 1,606 |
Local maxima of larger clusters are noted below its highest maxima. Voxel and cluster thresholds were p < .005 uncorrected and p < .05 corrected respectively. IOS = Inferior Occipital Sulcus; IPS = Intraparietal Sulcus; STS = Superior Temporal Sulcus; LS = Lunate Sulcus. Positive x-coordinates correspond to the right hemisphere.
3.3.2. Volumetrics: interleukin-6 by dietary condition interactions
An IL-6*CR Status model examined if CR monkeys had more volume than controls across subjects per pg/ml increase in IL-6, suggesting a protective effect against IL-6 related atrophy. For GM volume, no clusters were significant after Type 1 error correction. For WM volumes (Figure 2d-g), CR monkeys with higher IL-6 showed mitigated atrophy relative to controls within intraparietal areas along the inferior longitudinal fasciculus [-22, 2, 14; t(38) = 3.41; voxel cluster size = 1,636] and a local maxima in medial longitudinal fasciculus [-17, 4, 22; t(38)= 3.07]; cingulum, uncinate fasciculus, and other sub-cortical bundles along the frontal forceps [2, 38, 16; peak t-value = 3.36; voxel cluster size = 2,525], as well as a local maxima in uncinate fasciculus in deep WM [-8, 37, 14; peak t-value = 3.04]; and extreme capsule and striatal bundle proximal to orbital PFC [14, 32, 14; peak t-value = 3.34; voxel cluster size = 1,108].
3.4. Fractional Anisotropy
3.4.1. interleukin-6 and FA associations
Progressively higher IL-6 across all animals was related to lower FA values along the genu, body, and splenium of the corpus callosum, as well as posterior cingulum (Figure 3a; Table 2). Clusters were also found within thalamic bundles at the levels of the ventral-posterior and pulvinar nuclei, as well as WM proximal to the somatosensory areas consistent with the superior longitudinal fasciculus (Figure 3b-c). Other associations were noted in arcuate fasciculus along an intraparietal extent of lateral sulcus, as well as anterior commissure and uncinate fasciculus. A small anterior portion of this latter tract showed overlap with the WM volume result map generated by the IL-6*CR contrast. To determine whether WM volume influenced the FA result, a peak voxel (2, 44, 16) in this area of overlap was taken. A full correlation indicated a mild-moderate negative relationship between FA and IL-6 [r(32) = -.392, p = .013], which was not influenced when partially out WM voxel values [r(29) = -.388, p = .016].
Figure 3.

Association of IL-6 and IL-6*CR Status interaction in FA of WM along sagittal slices. IL-6 was negatively associated with FA in areas such as the corpus callosum (A), thalamic bundles (B), and superior longitudinal fasciculus (C). CR diet contributed to a protective effect against IL-6 related atrophy per pg/ml increase in superior longitudinal fasciculus in the dorsal convexity (D). A peak voxel in superior longitudinal fasciculus illustrates the IL-6*CR interaction (E). A scalar employing the natural log is used for display purposes. The ‘warm’ and ‘cool’ color schemes for association and interaction analyses represent t-values. Brains are oriented in neurological space.
Table 2.
Fractional Anisotropy of Myelinated White Matter and IL-6.
| Location | Coordinates | Peak t-value | Cluster Size (voxels) | ||
|---|---|---|---|---|---|
| x | y | z | |||
| IL-6 Association | |||||
| Splenium of CC | 8 | 0 | 22 | 6.22 | 6,939 |
| Splenium of CC | -8 | -2 | 22 | 5.31 | |
| Splenium of CC | 0 | 4 | 21 | 3.98 | |
| TP | 4 | 16 | 12 | 5.33 | 2,708 |
| TP | 11 | 3 | 14 | 5.20 | 2,372 |
| SLF III | 22 | 15 | 21 | 4.72 | 2,423 |
| Genu of CC | 7 | 26 | 24 | 4.31 | 3,995 |
| Genu of CC | 7 | 34 | 18 | 4.28 | |
| Body of CC | 8 | 18 | 25 | 3.39 | |
| AC; UF | 14 | 21 | 9 | 3.77 | 865 |
| UF | 2 | 44 | 14 | 3.46 | 1,210 |
| UF | -6 | 46 | 18 | 2.92 | |
| IL-6 * CR Status Effect | |||||
| SLF I | -5 | 29 | 32 | 4.23 | 854 |
| SLF I | -6 | 20 | 36 | 3.89 | |
Local maxima of larger clusters are noted below the highest maxima. Voxel and cluster thresholds were p < .005 uncorrected and p < .05 corrected respectively. AC = Anterior Commissure; CC = Corpus Callosum; SLF = Superior Longitudinal Fasciculus; UF = Uncinate Fasciculus; TP = Thalamic Peduncle. Positive x-coordinates correspond to the right hemisphere.
3.4.2. FA: interleukin-6 by dietary condition interactions
An IL-6*CR Status model was used to test where CR monkeys had higher FA relative to controls across subjects per pg/ml increase in IL-6, suggesting a protective effect. After correction, the CR monkeys showed a mitigated relationship with IL-6 associated atrophy in superior longitudinal fasciculus along the dorsal convexity anterior to the central sulcus (Figure 3d-e; Table 2). Removal of individual IL-6 values at the high or low end of the range did not undermine the associations or group differences beyond an expected loss of statistical power. Split level partial correlations indicated that the positive association of IL-6 and FA for CR monkeys was non-significant (data not shown).
3.4.3. FA: radial and axial diffusivity post hocs
To determine whether FA results were driven primarily by myelin or axonal changes, post hoc analyses of radial and axial diffusivity maps were conducted within the space of the FA results map. Increased peripheral IL-6 was related to greater radial diffusion along the corpus callosum, thalamic bundles, and other areas highly consistent in cluster size and significance with the FA map (Supplementary Figure 1). By contrast, higher axial diffusivity was restricted to part of the splenium and corticocortical fibers adjacent to the somatosensory areas.
3.5. Mean diffusivity
3.5.1. Interleukin-6 and MD associations
Comparable to FA, higher levels of IL-6 at scan were associated with increased MD of WM throughout an extensive cluster encompassing the corpus callosum and cingulum (Figure 4; Table 3). MD in GM tissue was also higher in several brain areas. The main cluster ranged from the global maxima adjoining right hemisphere insula and somatosensory areas out to local maxima caudally in the splenium and rostrally to ventral PFC. The caudal extent in part included occipito-splenial fibers; intraparietal and parietal cortex areas; temporal regions generally along the superior temporal sulcus; posterior cingulate cortex; and longitudinal fasciculi in parietal lobe. Association regions extended anteriorly to dorsal premotor cortex, supplementary motor area (SMA), pre-SMA, frontal eyefield, and then dorsal PFC. This rostral portion of the cluster consisted of anterior cingulate cortex; dorsal, infralimbic, orbitofrontal and ventral PFC, as well as gyrus rectus; precentral operculum; optic tract; agranular insula; and the basal forebrain. Medial and lateral extents incorporated striatum; dysgranular anterior insula and claustrum; uncinate, arcuate, and longitudinal fasciculi; superior temporal sulcus in medial temporal lobe; and medial temporal lobe structures including parahippocampus, hippocampus, and amygdala. Another separate cluster included occipito-splenial fibers and extrastriate cortex.
Figure 4.

Association of IL-6, IL-6 x CR Status interaction, and their overlap in MD of GM and WM tissue along 4 mm axial slices (A). IL-6 was related to MD throughout the corpus callosum, cingulum, various fasciculi, parietal, superior temporal, frontal, and prefrontal regions. A CR diet mitigated IL-6 related atrophy versus control per pg/ml increase across subjects primarily in premotor cortex, SMA, pre-SMA, frontal eyefield, and dorsal PFC, as well as hippocampus and uncinate fasciculus. A voxel in dorsal PFC illustrates the relative association of IL-6 by group (B). A scalar employing the natural log is used for display purposes. High or low values did not affect the regression beyond a loss of power. The ‘warm’ and ‘cool’ colors represent t-values. The pink color indicates overlap of the two analyses. Brains are oriented in neurological space.
Table 3.
Mean Diffusivity of Neural Parenchyma and Peripheral IL-6.
| Location | Coordinates | Peak t-value | Cluster Size (voxels) | ||
|---|---|---|---|---|---|
| x | Y | z | |||
| IL-6 Association | |||||
| Somatosensory areas; Dysgranular Insula | 22 | 23 | 18 | 8.26 | 107,605 |
| Splenium of CC; Posterior CB | -2 | 4 | 26 | 6.52 | |
| Ventral PFC; Claustrum | 19 | 30 | 13 | 6.51 | |
| Occipito-Splenial fibers | 12 | -16 | 16 | 3.79 | 1,198 |
| IL-6 * CR Status Effect | |||||
| SLF I and II; Dorsal Premotor Cortex | -6 | 28 | 32 | 8.98 | 13,292 |
| Primary Visual Cortex | 8 | -26 | 15 | 5.13 | 1,677 |
| Hippocampus; UF | -15 | 20 | 0 | 3.50 | 1,199 |
| UF | -24 | 12 | 0 | 3.15 | |
Local maxima of larger clusters are noted below the highest maxima. Voxel and cluster thresholds were p < .005 uncorrected and p < .05 corrected respectively. CB = Cingulum Bundle; CC = Corpus Callosum; PFC = Prefrontal Cortex; SLF = Superior Longitudinal Fasciculus; UF = Uncinate Fasciculus. Positive x-coordinates correspond to the right hemisphere.
3.5.2. MD: interleukin-6 by dietary condition interactions
An IL-6*CR Status model tested where CR monkeys had lower MD relative to controls for every pg/ml increase in IL-6 across all subjects. A striking cluster extended approximately 25 mm along the frontal convexity in WM and GM, spanning from dorsal premotor cortex to dorsal PFC and additionally incorporating superior longitudinal fasciculus, SMA, pre-SMA, frontal eye field, and anterior cingulate cortex (Figure 4; Table 3). This region bilaterally overlapped with part of the IL-6 main effect. Clusters were also found in primary and extrastriate visual cortices, as well as hippocampus and uncinate fasciculus near the superior temporal sulcus. Removal of individual IL-6 values at the high or low end of the range did not undermine the associations or group differences beyond an expected loss of statistical power. Further, a similar result map with comparable maxima and sub-maxima was produced when the average of IL-6 taken at 20 years of age and the time of scan was used as the independent variable [-6, 33, 34; t(29) = 4.52; voxel cluster size = 5,369]. This averaged IL-6 was normally distributed and had no especially high or low values.
4. Discussion
Higher peripheral levels of IL-6 in these aged monkeys were associated with smaller regional brain volume and less microstructural density primarily in parietal, frontal, callosal, and prefrontal areas. These age-sensitive regions have been implicated in voxel- or ROI based analyses in aged humans, rats, and monkeys (Hauss-Wegrzyniak et al., 2000; Baron et al., 2001; Rabinovici et al., 2007; Alexander et al., 2008; Falangola et al., 2008). Higher IL-6 was also correlated with moderately less global GM and WM. Similar relationships have been found when correlating age or IL-6 to TBV and global GM or WM among normally aging humans (Jernigan et al., 2001; Liu et al., 2003; Jefferson et al., 2007). Importantly, the monkeys on the CR diet had significantly lower IL-6 levels at the time of the scan and would manifest less neural atrophy specifically related to IL-6 versus controls. Due to the main effect of CR on GM that has been found previously (Colman et al., 2009), dietary condition was included as a covariate to isolate the association between IL-6 and the current neural indices. By examining CR*IL-6 interactions, it was further possible to show that the relationship between IL-6 and atrophy in several neural regions was attenuated among CR monkeys. There are several mechanisms through which CR may confer protection against IL-6 associated atrophy beyond the main effect of lowering IL-6 itself. In mouse epididymal adipose tissue, CR downregulates expression of 55 proinflammatory genes related to the complement system, acute phase response, interferons, and lysosomal proteases (Higami et al., 2006). Attenuated synthesis of any of these proteins may inhibit the ability of IL-6 to adversely affect cellular function and subsequently moderate neural atrophy. CR also raises anti-inflammatory factors in circulation such as Interleukin-10, which is related to decreased IL-6 synthesis (Jung et al., 2008) and may centrally protect parenchymal tissue sensitive to the influence of PIC.
The lack of IL-6 association with lower regional versus global WM volume was unexpected, but may be explained by DTI. Aging increases redundant myelin lamellae and oligodendrocytes in the brain (Peters et al., 1991; Wozniak & Lim, 2006), which could falsely indicate intact regional WM even as axonal or myelin loss occurs. Indeed, voxel-wise regression analyses of systemic IL-6 with reduced FA and increased MD were highly significant in regions and tracts that are the first to show myelin changes with age, such as the genu of the corpus callosum and PFC (Hayakawa et al., 1991; Pfefferbaum et al., 2005; Pagani et al., 2008). Indeed, increased radial diffusivity of the corpus callosum and other regions accurately corresponded with decreased FA, suggesting that increased systemic inflammation represented by peripheral IL-6 was primarily related to demyelination (Song et al., 2002). WM volume did not appear to influence these results when included as a covariate. Thus, IL-6 showed cross-modal correspondence of volumetric and microstructural association clusters in the parietal and temporal lobes, whereas prefrontal and callosal correlations were significant only for DTI indices.
Peripheral IL-6 concentrations among clinically healthy old monkeys were significantly related over time, which is comparable to results in human elders (Rao et al., 1994). The IL-6 levels were not related to central adiposity or body mass, but did appear to be associated with chronic inflammatory pathologies in a subset of the animals in both dietary conditions. Although it is now well accepted that adipose tissue produces IL-6 (Bulcão et al., 2006), and that IL-6 covaries with BMI in humans (Marsland et al., 2008), the current sample of monkeys did not include morbidly obese animals in either group. It has been established that the CR monkeys weigh much less than do controls and exhibit many metabolic benefits, including better glucoregulation (Colman et al., 2009). Yet, in concert with Marsland and coworkers (2008), it is thus unlikely in this primate model that central adiposity is the primary mediator of the relationship between IL-6 and neural atrophy.
By examining CR*IL-6 interactions, monkeys on CR diets had reduced IL-6 related volumetric atrophy and lower microstructural density in frontal and prefrontal areas. These same areas manifest a decreased multi-chemical MRI spectroscopy profile with human aging, including sensorimotor cortex and dorsal PFC (Grachev and Apkarian, 2001). The most striking CR*IL-6 moderation of reduced FA and increased MD incorporated GM and WM tissue along the dorsal convexity, including superior longitudinal fasciculus, dorsal premotor cortex, SMA, pre-SMA, frontal eyefield, and dorsal PFC. This cluster shared substantial overlap with a comparable region found in the IL-6 association analysis for MD. This correspondence suggests that individuals on a CR diet, with different physiological profiles, may show either moderated IL-6 related atrophy or stronger abatement of its correlational relationship with neural regions that are critical for daily function. Integrity of pre-SMA tissue, for example, is important for performing voluntary saccades (Boxer et al., 2006). The protective effect of CR, beyond the main effect reduction of IL-6 near scan, was also related to preserved WM and GM tissue density in hippocampus and uncinate fasciculus, which are critical structures that are relevant for normal and pathological aging (Uylings et al., 2002).
There are several limitations to the current cross-sectional study. It was not feasible to collect CSF or histological tissue from this longitudinally studied monkey cohort to establish causality between cytokine activity and induction of neural atrophy. Such samples will eventually be collected at time of death to permit a direct examination of the degree of neurodegeneration at mortality. Due to the correlational nature of the analyses, it was also not possible to determine whether systemic inflammation impacted the brain or, alternatively, the neural changes were occurring in parallel or perhaps even antecedent to the shift in inflammatory physiology. However, most studies have been based on the conceptual premise that peripheral PIC play a causative role in inducing subsequent upregulation in neural parenchyma (Dantzer, 2004). To be sure, Offner and colleagues (2009) found that ischemic lesions lead to marked immunosuppression of circulating PIC like interferon gamma and tumor necrosis factor-alpha (Offner et al., 2009). Finally, it must be emphasized that IL-6 is likely not the sole biomarker of inflammation related to atrophy in age-sensitive regions. The PIC tend to act as a unit by co-activating one another in the periphery and brain, consequently mediating neural and behavioral changes (Dantzer, 2004). However, only IL-6 is reliably detected in healthy individuals, and it is a stable biomarker of low-grade inflammation in individuals across time (Rao et al., 1994; Reyes and Coe, 1996; Willette et al., 2007).
In summary, systemic IL-6 appears to provide a valuable and sensitive index of health and aging in the nonhuman primate, which is correlated with the magnitude of brain aging globally and in a number of sensitive regions.
Supplementary Material
Post hoc association of IL-6 and radial and axial diffusivity in areas of significant FA associations. The FA map was used as an explicit mask for these voxel-wise analyses. The radial diffusion and FA maps closely corresponded in the location and size of clusters, whereas axial diffusivity is related to FA in part of the splenium and somatosensory corticocortical fibers. The ‘warm’ and green color schemes for FA and post hoc analyses represent t-values. Brains are oriented in neurological space.
Acknowledgments
The assistance of Michele E. Fitzgerald, Ron Fisher, Scott T. Baum, Josh Smith, Mary Lou Voytko, and the Waisman Center for Brain Imaging was greatly appreciated. GRECC manuscript number: 2010-XX. This study was supported in part by the National Institutes of Health RR000167, AG011915, AG000213, GM007507, MH085051, and MH062015. The study was also supported with resources and use of facilities at the William S. Middleton Memorial Veterans Hospital, Madison, WI, USA. AAW was supported by a pre-doctoral fellowship from the Ford Foundation, and professional funding from a Marian S. Schwartz fellowship and National Science Foundation-Alliances for Graduate Education and the Professoriate award.
Footnotes
Disclosure Statement
The authors have no conflicts of interest related to this work.
Publisher's Disclaimer: This is a PDF file of an unedited manuscript that has been accepted for publication. As a service to our customers we are providing this early version of the manuscript. The manuscript will undergo copyediting, typesetting, and review of the resulting proof before it is published in its final citable form. Please note that during the production process errors may be discovered which could affect the content, and all legal disclaimers that apply to the journal pertain.
References
- Alexander GE, Chen K, Aschenbrenner M, Merkley TL, Santerre-Lemmon LE, Shamy JL, Skaggs WE, Buonocore MH, Rapp PR, Barnes CA. Age-related regional network of magnetic resonance imaging gray matter in the rhesus macaque. J Neurosci. 2008;28:2710–2718. doi: 10.1523/JNEUROSCI.1852-07.2008. [DOI] [PMC free article] [PubMed] [Google Scholar]
- Arvidsson E, Viguerie N, Andersson I, Verdich C, Langin D, Arner P. Effects of different hypocaloric diets on protein secretion from adipose tissue of obese women. Diabetes. 2004;53:1966–1971. doi: 10.2337/diabetes.53.8.1966. [DOI] [PubMed] [Google Scholar]
- Ashburner J. A fast diffeomorphic image registration algorithm. Neuroimage. 2007;38:95–113. doi: 10.1016/j.neuroimage.2007.07.007. [DOI] [PubMed] [Google Scholar]
- Ashburner J, Friston KJ. Voxel-based morphometry--the methods. Neuroimage. 2000;11:805–821. doi: 10.1006/nimg.2000.0582. [DOI] [PubMed] [Google Scholar]
- Baranowska-Bik A, Bik W, Wolinska-Witort E, Martynska L, Chmielowska M, Barcikowska M, Baranowska B. Plasma beta amyloid and cytokine profile in women with Alzheimer’s disease. Neuro Endocrinol Lett. 2008;29:75–79. [PubMed] [Google Scholar]
- Baron JC, Chetelat G, Desgranges B, Perchey G, Landeau B, de la Sayette V, Eustache F. In vivo mapping of gray matter loss with voxel-based morphometry in mild Alzheimer’s disease. Neuroimage. 2001;14:298–309. doi: 10.1006/nimg.2001.0848. [DOI] [PubMed] [Google Scholar]
- Baune BT, Ponath G, Rothermundt M, Roesler A, Berger K. Association between cytokines and cerebral MRI changes in the aging brain. J Geriatr Psychiatry Neurol. 2009;22:23–34. doi: 10.1177/0891988708328216. [DOI] [PubMed] [Google Scholar]
- Boxer AL, Garbutt S, Rankin KP, Hellmuth J, Neuhaus J, Miller BL, Lisberger SG. Medial versus lateral frontal lobe contributions to voluntary saccade control as revealed by the study of patients with frontal lobe degeneration. J Neurosci. 2006;26:6354–6363. doi: 10.1523/JNEUROSCI.0549-06.2006. [DOI] [PMC free article] [PubMed] [Google Scholar]
- Brouqui P, Dumler JS, Raoult D. Immunohistologic demonstration of Coxiella burnetii in the valves of patients with Q fever endocarditis. Am J Med. 1994;97:451–458. doi: 10.1016/0002-9343(94)90325-5. [DOI] [PubMed] [Google Scholar]
- Bruen PD, McGeown WJ, Shanks MF, Venneri A. Neuroanatomical correlates of neuropsychiatric symptoms in Alzheimer’s disease. Brain. 2008;131:2455–2463. doi: 10.1093/brain/awn151. [DOI] [PubMed] [Google Scholar]
- Bruunsgaard H, Pedersen M, Pedersen BK. Aging and proinflammatory cytokines. Curr Opin Hematol. 2001;8:131–136. doi: 10.1097/00062752-200105000-00001. [DOI] [PubMed] [Google Scholar]
- Bulcao C, Ferreira SR, Giuffrida FM, Ribeiro-Filho FF. The new adipose tissue and adipocytokines. Curr Diabetes Rev. 2006;2:19–28. doi: 10.2174/157339906775473617. [DOI] [PubMed] [Google Scholar]
- Chen H, O’Reilly EJ, Schwarzschild MA, Ascherio A. Peripheral inflammatory biomarkers and risk of Parkinson’s disease. Am J Epidemiol. 2008;167:90–95. doi: 10.1093/aje/kwm260. [DOI] [PubMed] [Google Scholar]
- Chu CC, Tranel D, Damasio AR, Van Hoesen GW. The autonomic-related cortex: pathology in Alzheimer’s disease. Cereb Cortex. 1997;7:86–95. doi: 10.1093/cercor/7.1.86. [DOI] [PubMed] [Google Scholar]
- Colman RJ, Anderson RM, Johnson SC, Kastman EK, Kosmatka KJ, Beasley TM, Allison DB, Cruzen C, Simmons HA, Kemnitz JW, Weindruch R. Caloric restriction delays disease onset and mortality in rhesus monkeys. Science. 2009;325:201–204. doi: 10.1126/science.1173635. [DOI] [PMC free article] [PubMed] [Google Scholar]
- Craig AD. How do you feel now? The anterior insula and human awareness. Nat Rev Neurosci. 2009;10:59–70. doi: 10.1038/nrn2555. [DOI] [PubMed] [Google Scholar]
- Crick FC, Koch C. What is the function of the claustrum? Philos Trans R Soc Lond B Biol Sci. 2005;360:1271–1279. doi: 10.1098/rstb.2005.1661. [DOI] [PMC free article] [PubMed] [Google Scholar]
- Cunningham C, Campion S, Teeling J, Felton L, Perry VH. The sickness behaviour and CNS inflammatory mediator profile induced by systemic challenge of mice with synthetic double-stranded RNA (poly I:C) Brain Behav Immun. 2007;21:490–502. doi: 10.1016/j.bbi.2006.12.007. [DOI] [PubMed] [Google Scholar]
- Dantzer R. Cytokine-induced sickness behaviour: a neuroimmune response to activation of innate immunity. Eur J Pharmacol. 2004;500:399–411. doi: 10.1016/j.ejphar.2004.07.040. [DOI] [PubMed] [Google Scholar]
- De Keyser F, Elewaut D, De Vos M, De Vlam K, Cuvelier C, Mielants H, Veys EM. Bowel inflammation and the spondyloarthropathies. Rheum Dis Clin North Am. 1998;24:785–813. ix–x. doi: 10.1016/s0889-857x(05)70042-9. [DOI] [PubMed] [Google Scholar]
- Devaux B, Scholz D, Hirche A, Klovekorn WP, Schaper J. Upregulation of cell adhesion molecules and the presence of low grade inflammation in human chronic heart failure. Eur Heart J. 1997;18:470–479. doi: 10.1093/oxfordjournals.eurheartj.a015268. [DOI] [PubMed] [Google Scholar]
- Edelstein LR, Denaro FJ. The claustrum: a historical review of its anatomy, physiology, cytochemistry and functional significance. Cell Mol Biol (Noisy-le-grand) 2004;50:675–702. [PubMed] [Google Scholar]
- Ershler WB. Interleukin-6: a cytokine for gerontologists. J Am Geriatr Soc. 1993;41:176–181. doi: 10.1111/j.1532-5415.1993.tb02054.x. [DOI] [PubMed] [Google Scholar]
- Ershler WB, Keller ET. Age-associated increased interleukin-6 gene expression, late-life diseases, and frailty. Annu Rev Med. 2000;51:245–270. doi: 10.1146/annurev.med.51.1.245. [DOI] [PubMed] [Google Scholar]
- Falangola MF, Jensen JH, Babb JS, Hu C, Castellanos FX, Di Martino A, Ferris SH, Helpern JA. Age-related non-Gaussian diffusion patterns in the prefrontal brain. J Magn Reson Imaging. 2008;28:1345–1350. doi: 10.1002/jmri.21604. [DOI] [PMC free article] [PubMed] [Google Scholar]
- Ferrucci L, Harris TB, Guralnik JM, Tracy RP, Corti MC, Cohen HJ, Penninx B, Pahor M, Wallace R, Havlik RJ. Serum IL-6 level and the development of disability in older persons. J Am Geriatr Soc. 1999;47:639–646. doi: 10.1111/j.1532-5415.1999.tb01583.x. [DOI] [PubMed] [Google Scholar]
- Gaykema RP, Chen CC, Goehler LE. Organization of immune-responsive medullary projections to the bed nucleus of the stria terminalis, central amygdala, and paraventricular nucleus of the hypothalamus: evidence for parallel viscerosensory pathways in the rat brain. Brain Res. 2007;1130:130–145. doi: 10.1016/j.brainres.2006.10.084. [DOI] [PubMed] [Google Scholar]
- Godbout JP, Chen J, Abraham J, Richwine AF, Berg BM, Kelley KW, Johnson RW. Exaggerated neuroinflammation and sickness behavior in aged mice following activation of the peripheral innate immune system. Faseb J. 2005;19:1329–1331. doi: 10.1096/fj.05-3776fje. [DOI] [PubMed] [Google Scholar]
- Good CD, Johnsrude IS, Ashburner J, Henson RN, Friston KJ, Frackowiak RS. A voxel-based morphometric study of ageing in 465 normal adult human brains. Neuroimage. 2001;14:21–36. doi: 10.1006/nimg.2001.0786. [DOI] [PubMed] [Google Scholar]
- Grachev ID, Apkarian AV. Aging alters regional multichemical profile of the human brain: an in vivo 1H-MRS study of young versus middle-aged subjects. J Neurochem. 2001;76:582–593. doi: 10.1046/j.1471-4159.2001.00026.x. [DOI] [PubMed] [Google Scholar]
- Halagappa VK, Guo Z, Pearson M, Matsuoka Y, Cutler RG, Laferla FM, Mattson MP. Intermittent fasting and caloric restriction ameliorate age-related behavioral deficits in the triple-transgenic mouse model of Alzheimer’s disease. Neurobiol Dis. 2007;26:212–220. doi: 10.1016/j.nbd.2006.12.019. [DOI] [PubMed] [Google Scholar]
- Hasan KM, Parker DL, Alexander AL. Comparison of gradient encoding schemes for diffusion-tensor MRI. J Magn Reson Imaging. 2001;13:769–780. doi: 10.1002/jmri.1107. [DOI] [PubMed] [Google Scholar]
- Hauss-Wegrzyniak B, Galons JP, Wenk GL. Quantitative volumetric analyses of brain magnetic resonance imaging from rat with chronic neuroinflammation. Exp Neurol. 2000;165:347–354. doi: 10.1006/exnr.2000.7469. [DOI] [PubMed] [Google Scholar]
- Hayakawa K, Konishi Y, Kuriyama M, Konishi K, Matsuda T. Normal brain maturation in MRI. Eur J Radiol. 1991;12:208–215. doi: 10.1016/0720-048x(91)90074-6. [DOI] [PubMed] [Google Scholar]
- Hayasaka S, Phan KL, Liberzon I, Worsley KJ, Nichols TE. Nonstationary cluster-size inference with random field and permutation methods. Neuroimage. 2004;22(2):676–87. doi: 10.1016/j.neuroimage.2004.01.041. [DOI] [PubMed] [Google Scholar]
- Higami Y, Barger JL, Page GP, Allison DB, Smith SR, Prolla TA, Weindruch R. Energy restriction lowers the expression of genes linked to inflammation, the cytoskeleton, the extracellular matrix, and angiogenesis in mouse adipose tissue. J Nutr. 2006;136:343–352. doi: 10.1093/jn/136.2.343. [DOI] [PubMed] [Google Scholar]
- Jefferson AL, Massaro JM, Wolf PA, Seshadri S, Au R, Vasan RS, Larson MG, Meigs JB, Keaney JF, Jr, Lipinska I, Kathiresan S, Benjamin EJ, DeCarli C. Inflammatory biomarkers are associated with total brain volume: the Framingham Heart Study. Neurology. 2007;68:1032–1038. doi: 10.1212/01.wnl.0000257815.20548.df. [DOI] [PMC free article] [PubMed] [Google Scholar]
- Jernigan TL, Archibald SL, Fennema-Notestine C, Gamst AC, Stout JC, Bonner J, Hesselink JR. Effects of age on tissues and regions of the cerebrum and cerebellum. Neurobiol Aging. 2001;22:581–594. doi: 10.1016/s0197-4580(01)00217-2. [DOI] [PubMed] [Google Scholar]
- Jung SH, Park HS, Kim KS, Choi WH, Ahn CW, Kim BT, Kim SM, Lee SY, Ahn SM, Kim YK, Kim HJ, Kim DJ, Lee KW. Effect of weight loss on some serum cytokines in human obesity: increase in IL-10 after weight loss. J Nutr Biochem. 2008;19:371–375. doi: 10.1016/j.jnutbio.2007.05.007. [DOI] [PubMed] [Google Scholar]
- Kagiwada K, Chida D, Sakatani T, Asano M, Nambu A, Kakuta S, Iwakura Y. Interleukin (IL)-6, but not IL-1, induction in the brain downstream of cyclooxygenase-2 is essential for the induction of febrile response against peripheral IL-1alpha. Endocrinology. 2004;145:5044–5048. doi: 10.1210/en.2004-0054. [DOI] [PubMed] [Google Scholar]
- Kemnitz JW, Weindruch R, Roecker EB, Crawford K, Kaufman PL, Ershler WB. Dietary restriction of adult male rhesus monkeys: design, methodology, and preliminary findings from the first year of study. J Gerontol. 1993;48:B17–26. doi: 10.1093/geronj/48.1.b17. [DOI] [PubMed] [Google Scholar]
- Kim MJ, Aiken JM, Havighurst T, Hollander J, Ripple MO, Weindruch R. Adult-onset energy restriction of rhesus monkeys attenuates oxidative stress-induced cytokine expression by peripheral blood mononuclear cells. J Nutr. 1997;127:2293–2301. doi: 10.1093/jn/127.12.2293. [DOI] [PubMed] [Google Scholar]
- Kochunov P, Thompson PM, Lancaster JL, Bartzokis G, Smith S, Coyle T, Royall DR, Laird A, Fox PT. Relationship between white matter fractional anisotropy and other indices of cerebral health in normal aging: tract-based spatial statistics study of aging. Neuroimage. 2007;35:478–487. doi: 10.1016/j.neuroimage.2006.12.021. [DOI] [PubMed] [Google Scholar]
- Kumagai N, Chiba Y, Hosono M, Fujii M, Kawamura N, Keino H, Yoshikawa K, Ishii S, Saitoh Y, Satoh M, Shimada A, Hosokawa M. Involvement of pro-inflammatory cytokines and microglia in an age-associated neurodegeneration model, the SAMP10 mouse. Brain Res. 2007;1185:75–85. doi: 10.1016/j.brainres.2007.09.021. [DOI] [PubMed] [Google Scholar]
- Lee CK, Weindruch R, Prolla TA. Gene-expression profile of the ageing brain in mice. Nat Genet. 2000;25:294–297. doi: 10.1038/77046. [DOI] [PubMed] [Google Scholar]
- Liu RS, Lemieux L, Bell GS, Sisodiya SM, Shorvon SD, Sander JW, Duncan JS. A longitudinal study of brain morphometrics using quantitative magnetic resonance imaging and difference image analysis. Neuroimage. 2003;20:22–33. doi: 10.1016/s1053-8119(03)00219-2. [DOI] [PubMed] [Google Scholar]
- Marsland AL, Gianaros PJ, Abramowitch SM, Manuck SB, Hariri AR. Interleukin-6 covaries inversely with hippocampal grey matter volume in middle-aged adults. Biol Psychiatry. 2008;64:484–490. doi: 10.1016/j.biopsych.2008.04.016. [DOI] [PMC free article] [PubMed] [Google Scholar]
- McLaren DG, Kosmatka KJ, Oakes TR, Kroenke CD, Kohama SG, Matochik JA, Ingram DK, Johnson SC. A population-average MRI-based atlas collection of the rhesus macaque. Neuroimage. 2009;45:52–59. doi: 10.1016/j.neuroimage.2008.10.058. [DOI] [PMC free article] [PubMed] [Google Scholar]
- McLaren DG, Kosmatka KJ, Kastman EK, Bendlin BB, Johnson SC. Rhesus macaque brain morphometry: A methodological comparison of voxel-wise approaches. Methods. 2010 doi: 10.1016/j.ymeth.2009.10.003. epub ahead of print. [DOI] [PMC free article] [PubMed] [Google Scholar]
- Offner H, Vandenbark AA, Hurn PD. Effect of experimental stroke on peripheral immunity: CNS ischemia induces profound immunosuppression. Neuroscience. 2009;158:1098–1111. doi: 10.1016/j.neuroscience.2008.05.033. [DOI] [PMC free article] [PubMed] [Google Scholar]
- Pagani E, Agosta F, Rocca MA, Caputo D, Filippi M. Voxel-based analysis derived from fractional anisotropy images of white matter volume changes with aging. Neuroimage. 2008;41:657–667. doi: 10.1016/j.neuroimage.2008.03.021. [DOI] [PubMed] [Google Scholar]
- Pang Y, Cai Z, Rhodes PG. Disturbance of oligodendrocyte development, hypomyelination and white matter injury in the neonatal rat brain after intracerebral injection of lipopolysaccharide. Brain Res Dev Brain Res. 2003;140:205–214. doi: 10.1016/s0165-3806(02)00606-5. [DOI] [PubMed] [Google Scholar]
- Perry VH, Cunningham C, Holmes C. Systemic infections and inflammation affect chronic neurodegeneration. Nat Rev Immunol. 2007;7:161–167. doi: 10.1038/nri2015. [DOI] [PubMed] [Google Scholar]
- Peters A, Josephson K, Vincent SL. Effects of aging on the neuroglial cells and pericytes within area 17 of the rhesus monkey cerebral cortex. Anat Rec. 1991;229:384–398. doi: 10.1002/ar.1092290311. [DOI] [PubMed] [Google Scholar]
- Pfefferbaum A, Adalsteinsson E, Sullivan EV. Frontal circuitry degradation marks healthy adult aging: Evidence from diffusion tensor imaging. Neuroimage. 2005;26:891–899. doi: 10.1016/j.neuroimage.2005.02.034. [DOI] [PubMed] [Google Scholar]
- Qin L, He J, Hanes RN, Pluzarev O, Hong JS, Crews FT. Increased systemic and brain cytokine production and neuroinflammation by endotoxin following ethanol treatment. J Neuroinflammation. 2008;5:10. doi: 10.1186/1742-2094-5-10. [DOI] [PMC free article] [PubMed] [Google Scholar]
- Qin W, Chachich M, Lane M, Roth G, Bryant M, de Cabo R, Ottinger MA, Mattison J, Ingram D, Gandy S, Pasinetti GM. Calorie restriction attenuates Alzheimer’s disease type brain amyloidosis in Squirrel monkeys (Saimiri sciureus) J Alzheimers Dis. 2006;10:417–422. doi: 10.3233/jad-2006-10411. [DOI] [PubMed] [Google Scholar]
- Radley JJ, Rocher AB, Miller M, Janssen WG, Liston C, Hof PR, McEwen BS, Morrison JH. Repeated stress induces dendritic spine loss in the rat medial prefrontal cortex. Cereb Cortex. 2006;16:313–320. doi: 10.1093/cercor/bhi104. [DOI] [PubMed] [Google Scholar]
- Ramsey JJ, Colman RJ, Binkley NC, Christensen JD, Gresl TA, Kemnitz JW, Weindruch R. Dietary restriction and aging in rhesus monkeys: the University of Wisconsin study. Exp Gerontol. 2000;35:1131–1149. doi: 10.1016/s0531-5565(00)00166-2. [DOI] [PubMed] [Google Scholar]
- Rao KM, Pieper CS, Currie MS, Cohen HJ. Variability of plasma IL-6 and crosslinked fibrin dimers over time in community dwelling elderly subjects. Am J Clin Pathol. 1994;102:802–805. doi: 10.1093/ajcp/102.6.802. [DOI] [PubMed] [Google Scholar]
- Raz N, Lindenberger U, Rodrigue KM, Kennedy KM, Head D, Williamson A, Dahle C, Gerstorf D, Acker JD. Regional brain changes in aging healthy adults: general trends, individual differences and modifiers. Cereb Cortex. 2005;15:1676–1689. doi: 10.1093/cercor/bhi044. [DOI] [PubMed] [Google Scholar]
- Reyes TM, Coe CL. Interleukin-1 beta differentially affects interleukin-6 and soluble interleukin-6 receptor in the blood and central nervous system of the monkey. J Neuroimmunol. 1996;66:135–141. doi: 10.1016/0165-5728(96)00038-0. [DOI] [PubMed] [Google Scholar]
- Rombouts SA, Barkhof F, Witter MP, Scheltens P. Unbiased whole-brain analysis of gray matter loss in Alzheimer’s disease. Neurosci Lett. 2000;285:231–233. doi: 10.1016/s0304-3940(00)01067-3. [DOI] [PubMed] [Google Scholar]
- Roth GS, Mattison JA, Ottinger MA, Chachich ME, Lane MA, Ingram DK. Aging in rhesus monkeys: relevance to human health interventions. Science. 2004;305:1423–1426. doi: 10.1126/science.1102541. [DOI] [PubMed] [Google Scholar]
- Salat DH, Tuch DS, Greve DN, van der Kouwe AJ, Hevelone ND, Zaleta AK, Rosen BR, Fischl B, Corkin S, Rosas HD, Dale AM. Age-related alterations in white matter microstructure measured by diffusion tensor imaging. Neurobiol Aging. 2005;26:1215–1227. doi: 10.1016/j.neurobiolaging.2004.09.017. [DOI] [PubMed] [Google Scholar]
- Saleem KS, Pauls JM, Augath M, Trinath T, Prause BA, Hashikawa T, Logothetis NK. Magnetic resonance imaging of neuronal connections in the macaque monkey. Neuron. 2002;34:685–700. doi: 10.1016/s0896-6273(02)00718-3. [DOI] [PubMed] [Google Scholar]
- Schmahmann J, Pandya D. Fiber pathways of the brain. Oxford UP; New York: 2006. [Google Scholar]
- Semmler A, Hermann S, Mormann F, Weberpals M, Paxian SA, Okulla T, Schafers M, Kummer MP, Klockgether T, Heneka MT. Sepsis causes neuroinflammation and concomitant decrease of cerebral metabolism. J Neuroinflammation. 2008;5:38. doi: 10.1186/1742-2094-5-38. [DOI] [PMC free article] [PubMed] [Google Scholar]
- Song SK, Sun SW, Ramsbottom MJ, Chang C, Russell J, Cross AH. Dysmyelination revealed through MRI as increased radial (but unchanged axial) diffusion of water. Neuroimage. 2002;17:1429–1436. doi: 10.1006/nimg.2002.1267. [DOI] [PubMed] [Google Scholar]
- Sowell ER, Peterson BS, Thompson PM, Welcome SE, Henkenius AL, Toga AW. Mapping cortical change across the human life span. Nat Neurosci. 2003;6:309–315. doi: 10.1038/nn1008. [DOI] [PubMed] [Google Scholar]
- Spaulding CC, Walford RL, Effros RB. Calorie restriction inhibits the age-related dysregulation of the cytokines TNF-alpha and IL-6 in C3B10RF1 mice. Mech Ageing Dev. 1997;93:87–94. doi: 10.1016/s0047-6374(96)01824-6. [DOI] [PubMed] [Google Scholar]
- Sullivan EV, Adalsteinsson E, Pfefferbaum A. Selective age-related degradation of anterior callosal fiber bundles quantified in vivo with fiber tracking. Cereb Cortex. 2006;16:1030–1039. doi: 10.1093/cercor/bhj045. [DOI] [PubMed] [Google Scholar]
- Teeling JL, Perry VH. Systemic infection and inflammation in acute CNS injury and chronic neurodegeneration: Underlying mechanisms. Neuroscience. 2009;158:1062–1073. doi: 10.1016/j.neuroscience.2008.07.031. [DOI] [PubMed] [Google Scholar]
- Uylings HB, de Brabander JM. Neuronal changes in normal human aging and Alzheimer’s disease. Brain Cogn. 2002;49:268–276. doi: 10.1006/brcg.2001.1500. [DOI] [PubMed] [Google Scholar]
- Willette AA, Lubach GR, Coe CL. Environmental context differentially affects behavioral, leukocyte, cortisol, and interleukin-6 responses to low doses of endotoxin in the rhesus monkey. Brain Behav Immun. 2007;21:807–815. doi: 10.1016/j.bbi.2007.01.007. [DOI] [PMC free article] [PubMed] [Google Scholar]
- Wozniak JR, Lim KO. Advances in white matter imaging: a review of in vivo magnetic resonance methodologies and their applicability to the study of development and aging. Neurosci Biobehav Rev. 2006;30:762–774. doi: 10.1016/j.neubiorev.2006.06.003. [DOI] [PMC free article] [PubMed] [Google Scholar]
- Wu P, Shen Q, Dong S, Xu Z, Tsien JZ, Hu Y. Calorie restriction ameliorates neurodegenerative phenotypes in forebrain-specific presenilin-1 and presenilin-2 double knockout mice. Neurobiol Aging. 2008;29:1502–1511. doi: 10.1016/j.neurobiolaging.2007.03.028. [DOI] [PubMed] [Google Scholar]
- You T, Sonntag WE, Leng X, Carter CS. Lifelong caloric restriction and interleukin-6 secretion from adipose tissue: effects on physical performance decline in aged rats. J Gerontol A Biol Sci Med Sci. 2007;62:1082–1087. doi: 10.1093/gerona/62.10.1082. [DOI] [PubMed] [Google Scholar]
Associated Data
This section collects any data citations, data availability statements, or supplementary materials included in this article.
Supplementary Materials
Post hoc association of IL-6 and radial and axial diffusivity in areas of significant FA associations. The FA map was used as an explicit mask for these voxel-wise analyses. The radial diffusion and FA maps closely corresponded in the location and size of clusters, whereas axial diffusivity is related to FA in part of the splenium and somatosensory corticocortical fibers. The ‘warm’ and green color schemes for FA and post hoc analyses represent t-values. Brains are oriented in neurological space.