
Figure 1.
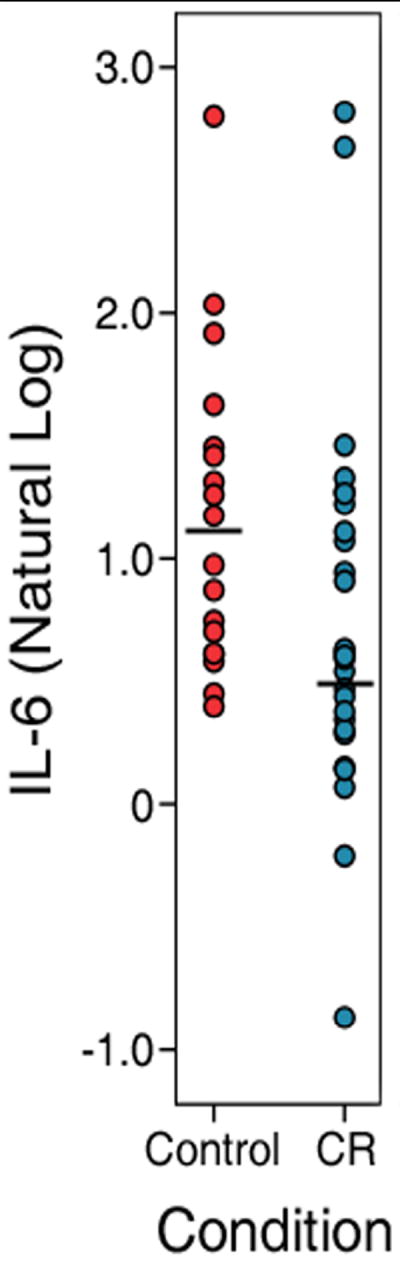
The main effect of a calorie restricted diet on systemic IL-6 levels collected near the time of scan. The black bar in each column indicates the median of each group. High or low IL-6 values did not affect the significance of the result. For display purposes, a scalar transform is used employing the natural log.