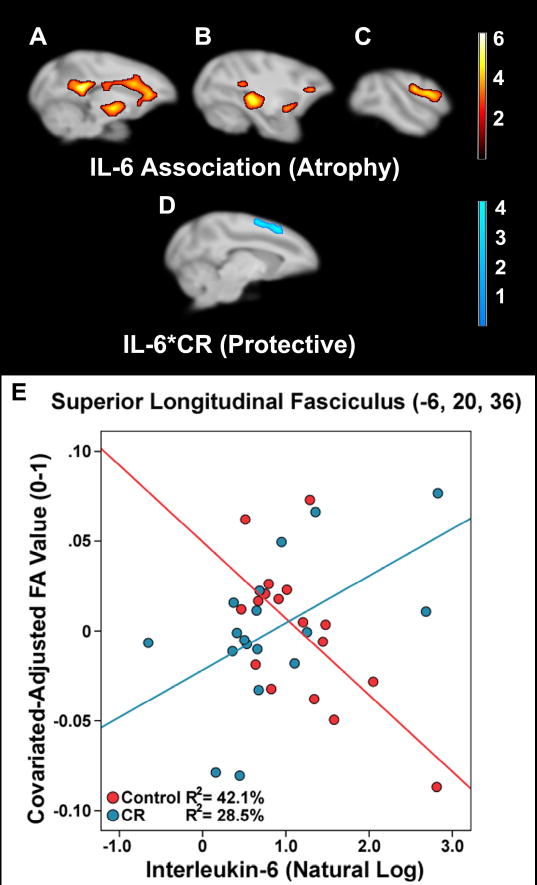
Figure 3.
Association of IL-6 and IL-6*CR Status interaction in FA of WM along sagittal slices. IL-6 was negatively associated with FA in areas such as the corpus callosum (A), thalamic bundles (B), and superior longitudinal fasciculus (C). CR diet contributed to a protective effect against IL-6 related atrophy per pg/ml increase in superior longitudinal fasciculus in the dorsal convexity (D). A peak voxel in superior longitudinal fasciculus illustrates the IL-6*CR interaction (E). A scalar employing the natural log is used for display purposes. The ‘warm’ and ‘cool’ color schemes for association and interaction analyses represent t-values. Brains are oriented in neurological space.

