

Abstract
A large and growing literature has demonstrated a deficit in auditory gating in patients with schizophrenia. Although that deficit has been interpreted as a general gating problem, no deficit has been shown in other sensory modalities. Recent research in our laboratory has examined sensory gating effects in the somatosensory system showing no difference in gating of the primary somatosensory response between patients with schizophrenia and control subjects. This is consistent with recent structural studies showing no cortical structural abnormality in primary somatosensory area in schizophrenia. However, a significant decrease in cortical thickness and gray matter volume loss in secondary somatosensory cortex has recently been reported, suggesting this as a focus for impaired somatosensory gating. Thus, the current study was designed (1) to replicate previous work showing a lack of schizophrenia deficit in primary somatosensory cortex (SI) gating, and (2) to investigate a possible deficit in secondary somatosensory cortex (SII) gating. In a paired-pulse paradigm, dipolar sources were assessed in SI and SII contralateral to unilateral median nerve stimulation. Patients demonstrated no impairment in SI gating, but a robust gating deficit in SII, supporting the presence of cross modal gating deficits in schizophrenia.
Keywords: Schizophrenia, Sensory Gating, Secondary Somatosensory, Cortex, Magnetoencephalography, Electroencephalography
1. Introduction
Sensory gating is traditionally measured in the auditory system using electroencephalography (EEG) and is assessed at a central recording site, electrode Cz. When two binaural click stimuli, separated by less than 1000 ms, are presented to normal control subjects, the positive-going component 50 ms after stimulus presentation (P50) of the event-related brain potential (ERP) in response to the second click is substantially reduced compared to that of the first (Adler et al., 1982). This effect is thought to reflect the filtering out of redundant and/or distracting sensory information in order to protect processing of the first stimulus. In a standard P50 gating protocol, a gating ratio is calculated by dividing the amplitude of the ERP at Cz to the second click (Stimulus 2) by the amplitude of the response to the first (Stimulus 1). This computation typically results in a mean gating ratio that is approximately .33 for control subjects (although there is some variability across studies for example, published ratios vary from .15 to .45 in control subjects; see Hetrick et al., 1996). In contrast, gating ratios in patients with schizophrenia typically range from .7 to .9 (Adler et al., 1982; 1998; Arnfred et al., 2001a), suggesting a failure of sensory inhibition that has been consistently associated with the disorder clinically (Adler et al., 1982; Freedman et al., 1983, Freedman et al., 1987; Nagamoto et al., 1989; Boutros et al., 1991; Judd et al., 1992; Clementz et al., 1997a; Thoma et al., 2003). The P50 gating deficit has been described as the most robust physiological finding in schizophrenia research (Bramon et al., 2004; Heinrichs, 2004). While gating of various kinds has been demonstrated using many protocols in different sensory modalities, there has been relatively little research investigating using a paired-stimulus paradigm to investigate a possible somatosensory parallel to P50 auditory gating.
Research using magnetoencephalography (MEG) has attempted to tie the auditory sensory gating deficit to abnormal processing in areas of cortex. Clementz, Blumenfeld, and colleagues (1997b, Clementz and Blumenfeld, 2001) measured the regional field activity of left and right temporal MEG channels and averaged them to estimate bilateral gating of the 50 (M50) and 100 (M100) ms responses during a paired-click paradigm. Source strength for Stimulus 1 and Stimulus 2 were determined for each component, M50 and M100, finding the characteristic reduction in Stimulus 2 compared to Stimulus 1 in control populations and a gating “deficit” in patients with schizophrenia for M100 but not for M50. More recently, in collaboration with Adler (Huang et al., 2003; Edgar et al., 2003; Thoma et al., 2003; Hanlon et al., 2005), an auditory paired-click protocol was employed in conjunction with MEG recording in an attempt to further clarify the neural mechanisms associated with the auditory gating deficit in patients with schizophrenia. Equivalent current dipoles (ECDs) were modeled for M50 and M100 separately for each hemisphere, and each localized to superior temporal gyrus (STG). Gating ratios based on the source strength of each component ECD, showed a sensory gating deficit in a group of patients with schizophrenia that was confined to the left hemisphere for M50 and bilateral for M100 (Thoma et al., 2003; Hanlon et al., 2005). These data concerning M50 were interpreted to suggest that circuitry involved in the EEG P50 auditory gating deficit is located in the left hemisphere, consistent with reports of reduced left STG volume in schizophrenia (McCarley et al., 1993, 2002; Pearlson et al., 1997; Kasai et al., 2003).
Three recent studies have examined somatosensory gating, using EEG (Arnfred et al., 2001a, b) or MEG (Edgar et al., 2005), and each reported a significant gating effect using a paired-pulse paradigm similar to that used for auditory gating experiments. Arnfred et al. (2001a, b) demonstrated a significant gating effect in healthy subjects. Edgar et al. (2005), using MEG-computed dipoles modeling the 20 ms response (M20) that localized to primary somatosensory cortex, also showed a gating effect, but gating ratios did not differ between control subjects and patients with schizophrenia. It is possible that gating and/or gating deficits are better assessed via other, later components of the somatosensory response. For example, Arnfred and colleages (2004) documented abnormality in the amplitude of the 50 ms component of the somatosensory evoked potential in schizophrenia-spectrum patients, but no impairment of gating of this component.
Thoma et al. (2004) demonstrated that the extent of thinning in auditory cortex (STG auditory dipole location) was correlated with the extent of impairment in auditory gating ratio, suggesting that cortical structural abnormality was related in a consistent manner with regional cortical function. Cannon et al. (2002) measured cortical thickness of different brain areas in individuals with schizophrenia relative to their monozygotic co-twins. Tissue was relatively spared in occipital and almost all of parietal cortex, including area 3, the site of localization of primary somatosensory cortex activity. This finding is consistent with the lack of gating impairment in M20 localizing to primary somatosensory cortex (Edgar et al., 2005). Cannon et al. (2002) reported that, although superior and posterior parietal cortex appeared to be largely spared, the superior lip of the sylvian fissure, an area comprising inferior frontal and parietal cortical tissue and including secondary somatosensory cortex (Barba et al., 2002), was reduced to roughly the same extent as was STG. These anatomical findings would be consistent with (1) intact primary somatosensory gating but (2) impaired secondary somatosensory gating in schizophrenia.
To test this hypothesis, the present study investigated sensory gating of an MEG component localizable to secondary somatosensory cortex. In order to better understand how neurophysiological variables like gating may relate to sensation, a two-point discrimination task was selected as a behavioral measure designed to be complimentary to MEG measurement of somatosensory cortex function. In both neurophysiological (Wikstrom et al., 2001) and blood flow (Hansson and Brismar, 2003) studies, this task has been shown to relate to the abnormality of neural tissue following injury. Furthermore, investigations of both schizotypy (Lenzenweger, 2000; Chang and Lenzenweger, 2001) and schizophrenia (Malamud and Nygard, 1931; Broekema and Rosenbaum, 1975; Chang and Lenzenweger, 2001) have shown abnormality of two-point discrimination to be related to clinical symptoms.
2. Methods
2.1. Subjects
Twelve patients with chronic schizophrenia (mean age = 40.6 years, SD = 9.5; 10 males, 2 females) were recruited from the Albuquerque VA Medical Center and the University of New Mexico Health Sciences Center. Selection criteria for patients were: 1) diagnosis of schizophrenia as determined by the Structured Clinical Interview for DSM-IV-Clinician Version (SCID-IV-CV, First et al., 1996); 2) continuous treatment with one antipsychotic medication for at least 3 months; 3) no history of alcohol or other substance dependence as determined by the SCID-IV-CV; 4) no history of alcohol or other substance abuse in the 3 months prior to entry into the study (determined with the SCID-IV-CV and a urine screen if substance use was suspected); 5) no history of head injury with loss of consciousness for more than 5 minutes or other neurological disease; and 6) no psychiatric hospitalization in the last 3 months. All patients were receiving clinical doses of antipsychotic medications (10 on novel antipsychotic medications, 2 on conventional). All patients had inpatient treatment at least once, with 8-25 years since psychotic symptom onset (mean = 18.74, SD = 10.69). Mean scores on the Positive and Negative Symptom Scale (PANSS; Kay et al., 1987) were 13.54 (SD = 2.97) for PANSS Positive and 17.00 (SD = 6.05) for PANSS Negative. On the Schedule for the Assessment of Negative Symptoms, mean total score was 35.45 (SD = 16.24). Both scales were administered by trained, reliable raters.
Eighteen normal control subjects (mean age = 43.2 years, SD = 9.6; 14 males, 4 females) were recruited from the local community through advertisements placed in local newspapers. Selection criteria for control subjects were: 1) no history of psychiatric dysfunction as determined by SCID-IV-CV; 2) no history of alcohol or other substance dependence as determined by the SCID-IV-CV; 3) no history of alcohol or other substance abuse in the 3 months prior to entry into the study (determined with the SCID-IV-CV and a urine screen if substance use was suspected); 4) no family history of psychotic disorder in first degree relatives; and 5) no history of head injury with loss of consciousness for more than 5 minutes (American Psychiatric Association, 1994) or other neurological disease. Subjects gave written informed consent for a protocol approved by the Human Research Review Committee at the University of New Mexico and the Albuquerque VA Medical Center.
2.2. Somatosensory Stimuli and Data Collection Procedures
Subjects were comfortably seated in a semi-reclining position throughout the experiment. Electrical stimuli (0.20 ms duration) were presented unilaterally in blocked trials to the left or the right median nerves via electrode pairs attached to each wrist. Stimuli were delivered using a Grass constant-current generator. In order to objectively determine the presence and extent of median nerve stimulation, stimulus intensity was adjusted for each subject until a thumb twitch was evoked. Stimuli were presented in pairs with an Interstimulus Interval (ISI) of 500 ms, with an onset-to-onset inter-trial interval of 8 s. Over approximately 45 minutes stimuli were collected until 150 trials of each stimulus type were collected without eye-blink or other artifacts. MEG data were collected and analyzed using Neuromag (2002) software. Subjects were closely watched on a video monitor for any movement or muscle contractions, and trials in which movement occurred are immediately evident in the MEG data (trials with such artifact were rejected). During data collection, a trial was rejected automatically if there was magnetic activity greater than 1500 fT peak-to-peak in any channel.
Leahy et al. (1998) established that the spherical model is as accurate as alternative models (e.g., a boundary element model) for parietal, superior-temporal, and occipital regions (see also Ermer et al., 2001), and a spherical model was used for analysis of S1 and S2.
2.3. Analysis of Magnetic M20 Sources Localizing to Primary Somatosensory Cortex
Magnetic data time-locked to unilateral stimulus presentation was averaged for Stimulus 1, and separately for Stimulus 2. For modeling the contralateral Stimulus 1 M20, a subset of 48 MEG channels over relevant parietal cortical areas was selected from the full 122-channel sensor array (Hamaleinen et al., 1993). Because MEG generally has better near-source (but poorer distant-source) resolving capability than EEG, it is common in dense-array MEG source analysis to in effect “turn off” sensors over cortex that one is not interested in investigating. Accordingly, the selection of sensors for our somatosensory dipoles was appropriate for and driven by the broad cortical regions of interest chosen a priori. More generally, it only takes 5 channels to localize one dipole using spherical MEG model, since there are only 5 unknown parameters (3 for location and two for dipole moments: Hamalainen et al., 1993). Thus, 48 channels are sufficient to reliably localize the SI and /or SII dipole even when noise exists.
Since the present study was designed to compare auditory gating with somatosensory gating, the analysis was kept as close as possible to that for auditory gating. In the auditory gating paradigm, the spatio-temporal fit is computed using 5 ms of data on either side of the peak. This interval was not optimal for the primary somatosensory data because the waveform is much sharper and the response much faster, and so SI was modeled using 3 ms of data on either side of the peak.
Pre-stimulus baseline (-100 to -10 ms) for each event-related field (ERF) was removed. Symmetrical digital filters were applied offline, a low-pass filter of 150 Hz with a filter width of 15 Hz (where width is defined as the frequency difference between the 0 dB point and the -3 dB point), and a highpass filter of 15 Hz with a width of 3 Hz. To remove ambient noise, a 60 Hz notch filter with a 5 Hz width (where width is defined as the frequency difference to the center of the notch) was also applied. Three milliseconds of data before and after the M20 peak were then selected for spatio-temporal modeling. All ECDs had goodness-of-fit values (a measure of the correlation between calculated and measured signals) exceeding 80% for Stimulus 1.
For the Stimulus 2 M20, the location and orientation of the dipole were assumed to be the same as that of the Stimulus 1 dipole. This assumption was made for three reasons. First, this assumption is part of the auditory gating analysis, the procedures for which we intended to match as closely as possible. Second, because the signal associated with S2 is considerably weaker, the assumptions on which the source modeling algorithm depends are not met as well, and the localizations for S2 would not typically be considered as reliable. Third, the assumption of consistent generators is parsimonious, with no known contraindications. Thus, as standard procedure we use the localizations from S1 (which is based on good signal to noise).
Peak source strengths were determined for both Stimulus 1 and Stimulus 2, and M20 gating for each hemisphere was expressed as the ratio: Stimulus 2 dipole strength divided by Stimulus 1 dipole strength.
2.4. Analysis of Magnetic Sources Localizing to Secondary Somatosensory Cortex
Some researchers have reported that magnetic activation of secondary somatosensory cortex following median nerve stimulation is a bilateral phenomenon, but in present data there was great variability in the degree to which secondary somatosensory cortex was seen in the ipsilateral hemisphere. Although no systematic difference between groups was evident, some subjects had very strong ipsilateral secondary somatosensory cortex activation and some had none. For the sake of parsimony, only secondary somatosensory cortex signal in the contralateral hemisphere was considered for present analyses.
For identification and analysis of secondary somatosensory sources, the same subset of 48 MEG channels used for the primary somatosensory analysis, over relevant parietal cortical areas, was used. Pre-stimulus baseline was removed (-100 to -10 ms), and digital bandpass filtering of 1.5 Hz [width = 0.3] to 150 Hz [width = 15], with a 60 Hz notch (5 Hz width) was then applied to each computed average. In addition to sources localizing to primary and secondary somatosensory cortex, a number of brain regions comprising a network become electromagnetically active following median nerve stimulation. These areas include areas of motor cortex (primarily M1), superior parietal cortex, and area 9 of prefrontal cortex. For the present study only the source localizing to secondary somatosensory cortex was of interest. Thus, signal space projection (Neuromag, 2002) was used to remove magnetic activity associated with the primary somatosensory dipole. Other sources, such as those described above, were similarly removed when apparent. Localization for the contralateral secondary somatosensory source was then determined using an inverse solution based on averaged data in the selected sensors. For each subject, a secondary somatosensory source was localized to the superior lip of the sylvian fissure. Once source localization at the secondary somatosensory area was determined in this manner, spatiotemporal modeling of the secondary somatosensory response to Stimulus 1 was computed using 5 ms of data before and 5 ms after the peak amplitude, adopting the methods of the present auditory gating analysis (see Thoma et al., 2003).
ECDs having goodness-of-fit values exceeding 60% for Stimulus 1 were accepted for further analysis (mean =74.99%, SD = 14.04). This goodness-of-fit cutoff value was based, first, on our experience with the described hardware and software, and second, on our previous studies of median nerve stimulation (including extensive pilot work for the present study; see also the analyses published in Edgar et al., 2005). Third, this goodness of fit cut-off for SII was also based on the signal-to-noise ratio (SNR). For low SNR data, 60% may be a conservative cut, and it may be too liberal for data with high SNR, making a signal-to-noise cut-off entirely dependent on the analysis parameters, among them number of channels selected for forward modeling. For the present analysis, a 60% cutoff was determined to be appropriate for reliable analysis of these data.
Once the best-fitting dipole was identified, the average strength of the source over this 10 ms period was determined. Similar to the primary somatosensory analysis, for the Stimulus 2 source, the location and orientation of the Stimulus 2 dipole were assumed to be the same as that for Stimulus 1 dipole. Also, the same dipoles from other sources that were projected out for Stimulus 1 were projected out for Stimulus 2. As in the primary somatosensory analysis, once relevant source strengths were obtained, secondary somatosensory gating for each hemisphere was expressed as the ratio: Stimulus 2 dipole strength divided by Stimulus 1 dipole strength.
2.5. Behavioral Testing
In order to relate the MEG sensory gating measures to face-valid sensory phenomena, an unselected subgroup consisting of seven patients and nine control subjects was tested with a standard 2-point discrimination task (Lafayette Instrument, Model 16012, Three-Point Aesthesiometer). The 2-point aesthesiometer was used to determine the sensitivity of the right hand of right-handed subjects using the thumb pad on the palm, an area innervated by the median nerve. Each subject was instructed to close his/her eyes while the administrator applied the two contact points. The subject was asked to report whether he/she felt one or two points. To reduce bias, two values were recorded for each of two trials. The first trial was performed by increasing the aesthesiometer distance from 0 cm in 1 mm steps until the subject was able to successfully resolve two points. The second trial was accomplished by decreasing the distance in 1 mm steps, beginning 1 cm larger than the final discrimination trial from step 1, until the subject was not able to successfully resolve two points. The average of these two discrimination trials was analyzed.
3. Results
3.1. Gating Ratios
A Group x Hemisphere x Region (primary vs. secondary somatosensory) repeated-measures MANOVA examining gating ratios identified main effects for Group (patients > controls, F(1,22) = 17.83, P < 0.001), Hemisphere (left < right, F(1,22) = 3.80, P = 0.06), and Region (primary > secondary, F(1,22) = 68.32, P < 0.001). Investigation of a Group x Region interaction (F(1,22) = 6.48, P = 0.02) using t-tests indicated no group difference for primary somatosensory gating ratios (t = -1.19, P = 0.25; Figure 1a), but a group difference for secondary somatosensory gating ratios (t = -2.85, P = 0.02; Figure 1b). The Group x Hemisphere x Region, Group x Hemisphere, and Hemisphere x Region interactions did not approach significance. No zero-order correlations between primary and secondary somatosensory gating ratios approached significance.
Figure 1.
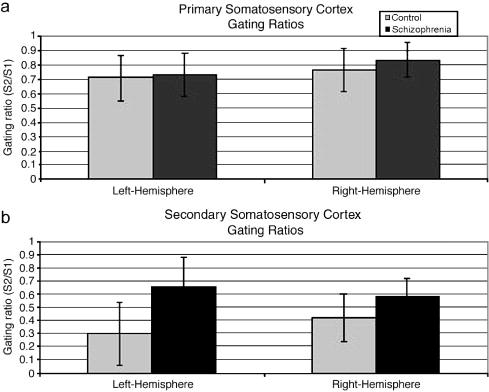
a) Means and standard deviations of primary somatosensory gating ratios by group. b) Means and standard deviations of secondary somatosensory gating ratios by group.
3.2. Primary Somatosensory Region Source Strength
In order to determine whether group differences in gating ratios are actually attributable to group differences in either Stimulus 1 or Stimulus 2 source strength, a Group x Hemisphere x Stimulus (Stimulus 1, Stimulus 2) repeated-measures MANOVA was used. Differences in source strength between primary and secondary somatosensory regions were not of interest, so separate analyses were done for each region. For M20 source strengths localizing to the primary somatosensory region, the only significant effect was the expected reduction of Stimulus 2 relative to Stimulus 1 (F(1, 22) = 23.73, P < 0.001; Table 1). The main effects of Group and Hemisphere, and the interactions did not approach significance (all P’s > .15).
Table 1.
Means (Standard Deviations) for Source Strengths (in nAm)
| Control Group | Schizophrenia Group | |||
|---|---|---|---|---|
| Stimulus 1 | Stimulus 2 | Stimulus 1 | Stimulus 2 | |
| Left Hemisphere | ||||
| Primary Somatosensory | 22.54
(9.6) |
17.61
(7.8) |
30.09
(12.9) |
21.61
(9.88) |
| Secondary Somatosensory | 26.57
(19.74) |
9.00
(8.38) |
46.36
(40.96) |
30.15
(23.38) |
| Right Hemisphere | ||||
| Primary Somatosensory | 21.32
(9.9) |
16.8
(8.5) |
27.21
(15.41) |
23.88
(10.87) |
| Secondary Somatosensory | 42.76
(32.1) |
17.05
(14.56) |
62.82
(54.44) |
28.61
(29.0) |
3.3. Secondary Somatosensory Source Strength
In a Group x Hemisphere x Stimulus MANOVA of secondary somatosensory source strength, the interactions did not approach significance. The only effect was for Stimulus (F(1, 22) = 33.73, P < 0.001), with the source strength smaller for Stimulus 2 than Stimulus 1. This indicates that although controls gate more than patients (Figure 1b), both groups were gating.
3.4. Dipole Latency
Averaging across Group and Hemisphere, peak source strength in the primary somatosensory region occurred at 24 ms (Figure 2) and in secondary somatosensory region at 83 ms (Figure 3). Since these latency differences were expected, to investigate possible dipole latency differences, two separate omnibus mixed-model MANOVAs were used. In the first, group latency differences for M20 dipoles localizing to the primary somatosensory region were examined using Hemisphere and Stimulus as within subjects factors. No main effects or interactions approached significance. A second MANOVA for secondary somatosensory latency also found no main effects or interactions approaching significance.
Figure 2.
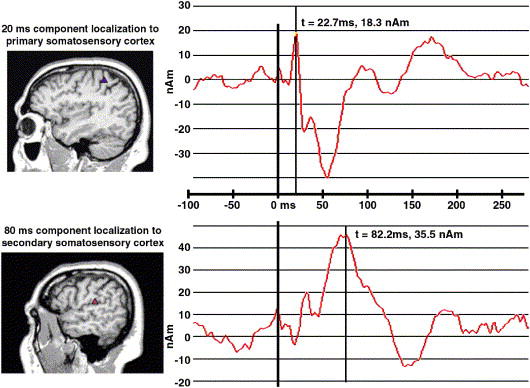
a) MEG M20 source dipole and localization in primary somatosensory cortex on the posterior bank of the central sulcus. b) MEG M80 source dipole and localization in secondary somatosensory cortex on the superior lip of the sylvian fissure.
Figure 3.
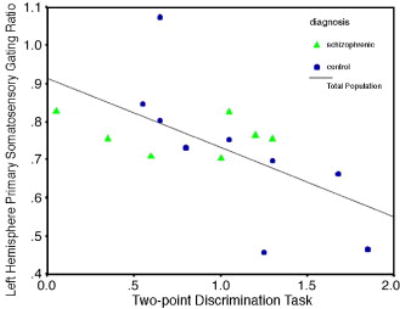
Scatterplot of scores on the two-point discrimination task measured on the right hand and primary somatosensory gating ratios.
3.5. Dipole Location
Dipole localizations were characterized on a three-dimensional grid, where the x-axis refers to the left-right dimension, the y-axis to the anterior-posterior dimension, and the z-axis to the superior-inferior dimension. Group differences in Hemisphere, Region, and Dimension were investigated using MANOVA. There was no group difference for the x and y dimension values, but a significant difference was found in the z dimension for both the left (F(1,26) = 4.73, P = 0.04) and right (F(1,26) = 4.91, P = 0.04) hemispheres in primary somatosensory region, controls having a more superior localization. There was a trend toward a similar effect for secondary somatosensory localization in the left hemisphere (F(1,26) = 3.49, P = 0.07).
3.6. Medication Effects
Medication effects were not one of the primary hypotheses of this study but sometimes affect auditory sensory gating. In Medication x Hemisphere x Region MANOVAs for gating or source strength, no effects involving medication were obtained.
3.7. Two-point Discrimination
There was no group difference in two-point discrimination task performance (t(15) = 0.71, P = 0.49). In a regression, the dependent variable, performance on the two-point discrimination task measured on the right hand, was regressed on left-hemisphere primary and secondary somatosensory gating ratios. The overall regression was significant (F(3,11) = 3.35, P = .02) primary somatosensory gating (β = -.69, P = 0.007; see Figure 4), but not secondary somatosensory (β = .19, P = 0.37) varied with two-point discrimination performance. Thus, the worse subjects were gating at primary somatosensory cortex, the better they were at discriminating the two points.
4. Discussion
Abnormality of cortical tissue is a common finding in patients with schizophrenia (for reviews, see Lawrie and Abukmeil, 1998; Lawrie et al., 2001; Shenton et al., 2001). Although sensory gating is typically described in terms of information processing and subjective sensory overload, it may also be useful as a metric of the health and successful function of relevant neural tissue in schizophrenia (Huang et al., 2003; Thoma et al., 2003, 2004). Consistent with recent studies showing primary somatosensory cortex to be normal both structurally (Cannon et al., 2002) and functionally (Arnfred et al., 2001a, b; Edgar et al., 2005), the present study found no evidence of a schizophrenia gating deficit in primary somatosensory cortex.
In contrast, patients with schizophrenia showed a gating deficit in secondary somatosensory cortex, also consistent with the structural data of Cannon et al. (2002). Secondary somatosensory cortex has been shown to play a role in bilateral coordination of the hands and intramanual dexterity (Krubitzer et al., 1995), processing of temporal features of somatic sensation (Burton and Sinclair, 1991; Karhu and Tesche, 1999), and tactile recognition and retention of shapes (Mishkin, 1979; Murray and Mishkin, 1984). Conceivably, abnormality of secondary somatosensory inhibition early in processing may underlie impairment of downstream sensory integration and motor coordination noted in schizophrenia (Manschreck et al., 1982; Lawrie et al., 2001).
There was no group discrimination difference in a tactile discrimination measure included as a possible correlate of the secondary somatosensory deficit. Task performance correlated negatively only with primary somatosensory gating. The better a subject was able to discriminate the two points, the worse they were at gating the primary somatosensory response. This finding provides some behavioral validation of the present somatosensory protocol and is consistent with research demonstrating very different afferent input to primary and secondary somatosensory regions (Friedman and Murray, 1986; Burton et al., 1990).
Patients with schizophrenia show a sensory gating deficit in primary auditory cortex (Adler et al., 1982; Clementz and Blumenfeld, 1997; Huang et al., 2003; Thoma et al., 2003), but present data indicate that in the somatosensory modality the gating deficit is in secondary somatosensory cortex, a site commonly thought of as association cortex (Kakigi et al., 2000; Karhu and Tesche, 1999). One possibility is that these auditory and somatosensory deficits reflect abnormality of local tissue. Whereas observable local activation may end after 200 ms in somatosensory regions, the time course of excitability and refractory phenomena may be much longer, a well known finding in the nervous system. Directly relevant here, for example, somatosensory processing regions and particularly secondary somatosensory cortex remain active for as much as 8 seconds following electrical stimulation of the periphery (Hari et al., 1993), rendering it possible that local changes associated with S1 directly influence the processing of S2 at an ISI of just 500 ms. Although it is possible that there is a direct influence of S1 upon S2, it is not necessary or even likely that this is the case.
Similarities between gating in each sensory modality suggest that the gating phenomenon reflects the action of a shared circuit or mechanism comprised of brain regions relatively remote from somatosensory cortex. First, group mean gating ratios in secondary somatosensory cortex were consistent with those reported for auditory sensory gating (~0.30 for controls and >0.60 for schizophrenia patients), consistent with a similar inhibitory mechanism across modalities. All subjects with schizophrenia were taking antipsychotic medication, and another similarity between sensory modalities is that of medication effects. Recent research has shown that left-hemisphere auditory gating is relatively normalized by novel antipsychotic medications (Cañive et al., 2004). Despite the small sample size, there was a trend in present data toward those on novel antipsychotic medications having better left-hemisphere secondary somatosensory gating. Although present hypotheses were based on gating impairment being related to local areas of cortex, median nerve stimulation excites multiple areas of cortex, including primary and secondary somatosensory areas, primary motor cortex, superior parietal cortex, and other areas constituting a circuit critical for somatosensation and motor control (Karhu and Tesche, 1999). This raises the possibility that impaired gating in secondary somatosensory cortex reflects impairment in other aspects of the circuit. Studies of prepulse inhibition (another variant of gating) have implicated such regions as prefrontal cortex, amygdala/hippocampus, and thalamic nuclei as critical to successful gating. Sensory gating has long been thought to be hippocampal-dependent, and recent studies in humans demonstrate the importance of hippocampus for the gating effect (Fiedler et al., 2006; Sanchez et al., 2004). Knight and colleagues (Knight et al., 1999; Chao & Knight, 1998) demonstrated similar impairment of sensory modulation in auditory and somatosensory cortical responses in patients with prefrontal cortex damage, which may also contribute to impaired gating across modalities. Data from our lab are consistent with this research and have demonstrated correlations between gating and neuropsychological measures of attention and working memory that are dependent on prefrontal processing (Thoma et al., 1993). Thus, there is no reason to presume that activation associated with S1 in somatosensory cortex must directly influence that associated with temporally downstream S2, whereas there is strong evidence to suggest that successful gating is dependent on the action of a distributed circuit.
Thoma et al. (2004) demonstrated that increased cortical thickness at dipole locations associated with gating in auditory regions predicted less impaired gating in schizophrenia. To the extent that gating is dependent on the action of a distributed circuit, a relationship between reduced gating and smaller cortical thickness may reflect developmental or atrophic characteristics of brain abnormality in schizophrenia. Future studies of the relationship of liability and genetic markers for schizophrenia to cross–modal gating may help to resolve this issue. Further investigation of functional abnormality in other areas of the circuit, particularly in the working of later, presumably downstream information processing, may help to place secondary somatosensory gating in a temporal context within this circuit. It is conceivable that patients’ medication affected S1 response and S2 response, or SI cortex and SII cortex, differentially and future research with a drug-free sample might help to explore this issue. Future studies may also directly compare somatosensory gating with auditory sensory gating to address the cross-modal nature of a gating deficit in schizophrenia or with the structural abnormality in STG and secondary somatosensory cortex, in order to further investigate cortical abnormality related to information processing deficits in schizophrenia.
Acknowledgments
The authors wish to thank Roland R. Lee, M.D. for his help and support, Juan Bustillo, M.D., Fernando Torres, and Robin Douglas for assistance with diagnostic identification and recruitment of patients, and J. Christopher Edgar, Ph.D., for input during the formation of this project. This research was made possible by NIMH grant R01-MH65304 to the senior author, Mental Illness Neuroscience Discovery (MIND) Institute Grants to the first author and senior author and a NARSAD Junior Investigator Award to the first author.
Footnotes
Publisher's Disclaimer: This is a PDF file of an unedited manuscript that has been accepted for publication. As a service to our customers we are providing this early version of the manuscript. The manuscript will undergo copyediting, typesetting, and review of the resulting proof before it is published in its final citable form. Please note that during the production process errors may be discovered which could affect the content, and all legal disclaimers that apply to the journal pertain.
References
- Adler LE, Pachtman E, Franks RD, Pecevich M, Waldo MC, Freedman R. Neurophysiological evidence for a defect in neuronal mechanisms involved in sensory gating in schizophrenia. Biological Psychiatry. 1982;17:639–654. [PubMed] [Google Scholar]
- Adler LE, Olincy A, Waldo M, Harris JG, Griffith J, Stevens K, Flach K, Nagamoto H, Bickford P, Leonard S, Freedman R. Schizophrenia, sensory gating, and nicotinic receptors. Schizophrenia Bulletin. 1998;24(2):189–202. doi: 10.1093/oxfordjournals.schbul.a033320. [DOI] [PubMed] [Google Scholar]
- American Psychiatric Association, . Diagnostic and Statistical Manual of Mental Disorders. Fourth. Washington, DC: American Psychiatric Association; 1994. [Google Scholar]
- Arnfred SM, Chen AC, Eder DN, Glenthoj BY, Hemmingsen RP. A mixed modality paradigm for recording somatosensory and auditory P50 gating. Psychiatry Research. 2001a;105(1-2):79–86. doi: 10.1016/s0165-1781(01)00316-x. [DOI] [PubMed] [Google Scholar]
- Arnfred SM, Eder DN, Hemmingsen RP, Glenthoj BY, Chen AC. Gating of the vertex somatosensory and auditory evoked potential P50 and the correlation to skin conductance orienting response in healthy men. Psychiatry Research. 2001b;101(3):221–235. doi: 10.1016/s0165-1781(01)00226-8. [DOI] [PubMed] [Google Scholar]
- Arnfred SM, Chen ACN. Exploration of somatosensory P50 gating in schizophrenia spectrum patients: reduced P50 amplitude correlates to social anhedonia. Psychiatry Research. 2004;125:147–160. doi: 10.1016/j.psychres.2003.12.008. [DOI] [PubMed] [Google Scholar]
- Barba C, Frot M, Mauguiere F. Early secondary somatosensory area (SII) SEPs. Data from intracerebral recordings in humans. Clinical Neurophysiolology. 2002;113(11):1778–1786. doi: 10.1016/s1388-2457(02)00261-4. [DOI] [PubMed] [Google Scholar]
- Bramon E, Rabe-Hesketh S, Sham P, Murray RM, Frangou S. Meta-analysis of the P300 and P50 waveforms in schizophrenia. Schizophrenia Research. 2004;70:315–329. doi: 10.1016/j.schres.2004.01.004. [DOI] [PubMed] [Google Scholar]
- Broekema V, Rosenbaum G. Cutaneous sensitivity in schizophrenia and normals under two levels of proprioception arousal. Journal of Abnormal Psychology. 1975;84:30–35. doi: 10.1037/h0076250. [DOI] [PubMed] [Google Scholar]
- Blumenfeld LD, Clementz BA. Hemispheric differences on auditory evoked response suppression in schizophrenia. Neuroreport. 1999;10(12):2587–2591. doi: 10.1097/00001756-199908200-00027. [DOI] [PubMed] [Google Scholar]
- Boutros NN, Zouridakis G, Overall J. Replication and extension of P50 findings in schizophrenia. Clinical Electroencephalography. 1991;22(1):40–5. doi: 10.1177/155005949102200109. [DOI] [PubMed] [Google Scholar]
- Burton H, Sinclair RJ. Second somatosensory cortical area in macaque monkeys. I. Neuronal responses to controlled, punctate indentations of glabrous skin on the hand. Brain Research. 1990;520(1-2):262–271. doi: 10.1016/0006-8993(90)91714-r. [DOI] [PubMed] [Google Scholar]
- Burton H, Sinclair RJ. Second somatosensory cortical area in macaque monkeys: II. Neuronal responses to punctate vibrotactile stimulation of glabrous skin on the hand. Brain Research. 1991;538(1):127–135. doi: 10.1016/0006-8993(91)90386-a. [DOI] [PubMed] [Google Scholar]
- Burton H, Sinclair RJ, Hong SY, Pruett JR, Whang KC. Tactile-spatial and cross-modal attention effects in the second somatosensory and 7b cortical areas of rhesus monkeys. Somatosensory Motor Research. 1997;14(4):237–267. doi: 10.1080/08990229770971. [DOI] [PubMed] [Google Scholar]
- Cañive JM, Hanlon FM, Thoma RJ, Moses SN, Weisend MP, Huang M, Irwin J, Paulson K, Martin K, Edgar JC, Miller GA. P50 sensory gating in schizophrenia patients treated with conventional and novel antipsychotics. International Journal of Neuropsychopharmacology. 2004;7(1):S223–S224. suppl 1. [Google Scholar]
- Cannon TD, Thompson PM, van Erp TG, Toga AW, Poutanen VP, Huttunen M, Lonnqvist J, Standerskjold-Nordenstam CG, Narr KL, Khaledy M, Zoumalan CI, Dail R, Kaprio J. Cortex mapping reveals regionally specific patterns of genetic and disease-specific gray-matter deficits in twins discordant for schizophrenia. Proceedings of the National Academy of Sciences. 2002;99(5):3228–3233. doi: 10.1073/pnas.052023499. [DOI] [PMC free article] [PubMed] [Google Scholar]
- Chang BP, Lenzenwenger MF. Somatosensory processing in the biological relatives of schizophrenia patients: A signal detection analysis of two-point discrimination. Journal of Abnormal Psychology. 2001;110(3):433–442. doi: 10.1037//0021-843x.110.3.433. [DOI] [PubMed] [Google Scholar]
- Clementz BA, Blumenfeld LD, Cobb S. The gamma band response may account for poor P50 suppression in schizophrenia. Neuroreport. 1997b;8(18):3889–3893. doi: 10.1097/00001756-199712220-00010. [DOI] [PubMed] [Google Scholar]
- Clementz BA, Geyer MA, Braff DL. P50 suppression among schizophrenia and normal comparison subjects: A methodological analysis. Biological Psychiatry. 1997a;41:1035–1044. doi: 10.1016/S0006-3223(96)00208-9. [DOI] [PubMed] [Google Scholar]
- Clementz BA. Psychophysiological measures of disinhibition as liability indicators for schizophrenia. Psychophysiology. 1998;35(6):648–668. [PubMed] [Google Scholar]
- Clementz BA, Blumenfeld LD. Multichannel electroencephalographic assessment of auditory evoked response suppression in schizophrenia. Experimental Brain Research 1. 2001;39:377–390. doi: 10.1007/s002210100744. [DOI] [PubMed] [Google Scholar]
- Edgar JC, Huang M, Weisend MP, Sherwood A, Miller GA, Adler LE, Cañive JM. Interpreting abnormality: An EEG and MEG study of P50 and the auditory paired-stimulus paradigm. Biological Psychology. 2003;65(1):1–20. doi: 10.1016/s0301-0511(03)00094-2. [DOI] [PubMed] [Google Scholar]
- Edgar JC, Moses SN, Huang M, Thoma RJ, Hanlon FM, Weisend MP, Miller GA, Cañive JM. Cross-modal generality of the gating deficit in schizophrenia. Psychophysiology. 2005;42(3):318–327. doi: 10.1111/j.1469-8986.2005.00292.x. [DOI] [PubMed] [Google Scholar]
- Ermer JJ, Mosher JC, Baillet S, Leahy RM. Rapidly recomputable EEG forward models for realistic head shapes. Physics in Medicine and Biology. 2001;46(4):1265–81. doi: 10.1088/0031-9155/46/4/324. [DOI] [PubMed] [Google Scholar]
- Fiedler BJ, Debus OM, Neubauer BA, Kienle M, Kurlemann G. P50 sensory gating deficit in children with centrotemporal spikes and sharp waves in the EEG. Neuroscience Letters. 2006;393(2-3):206–210. doi: 10.1016/j.neulet.2005.09.071. [DOI] [PubMed] [Google Scholar]
- First MB, Spitzer RL, Gibbon M, Williams JBW. Structured Clinical Interview for DSM-IV Axis I Disorders (SCID), Clinician Version . Washington, DC: American Psychiatric Press; 1996. [Google Scholar]
- Freedman R, Adler LE, Waldo MC, Pachtmen E, Franks RD. Neurophysiological evidence for a defect in inhibitory pathways in schizophrenia: comparison of medicated and drug-free patients. Biological Psychiatry. 1983;18(5):537–51. [PubMed] [Google Scholar]
- Freedman R, Adler LE, Gerhardt GA, Waldo M, Baker N, Rose GM, Drebing C, Nagamoto H, Bickford-Wimer P, Franks R. Neurobiological studies of sensory gating in schizophrenia. Schizophrenia Bulletin. 1987;13(4):669–78. doi: 10.1093/schbul/13.4.669. [DOI] [PubMed] [Google Scholar]
- Friedman DP, Murray EA. Thalamic connectivity of the second somatosensory area and neighboring somatosensory fields of the lateral sulcus of the macaque. J Comp Neurol. 1986;252(3):348–73. doi: 10.1002/cne.902520305. [DOI] [PubMed] [Google Scholar]
- Hamalainen M, Hari R, Ilmoniemi RJ, Knuutila J, Lounasmaa OV. Magnetoencephalography-Theory, instrumentation and applications to noninvasive studies of the working human brain. Reviews of Modern Physics. 1993;65(2):413–97. [Google Scholar]
- Hanlon FM, Miller GA, Thoma RJ, Irwin J, Jones A, Moses SN, Huang M, Weisend MP, Paulson KM, Edgar C, Adler LE, Cañive JM. Distinct M50 and M100 auditory gating deficits in schizophrenia. Psychophysiology. 2005;42:417–427. doi: 10.1111/j.1469-8986.2005.00299.x. [DOI] [PubMed] [Google Scholar]
- Hansson T, Brismar T. Loss of sensory discrimination after median nerve injury and activation in the primary somatosensory cortex on functional magnetic resonance imaging. Journal of Neurosurgery. 2003;99(1):100–105. doi: 10.3171/jns.2003.99.1.0100. [DOI] [PubMed] [Google Scholar]
- Hari R, Karhu J, Hamalainen M, Knuutila J, Salonen O, Sams M, Vilkman V. Functional organization of the human first and second somatosensory cortices: a neuromagnetic study. European Journal of Neuroscience. 1993;5(6):724–34. doi: 10.1111/j.1460-9568.1993.tb00536.x. [DOI] [PubMed] [Google Scholar]
- Heinrichs RW. Meta-analysis and the science of schizophrenia: Variant evidence or evidence of variants? Neurosciences and Biobehavioral Reviews. 2004;28:379–394. doi: 10.1016/j.neubiorev.2004.06.003. [DOI] [PubMed] [Google Scholar]
- Hetrick WP, Sandman CA, Bunney WE, Jin Y, Potkin SG, White MH. Gender differences in gating of the auditory evoked potential in normal subjects. Biological Psychiatry. 1996;39(1):51–58. doi: 10.1016/0006-3223(95)00067-4. [DOI] [PubMed] [Google Scholar]
- Huang M, Edgar C, Thoma RJ, Hanlon FM, Moses SN, Lee RR, Paulson K, Weisend MP, Bustillo J, Adler LE, Miller GA, Cañive JM. Predicting EEG responses using MEG sources in superior temporal gyrus reveals source anomaly in patients with schizophrenia. Clinical Neurophysiology. 2003;114:835–850. doi: 10.1016/s1388-2457(03)00041-5. [DOI] [PubMed] [Google Scholar]
- Judd LL, McAdams L, Budnick B, Braff DL. Sensory gating deficits in schizophrenia: new results. American Journal of Psychiatry. 1992;49(4):488–493. doi: 10.1176/ajp.149.4.488. [DOI] [PubMed] [Google Scholar]
- Kakigi R, Hoshiyama M, Shimojo M, Naka D, Yamasaki H, Watanabe S, Xiang J, Maeda K, Lam K, Itomi K, Nakamura A. The somatosensory evoked magnetic fields. Progress in Neurobiology. 2000;61:495–523. doi: 10.1016/s0301-0082(99)00063-5. [DOI] [PubMed] [Google Scholar]
- Karhu J, Tesche CD. Simultaneous early processing of sensory input n human primary (SI) and secondary (SII) somatosensory cortices. Journal of Neurophysiology. 1999;81(5):2017–2025. doi: 10.1152/jn.1999.81.5.2017. [DOI] [PubMed] [Google Scholar]
- Kasai K, Shenton ME, Salisbury DF, Onitsuka T, Toner SK, Yurgelun-Todd D, Kikinis R, Jolesz FA, McCarley RW. Differences and similarities in insular and temporal pole MRI gray matter volume abnormalities in first-episode schizophrenia and affective psychosis. Archives of General Psychiatry. 2003;60(11):1069–1077. doi: 10.1001/archpsyc.60.11.1069. [DOI] [PubMed] [Google Scholar]
- Kay SR, Fiszbein A, Opler LA. The Positive and Negative Syndrome Scale (PANSS) for schizophrenia. Schizophrenia Bulletin. 1987;13:261–276. doi: 10.1093/schbul/13.2.261. [DOI] [PubMed] [Google Scholar]
- Knight RT, Staines WR, Swick D, Chao LL. Prefrontal cortex regulates inhibition and excitation in distributed neural networks. Acta Psychologica. 1999;101:159–178. doi: 10.1016/s0001-6918(99)00004-9. [DOI] [PubMed] [Google Scholar]
- Krubitzer L, Clarey J, Tweedale R, Elston G, Calford M. A redefinition of somatosensory areas in the lateral sulcus of macaque monkeys. Journal of Neuroscience. 1995;15(5):3821–3839. doi: 10.1523/JNEUROSCI.15-05-03821.1995. [DOI] [PMC free article] [PubMed] [Google Scholar]
- Leahy RM, Mosher JC, Spencer ME, Huang MX, Lewine JD. A study of dipole localization accuracy for MEG and EEC using a human skull phantom. Electroencephalography and Clinical Neurophysiology. 1998;107(2):159–173. doi: 10.1016/s0013-4694(98)00057-1. [DOI] [PubMed] [Google Scholar]
- Lenzenweger MP. Two-point discrimination thresholds and schizotypy: Illuminating a somatosensory dysfunction. Schizophrenia Research. 2000;42:902–907. doi: 10.1016/s0920-9964(99)00120-6. [DOI] [PubMed] [Google Scholar]
- Lawrie SM, Abukmeil SS. Brain abnormality in schizophrenia: A systematic and quantitative review of volumetric magnetic resonance imaging studies. British Journal of Psychiatry. 1998;172:110–20. doi: 10.1192/bjp.172.2.110. [DOI] [PubMed] [Google Scholar]
- Lawrie SM, Whalley HC, Abukmeil SS, Kestelman JN, Donnelly L, Miller P, Best JJ, Owens DG, Johnstone EC. Brain structure, genetic liability, and psychotic symptoms in subjects at high risk of developing schizophrenia. Biological Psychiatry. 2001;49(10):811–23. doi: 10.1016/s0006-3223(00)01117-3. [DOI] [PubMed] [Google Scholar]
- Malamud W, Nygard WJ. The role played by the cutaneous senses in spatial perceptions: Investigations with mental diseases. Journal of Nervous and Mental Disorder. 1931;73:465–477. [Google Scholar]
- Manschreck TC, Maher BA, Rucklos ME, Vereen DR. Disturbed voluntary motor activity in schizophrenic disorder. Psychological Medicine. 1982;12:73–84. doi: 10.1017/s0033291700043300. [DOI] [PubMed] [Google Scholar]
- Mauguiere F, Merlet I, Forss N, Vanni S, Jousmaki P, Adeline R, Hari R. Activation of distributed somatosensory cortical network in the human brain. A dipole modeling study of magnetic fields evoked by median nerve stimulation, Part I: location, activation and timing of SEF sources. Electroencephalography and Clinical Neurophysiology. 1997;104:281–289. doi: 10.1016/s0013-4694(97)00006-0. [DOI] [PubMed] [Google Scholar]
- McCarley RW, Shenton ME, O’Donnell BF, Faux SF, Kikinis R, Nestor PG, Jolesz FA. Auditory P300 abnormalities and left posterior superior temporal gyrus volume reduction in schizophrenia. Archives of General Psychiatry. 1993;50(3):190–197. doi: 10.1001/archpsyc.1993.01820150036003. [DOI] [PubMed] [Google Scholar]
- McCarley RW, Salisbury DF, Hirayasu Y, Yurgelun-Todd DA, Tohen M, Zarate C, Kikinis R, Jolesz FA, Shenton ME. Association between smaller left posterior superior temporal gyrus volume on magnetic resonance imaging and smaller left temporal P300 amplitude in first-episode schizophrenia. Archives of General Psychiatry. 2002;59(4):321–331. doi: 10.1001/archpsyc.59.4.321. [DOI] [PubMed] [Google Scholar]
- Mishkin M. Analogous neural models for tactual and visual learning. Neuropsychologia. 1979;17(2):139–151. doi: 10.1016/0028-3932(79)90005-8. [DOI] [PubMed] [Google Scholar]
- Murray EA, Mishkin M. Relative contributions of SII and area 5 to tactile discrimination in monkeys. Behavioral Brain Research. 1984;11(1):67–83. doi: 10.1016/0166-4328(84)90009-3. [DOI] [PubMed] [Google Scholar]
- Neuromag, 2002. Source Modeling Software, User’s Guide, Software Version 5.2.3. [fmh: if you are referencing this, you should have the date in the reference within the text as well.]
- Nagamoto HT, Adler LE, Waldo MC, Freedman R. Sensory gating in schizophrenics and normal controls: effects of changing stimulation interval. Biological Psychiatry. 1989;25(5):549–61. doi: 10.1016/0006-3223(89)90215-1. [DOI] [PubMed] [Google Scholar]
- Pearlson GD. Superior temporal gyrus and planum temporale in schizophrenia: a selective review. Prog Neuropsychopharmacol Biol Psychiatry. 1997;21(8):1203–1229. doi: 10.1016/s0278-5846(97)00159-0. [DOI] [PubMed] [Google Scholar]
- Sanchez NM, Thoma RJ, Hanlon FH, Jones A, Petropolous H, Weisend M, Huang M, Miller GA, Canive JM. Anterior hippocampal volume correlated with hemisphere specific M50 sensory gating ratio. Poster presented at the annual meeting of the Cognitive Neuroscience Society Meeting.2004. [Google Scholar]
- Shenton ME, Dickey CC, Frumin M, McCarley RW. A review of MRI findings in schizophrenia. Schizophrenia Research. 2001;49(1-2):1–52. doi: 10.1016/s0920-9964(01)00163-3. [DOI] [PMC free article] [PubMed] [Google Scholar]
- Thoma RJ, Hanlon FM, Moses SN, Edgar JC, Huang M, Weisend MP, Irwin J, Sherwood A, Paulson K, Bustillo J, Adler LE, Miller GA, Cañive JM. Lateralization of auditory sensory gating and neuropsychological dysfunction in schizophrenia. American Journal of Psychiatry. 2003;160(9):1595–1605. doi: 10.1176/appi.ajp.160.9.1595. [DOI] [PubMed] [Google Scholar]
- Thoma RJ, Hanlon FM, Sanchez N, Weisend MP, Huang M, Jones A, Miller GA, Cañive JM. Auditory sensory gating deficit and cortical thickness in schizophrenia. Neurology and Clinical Neurophysiology. 2004;62:1–7. [PubMed] [Google Scholar]
- Wikstrom H, Roine RO, Aronen HJ, Salonen O, Sinkkonen J, Ilmoniemi RJ, Huttunen J. Specific changes in somatosensory evoked magnetic fields during recovery from sensorimotor stroke. Annals of Neurology. 2000;47(3):353–360. [PubMed] [Google Scholar]