

Abstract
The purpose of this study was to determine the sphingolipid (SL) profile in cells defective in autophagy protein ATG-7 and overall cell death after photodynamic therapy (PDT) with the photosensitizer Pc 4. MCF-7 human breast cancer cells with downregulated ATG-7 and their scrambled controls (Scr) were used. Exposure of ATG-7 knockdown cells to PDT led to increased cell killing. PDT evoked an early (2 h) greater global increase in ceramides in ATG-7 defective cells compared to Scr cells. The total increases in dihydroceramide (DHceramide) were significant at 2 h and 24 h in both cell types post-PDT. The levels of sphingosine-1-phosphate (S1P) and sphingosine were decreased below resting levels at both time points irrespective of the cell type. The data imply that ceramide might be a marker of ATG-7 deficiency in cells sensitized to PDT.
Keywords: Autophagy, ceramide, dihydroceramide, photodynamic therapy
Introduction
Macroautophagy (hereafter referred to as autophagy) is a survival response to stresses, such as starvation, and is characterized by formation of autophagosomes (autophagic vacuoles) in which a portion of cytoplasm is enclosed into a double-membrane. Following fusion of autophagosomes with lysosomes, the contents are digested by lysosomal enzymes. Atg genes, e.g., Atg-7, are required for conventional autophagic vacuole formation [1]. After initiation of autophagy, the cytosolic autophagy protein LC3-I binds to phosphatidylethanolamine to give rise to LC3-II, which associates with autophagosomal membrane [2]. The LC3-II is a conventional autophagosomal marker since lipidated LC3-II has greater electrophoretic mobility than LC3-I [3]. It has been proposed that inhibition of autophagy plays a role in anticancer action of chemotherapeutic drugs for breast cancer therapy [4].
PDT is a promising treatment modality for effective eradication of local malignancies, including breast cancer recurrences, especially in cases of chemoresistance or when other options for local control have been exhausted [5]. In PDT, tumor-localizing photosensitizers are activated by highly-focused laser light to induce oxidative stress in a cellular target that can lead to apoptosis. In various cell types, including caspase-3 defective MCF-7 cells, PDT can trigger autophagy [6, 7] that can be protective against cell death [6].
Ceramide is a bioactive SL involved in cell death. De novo ceramide biosynthesis begins with the condensation of palmitoyl-CoA and L-serine, resulting in the synthesis of 3-ketodihydrosphingosine, and is catalyzed by serine palmitoyltransferase (Fig. 1) [8, 9]. Subsequently, NADPH-dependent 3-ketodihydrosphingosine reductase converts 3-ketodihydrosphingosine into dihydrosphingosine (DHsphingosine). The latter is acted upon by DHceramide synthase, which introduces a fatty acyl group into the amide linkage, giving rise to DHceramide. Ceramide is formed from the latter by the formation of a trans-4,5-double bond in the reaction catalyzed by DHceramide desaturase. Ceramide is a building block for sphingomyelin and glucosylceramide. In addition, ceramide can be hydrolyzed to sphingosine by ceramidase, and sphingosine is converted to S1P by sphingosine kinase. While both ceramide and S1P initiate autophagy, they have opposing effects on cell death [10]. We have shown that increased ceramide and DHceramide levels with concomitant decrease in S1P correlate with apoptotic sensitization to PDT [11]. The aim of the present study was to determine the SL profile in MCF-7 cells with knocked-down expression of the autophagy protein ATG-7 relative to overall cell killing post-PDT.
Figure 1.
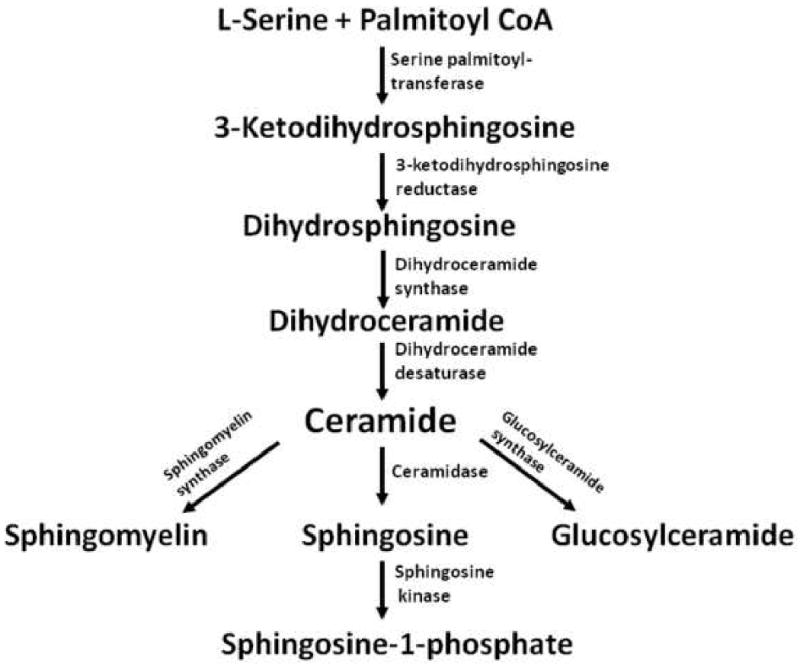
De novo ceramide biosynthesis and metabolism.
Experimental procedures
Materials
The phthalocyanine photosensitizer Pc 4, HOSiPcOSi(CH3)2(CH2)3N(CH3)2, was supplied by Dr. Malcolm E. Kenney (Department of Chemistry, Case Western Reserve University). Minimal essential medium (MEM) and serum were from Invitrogen and Hyclone, respectively. Anti-autophagy protein 7 and anti-LC3 were from Assay Designs and MBL, respectively.
Cell culture and treatments
MCF-7 cells were cultured in MEM medium supplemented with 10% fetal bovine serum, 2 mM L-glutamine, non-essential amino acids, 1 mM sodium pyruvate, 1.8 mg/ml Geneticin, 100 units/ml penicillin, and 100 μg/ml streptomycin. Cells were maintained at 37°C in a 5% CO2 atmosphere, and were treated in the growth medium. For PDT experiments, after overnight incubation with Pc 4 at 37°C, cells were irradiated with red light (2 milliwatts/cm2; λmax ∼ 670 nm) using a light-emitting diode array light source (EFOS) at the fluence of 400 mJ/cm2 at room temperature. Following PDT, cells were incubated at 37°C for desired periods of time. For SL experiments, cells were incubated overnight with Pc 4 (100 nM) prior to irradiation.
Immunoblotting
Cells were lysed in Laemmli buffer, boiled and then subjected to SDS-PAGE and immunoblotting for ATG-7 or LC3 detection, as reported previously [4, 12].
Cell viability
Cell viability was assessed using a clonogenic assay as reported previously [13]. Briefly, Cells (1.5 × 10⁶) were seeded in the growth medium devoid of Geneticin, preincubated with Pc 4 overnight, irradiated, collected, and plated in 60-mm Petri dishes. After 8 days of growth at 37°C, colonies (≥50 cells) were stained with crystal violet (0.1%) and counted. Plating efficiency was 38 and 21% for ATG-7 knockdown and Scr cells, respectively (n = 37 for each cell line).
Electrospray ionization/double mass spectrometry analysis
Following extraction, SLs were separated by high performance liquid chromatography, introduced to electrospray ionization source and then analyzed by double mass spectrometry (MS) using TSQ 7000 triple quadrupole mass spectrometer (Thermo-Fisher Scientific) as described previously [11].
Statistical analysis
To determine the effect of time, a two-sample t-test was used on log2 transformed SL concentrations (pmol/mg), comparing the data obtained at 2 and 24 h. A p-value and a fold-change were obtained for individual SL molecules between the two time points (2 and 24 h). The nominal p-values were adjusted across all individual molecules to control the false discovery rate at 5%. For overall effects, a one sample t-test was used on individual log2 ratios (PDT/control) within the family of ceramides or DHceramides in order to determine whether the ratios are different than 1. To determine overall cell line effect for each SL molecule, an analysis of variance on log2 transformed concentrations was used. A linear model was used to fit the log2 concentration of a given SL molecule as a function of the cell line (ATG-7, Scr), treatment (PDT or control), and time (2 and 24 h). Both untreated and Pc 4-treated controls were pooled to form the control group. Clonogenic assay data were analyzed by t-test.
Results and discussion
ATG-7 knockdown cells are defective in ATG-7 levels but not in PDT-triggered LC3 processing
It has been proposed that inhibition of autophagy plays a role in anticancer action of chemotherapeutic drugs for breast cancer therapy [4]. Downregulation of the autophagy protein ATG-7 by RNA interference in MCF-7 cells, as shown previously [4], was confirmed (Fig. 2). The processing of the autophagy protein marker LC3-I to the faster moving LC3-II product was used to verify the phenotype. Following PDT, LC3 processing was initiated, resulting in the formation of the faster-moving LC3-II product in both ATG-7 knockdown and Scr cells (Fig. 3). When cells were co-exposed to PDT and lysosomal inhibitors, the data were not different from PDT alone (not shown). The results indicate that ATG-7 knockdown cells are capable of LC3 processing.
Figure 2.
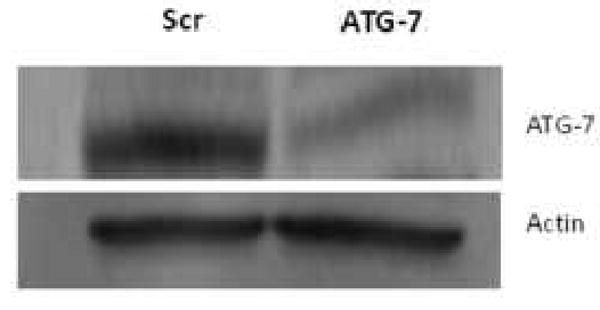
ATG-7 is downregulated in ATG-7 knockdown cells. Western blot analysis of ATG-7 expression in Scr and ATG-7 knockdown cells is shown. Untreated cells were collected and processed for Western. The protein loading was 20 μg per well in this and other Western blots. Scr, scrambled control.
Figure 3.
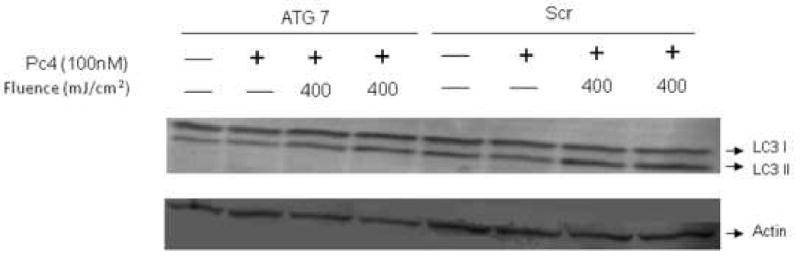
LC3 processing in two cell types after PDT. Cells were incubated overnight with Pc 4 prior to irradiation, incubated for 24 h, collected, and processed for Western blot analysis.
ATG-7 knockdown cells are sensitized to PDT
To determine the role of ATG-7 in photocytotoxicity, overall killing post-PDT was compared in two cell types using clonogenic assay. As shown in Table 1, at both PDT doses the survival was reduced in ATG-7 knockdown cells compared to their Scr controls. In addition, there was no activation of DEVDase post-PDT (not shown) consistent with caspase-3 deficiency of MCF-7 cells. The data demonstrate increased sensitization to PDT in ATG-7- and caspase-3-defective MCF-7 cells. These findings suggest the importance of ATG-7 downregulation in enhancing the efficacy of PDT.
Table 1.
ATG-7 knockdown cells are sensitized to Pc 4-PDT. (400 mJ/cm2 light fluence, avg SEM, * P<0.05)
| % Survival | ||
|---|---|---|
| 100 nM Pc4 | 500 nM Pc4 | |
| Scr | 80.0 ± 3.0 | 0.052335 ± 0.00291 |
| ATG-7 | 67.5 ±2.4* | 0.00171 ± 0.00017* |
Global increase in ceramides in autophagy-defective ATG-7 knockdown cells sensitized to PDT
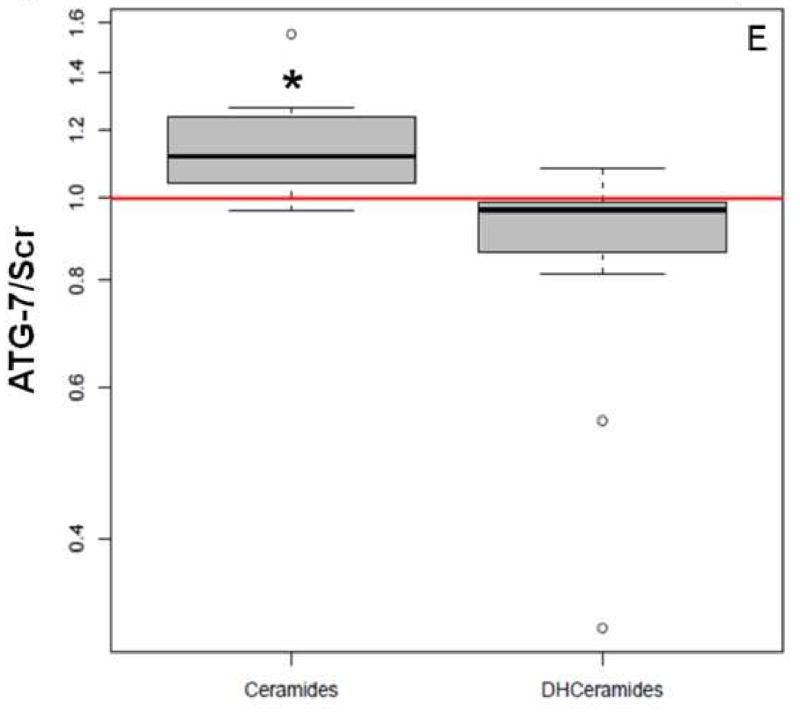
We have already demonstrated that PDT has signature effects on the SL profile in cancer cell lines and in vivo [11, 14]. In the present study we used MS to determine SL levels in the two breast cancer cell lines at 2 and 24 h post-PDT. We observed that basal SL levels (pmol/mg) were different for some SLs over time within a cell type, or between the two cell types at the same time point (see Supplementary Materials). Thus, the data were normalized and are shown in Table 2 and Figure 4. Globally, significant increases in ceramides were similar in ATG-7 knockdown cells at both time points. In Scr cells total increases in ceramide were also significant at both time points, but they were higher at 24 h than earlier. Notably, when the two cell types were compared, global increase in ceramides was 15% greater in the knockdown cell line at 2 h after treatment (Fig. 4E). The increase was significant (p<0.004).
Table 2.
PDT-evoked increases in SLs in ATG-7 and Scr cells.
| ATG-7 | SCR | |||
|---|---|---|---|---|
| 2 h | 24 h | 2 h | 24 h | |
| % CHANGE | ||||
| C14-Ceramide | 14 | 60 | -7 | 71 |
| C16-Ceramide | 5 | 52 | -3 | 72 |
| C18-Ceramide | 29 | 52 | 25 | 112 |
| C18:1-Ceramide | 93 | 39 | 24 | 56 |
| C20-Ceramide | 59 | 56 | 41 | 119 |
| C20:1-Ceramide | 68 | 62 | 43 | 83 |
| C22-Ceramide | 59 | 49 | 26 | 33 |
| C22:1-Ceramide | 50 | 47 | 17 | 56 |
| C24-Ceramide | 11 | 23 | 7 | 5 |
| C24:1-Ceramide | 14 | 38 | 9 | 35 |
| C26-Ceramide | 19 | 15 | 6 | -2 |
| C26:1-Ceramide | 22 | 22 | 27 | 18 |
| Global % Increase | 34 | 42 | 17 | 50 |
| C14-DHCeramide | 45 | 98 | 164 | 99 |
| C16-DHCeramide | 94 | 37 | 100 | 50 |
| C18-DHCeramide | 107 | 16 | 91 | 41 |
| C20-DHCeramide | 50 | 35 | 54 | 11 |
| C20:1-DHCeramide | -25 | 78 | 138 | 115 |
| C22-DHCeramide | 72 | 32 | 88 | 11 |
| C22:1-DHCeramide | 114 | 52 | 118 | 20 |
| C24-DHCeramide | 41 | 45 | 73 | -4 |
| C24:1-DHCeramide | 68 | 36 | 69 | 12 |
| C26-DHCeramide | 35 | 49 | 32 | -10 |
| C26:1-DHCeramide | 88 | 58 | 103 | 14 |
| Global % Increase | 57 | 47 | 90 | 28 |
| DHSph | -29 | 67 | -41 | 58 |
| Sphingosine | -82 | 29 | -86 | 24 |
| S1P | -57 | -63 | -58 | -11 |
The percentage changes in SL concentrations (pmol/mg) after PDT treatment are compared to the controls. The controls include untreated and Pc 4-treated cells. The bold font denotes significant changes. The SL concentrations were log2 transformed. The difference between the average values for PDT and control groups were calculated and expressed as percentage change. T-test was used to compute nominal p-values for the difference between PDT and control groups. The resulting nominal p-values were adjusted to account for multiple testing. DHSph, DHsphingosine.
Figure 4.
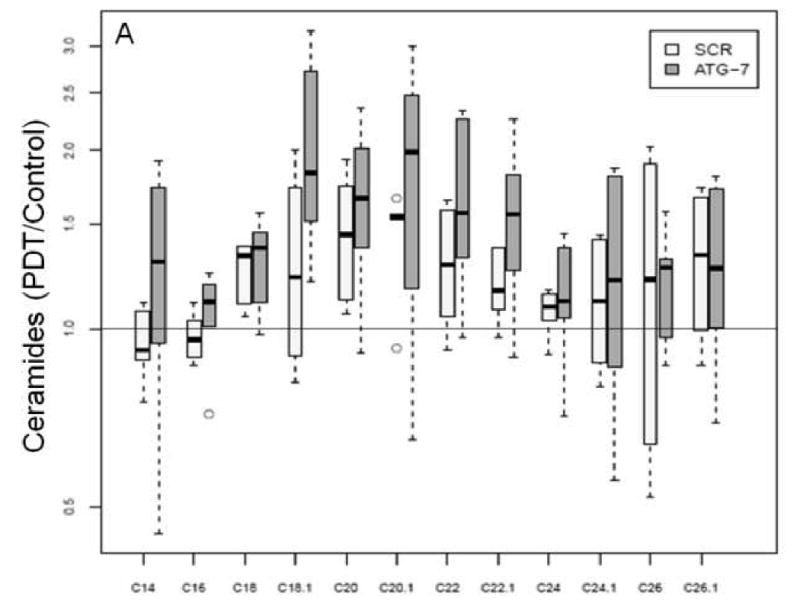
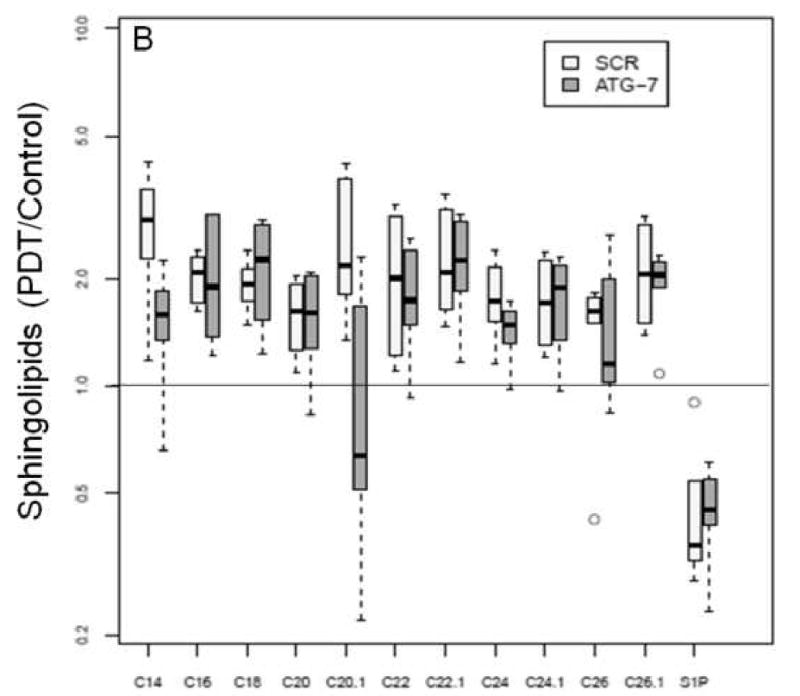
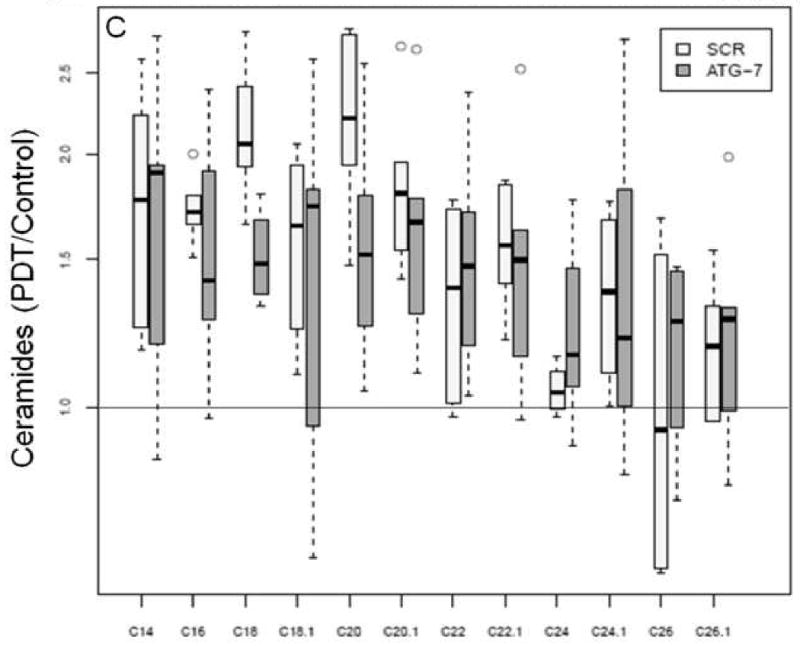
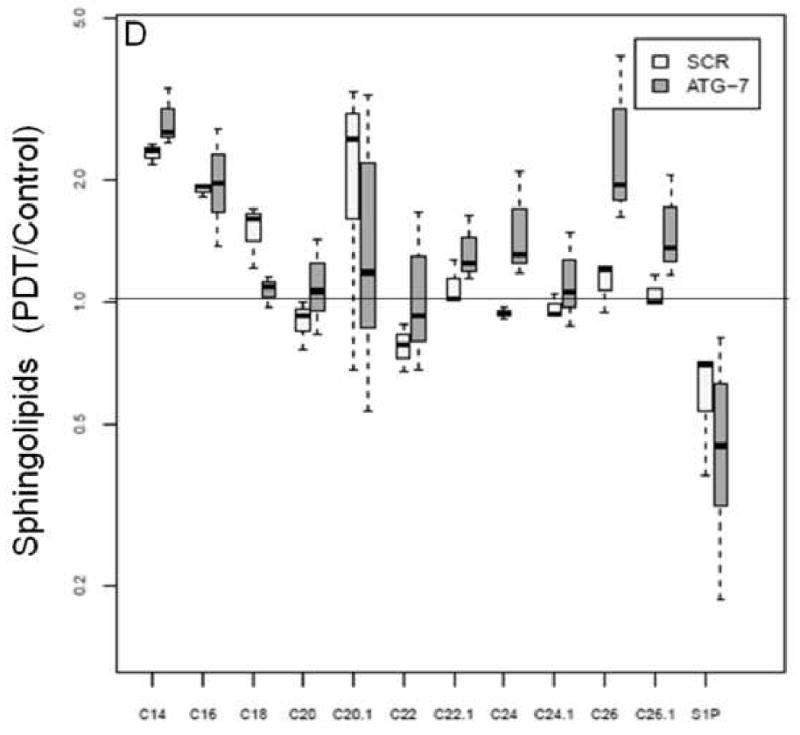
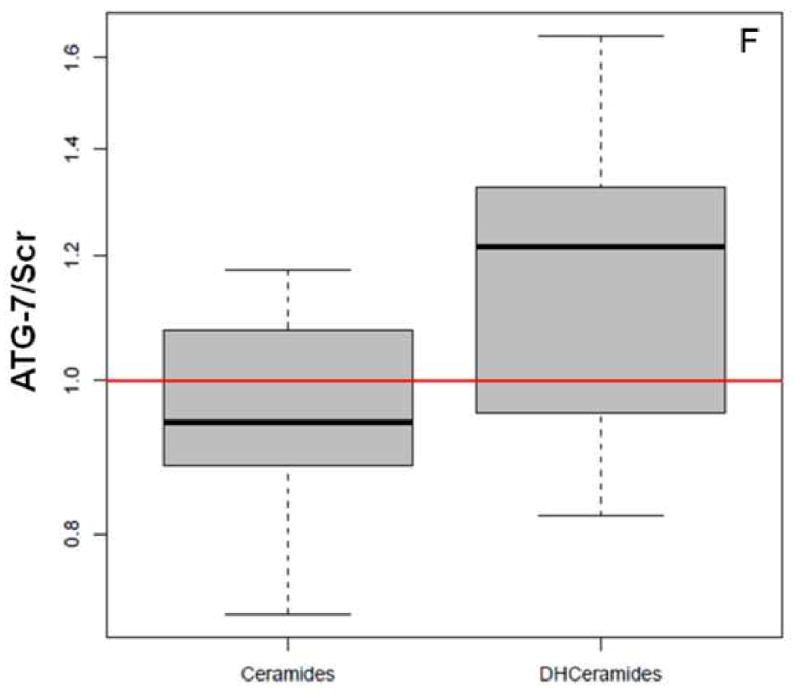
Global ceramide accumulation is enhanced in ATG-7 cells at 2 h post-PDT.
The levels of DHCeramides and S1P in two cell types at 2 h post-PDT.
The levels of ceramides in two cell types at 24 h past-PDT.
The levels of DHCeramides nad S1P in two cell types at 24 h post-PDT.
Global increase in ceramides in ATG-7 cells at 2 h post-PDT.
Changes in the levels of ceramides and DHCeramides in two cell types at 24 h post-PDT.
Mass spectrometric analysis reveals signature effects on the SL profile after PDT in the two cell types. Controls include untreated and Pc 4-treated cells. Cells were incubated overnight with Pc 4 (100 nM) prior to irradiation (400 mJ/cm2), incubated for 2 or 24 h, collected, and processed for MS. In the plots, for Y axis log scale is used. The boxes contain 50% of the data and the median value is shown as the horizontal thick line within the box. The whiskers extend to the most extreme data point (minimum and maximum value) which is no more than 1.5 times the interquartile range (i.e., remaining 50% of the data) from the box. Outliers are shown as empty circles. The horizontal line at a value of 1.0 indicates no change. (A and B) Show the ratios of PDT vs. controls for ceramides and DHceramides at 2 h, respectively. (C and D) Show the ratios of PDT vs. controls for ceramides and DHceramides at 24 h, respectively. Corresponding ceramide and DHceramide species are designated as C14, C16, etc. (E and F) Show the ratios of ATG-7 vs. Scr for all ceramides and DHceramides after PDT. The average ratio ATG-7/Scr at 2 h post-PDT is significantly different from 1 (p<0.004) and is indicated by an asterisk.
In both cell lines PDT triggered a substantial overall increase in DHceramides (Table 2). The levels of S1P and sphingosine were markedly decreased at 2 h post-PDT irrespective of cell type. Similarly, the levels of DHsphingosine, a metabolite from the de novo ceramide pathway, were reduced at 2 h in both cell lines (Table 2).
We have demonstrated that selective increase in ceramides and DHceramides correlates with apoptotic sensitization of Jurkat cells to PDT [11]. Here we show in PDT-treated ATG-7 knockdown cells that DHceramides, which were significantly increased (C22:1- and C26:1 DHceramide), comprise 17% of the total DHceramide mass. In Scr cells respective ceramide species that were significantly higher at 24 h post-PDT (Table 2, Supplementary Materials) represent 37% of the total ceramide mass. In the same cell type DHceramide species that were significantly higher represent 61 and 5% of the total ceramide mass at corresponding time points post-PDT (Table 2, Supplementary Materials). Overall, specific ceramides and DHceramides that were significantly increased after PDT do not necessarily represent a major mass fraction of respective SL species.
The present report indicates correlation between early rise in ceramide accumulation and sensitization to PDT in ATG-7-defective MCF-7cells. The levels of no other SL correlate with ATG-7 downregulation post-PDT. We have shown in other cell types that increased apoptotic sensitization to PDT correlates with increased de novo ceramide accumulation [11, 12, 15]. Because DHceramide levels are increased in breast cancer cells, it is likely that the de novo ceramide contributes to observed elevations in ceramide.
Changes in DHceramides suggest a role for ceramide synthases and DHceramide desaturase. Ceramide synthases have been implicated in breast cancer[16]. There are at least six genes encoding ceramide synthases, suggesting that ceramides with different fatty acyl chains have different biological roles [17]. A role for DHceramide and DHceramide desaturase in induced autophagy has been reported in cancer cells [18, 19]. However, the present report does not support correlation between DHceramide in ATG-7-defective breast cancer cells after PDT.
We observed lack of correlation between LC3 processing and ATG-7 knockdown at the given PDT dose. LC3 processing can occur in autophagic mutants that are unable to make autophagosomes [20]. Moreover, Nishida and colleagues have recently reported ATG-7-independent autophagy without LC3 processing [21]. Our data suggest ATG-7 independent LC3 processing after PDT.
The present data have two important implications: they further confirm our previous findings supporting the role for ceramide in sensitization of cells to PDT, and suggest that accumulation of ceramide could serve as a biomarker of ATG-7-deficiency in cells sensitized to PDT.
Supplementary Material
Acknowledgments
This work was supported by U.S. Public Health Service Grant R01 CA77475 from the National Cancer Institute, National Institutes of Health. We are indebted to Dr. David Kessel for helpful discussion.
Abbreviations
- DHceramide
dihydroceramide
- DHsphingosine
dihydrosphingosine
- PDT
photodynamic therapy
- Scr
scrambled
- SL
sphingolipid
- S1P
sphingosine-1-phosphate
Footnotes
Publisher's Disclaimer: This is a PDF file of an unedited manuscript that has been accepted for publication. As a service to our customers we are providing this early version of the manuscript. The manuscript will undergo copyediting, typesetting, and review of the resulting proof before it is published in its final citable form. Please note that during the production process errors may be discovered which could affect the content, and all legal disclaimers that apply to the journal pertain.
References
- 1.Kroemer G, Jaattela M. Nat Rev Cancer. 2005;5:886–897. doi: 10.1038/nrc1738. [DOI] [PubMed] [Google Scholar]
- 2.Kabeya Y, Mizushima N, Ueno T, Yamamoto A, Kirisako T, Noda T, Kominami E, Ohsumi Y, Yoshimori T. EMBO J. 2000;19:5720–5728. doi: 10.1093/emboj/19.21.5720. [DOI] [PMC free article] [PubMed] [Google Scholar]
- 3.Maiuri MC, Zalckvar E, Kimchi A, Kroemer G. Nat Rev Mol Cell Biol. 2007;8:741–752. doi: 10.1038/nrm2239. [DOI] [PubMed] [Google Scholar]
- 4.Abedin MJ, Wang D, McDonnell MA, Lehmann U, Kelekar A. Cell Death Differ. 2007;14:500–510. doi: 10.1038/sj.cdd.4402039. [DOI] [PubMed] [Google Scholar]
- 5.Cuenca RE, Allison RR, Sibata C, Downie GH. Ann Surg Oncol. 2004;11:322–327. doi: 10.1245/aso.2004.03.025. [DOI] [PubMed] [Google Scholar]
- 6.Kessel D, Reiners JJ., Jr Photochem Photobiol. 2007;83:1024–1028. doi: 10.1111/j.1751-1097.2007.00088.x. [DOI] [PMC free article] [PubMed] [Google Scholar]
- 7.Xue LY, Chiu SM, Azizuddin K, Joseph S, Oleinick NL. Photochem Photobiol. 2007;83:1016–1023. doi: 10.1111/j.1751-1097.2007.00159.x. [DOI] [PubMed] [Google Scholar]
- 8.Hanada K. Biochim Biophys Acta. 2003;1632:16–30. doi: 10.1016/s1388-1981(03)00059-3. [DOI] [PubMed] [Google Scholar]
- 9.Hannun YA, Luberto C, Argraves KM. Biochemistry. 2001;40:4893–4903. doi: 10.1021/bi002836k. [DOI] [PubMed] [Google Scholar]
- 10.Lavieu G, Scarlatti F, Sala G, Levade T, Ghidoni R, Botti J, Codogno P. Autophagy. 2007;3:45–47. doi: 10.4161/auto.3416. [DOI] [PubMed] [Google Scholar]
- 11.Separovic D, Semaan L, Tarca AL, Awad Maitah MY, Hanada K, Bielawski J, Villani M, Luberto C. Exp Cell Res. 2008;314:1860–1868. doi: 10.1016/j.yexcr.2008.02.008. [DOI] [PMC free article] [PubMed] [Google Scholar]
- 12.Dolgachev V, Farooqui MS, Kulaeva OI, Tainsky MA, Nagy B, Hanada K, Separovic D. J Biol Chem. 2004;279:23238–23249. doi: 10.1074/jbc.M311974200. [DOI] [PubMed] [Google Scholar]
- 13.Separovic D, Mann KJ, Oleinick NL. Photochem Photobiol. 1998;68:101–109. [PubMed] [Google Scholar]
- 14.Separovic D, Bielawski J, Pierce JS, Merchant S, Tarca AL, Ogretmen B, Korbelik M. Br J Cancer. 2009;100:626–632. doi: 10.1038/sj.bjc.6604896. [DOI] [PMC free article] [PubMed] [Google Scholar]
- 15.Dolgachev V, Oberley LW, Huang TT, Kraniak JM, Tainsky MA, Hanada K, Separovic D. Biochem Biophys Res Commun. 2005;332:411–417. doi: 10.1016/j.bbrc.2005.04.141. [DOI] [PubMed] [Google Scholar]
- 16.Ruckhaberle E, Rody A, Engels K, Gaetje R, von Minckwitz G, Schiffmann S, Grosch S, Geisslinger G, Holtrich U, Karn T, Kaufmann M. Breast Cancer Res Treat. 2008;112:41–52. doi: 10.1007/s10549-007-9836-9. [DOI] [PubMed] [Google Scholar]
- 17.Pewzner-Jung Y, Ben-Dor S, Futerman AH. J Biol Chem. 2006;281:25001–25005. doi: 10.1074/jbc.R600010200. [DOI] [PubMed] [Google Scholar]
- 18.Zheng W, Kollmeyer J, Symolon H, Momin A, Munter E, Wang E, Kelly S, Allegood JC, Liu Y, Peng Q, Ramaraju H, Sullards MC, Cabot M, Merrill AH., Jr Biochim Biophys Acta. 2006;1758:1864–1884. doi: 10.1016/j.bbamem.2006.08.009. [DOI] [PubMed] [Google Scholar]
- 19.Signorelli P, Munoz-Olaya JM, Gagliostro V, Casas J, Ghidoni R, Fabrias G. Cancer Lett. 2009;282:238–243. doi: 10.1016/j.canlet.2009.03.020. [DOI] [PubMed] [Google Scholar]
- 20.Stromhaug PE, Reggiori F, Guan J, Wang CW, Klionsky DJ. Mol Biol Cell. 2004;15:3553–3566. doi: 10.1091/mbc.E04-02-0147. [DOI] [PMC free article] [PubMed] [Google Scholar]
- 21.Nishida Y, Arakawa S, Fujitani K, Yamaguchi H, Mizuta T, Kanaseki T, Komatsu M, Otsu K, Tsujimoto Y, Shimizu S. Nature. 2009;461:654–658. doi: 10.1038/nature08455. [DOI] [PubMed] [Google Scholar]
Associated Data
This section collects any data citations, data availability statements, or supplementary materials included in this article.