

Abstract
The purpose of this study was to determine whether a mineral-rich extract derived from the red marine algae Lithothamnion calcareum could be used as a dietary supplement for prevention of bone mineral loss. Sixty C57BL/6 mice were divided into three groups based on diet: the first group received a high-fat Western-style diet (HFWD), the second group was fed the same HFWD along with the mineral-rich extract included as a dietary supplement, and the third group was used as a control and was fed a low-fat rodent chow diet (AIN76A). Mice were maintained on the respective diets for 15 months. Then, long bones (femora and tibiae) from both males and females were analyzed by three-dimensional micro-computed tomography (micro-CT) and (bones from female mice) concomitantly assessed in bone strength studies. Tartrate-resistant acid phosphatase (TRAP), osteocalcin, and N-terminal peptide of type I procollagen (PINP) were assessed in plasma samples obtained from female mice at the time of sacrifice. To summarize, female mice on the HFWD had reduced bone mineralization and reduced bone strength relative to female mice on the low-fat chow diet. The bone defects in female mice on the HFWD were overcome in the presence of the mineral-rich supplement. In fact, female mice receiving the mineral-rich supplement in the HFWD had better bone structure/function than did female mice on the low-fat chow diet. Female mice on the mineral-supplemented HFWD had higher plasma levels of TRAP than mice of the other groups. There were no differences in the other two markers. Male mice showed little diet-specific differences by micro-CT.
Keywords: Bone mineralization, Bone strength, Mineral-rich red algae extract, Aquamin, High-fat Western-style diet, Osteoporosis
Osteoporosis is a condition characterized by low bone mass, low bone mineral content, and microarchitectural deterioration, leading to enhanced bone fragility and consequent increase in risk of bone fracture [1]. Although in the Caucasian population of Western Europe and North America, men account for up to 30% of the osteoporotic hip fractures, osteoporosis is widely regarded as a condition primarily affecting postmenopausal women [2, 3]. Genetic factors underlie susceptibility, but environmental variables (e.g., tobacco use, excess alcohol and caffeine consumption, lack of physical activity, etc.) [4] have also been identified as having an impact.
Dietary factors are also important. In particular, diets that contain a large amount of fat, especially saturated fat [5-9], have been identified as risk factors for osteoporosis. Likewise, diets lacking an adequate supply of essential inorganic minerals, especially calcium (Ca2+), promote osteoporosis [10-12]. While Ca2+ is the most important cationic mineral in the bone, other cationic minerals that play roles in bone health include magnesium (Mg2+) [13-15] as well as manganese, copper, zinc, and selenium [16-23]. The diet consumed by many individuals in Europe and North America is high in saturated fat [24, 25]. The Western diet that is high in saturated fat also tends to be low in essential minerals [24, 25]. Many potentially important minerals are low in foods that are high in saturated fat [26]. In addition, a high content of saturated fat in the diet can interfere with mineral bioavailability through multiple mechanisms [27].
While the prevalence of osteoporosis in Western society is thought to reflect, at least in part, dietary influences, the exact mechanisms through which diet influences bone health are not fully understood. Furthermore, while an adequate supply of inorganic minerals is necessary for bone health, whether or not mineral supplementation of the diet can mitigate the consequences of other unhealthy nutritional or environmental factors is not known. With this in mind, we maintained a group of mice (females and males) on a chow formulation designed to mimic the typical high-fat Western-style diet (HFWD) [28-30] and concomitantly supplemented the diet of some of the animals with a multi-mineral-rich natural product. The HFWD was originally designed for use in colon polyp studies [28-30] but was subsequently shown to promote bone mineral loss and to reduce bone strength in mice [31, 32]. The mineral supplement used here was obtained from the red marine algae Lithothamniom calcareum [33]. Red marine algae, especially those of the coralline family, extract minerals from salt water and concentrate the minerals as carbonate salts in their fronds. The fronds of the red algae become so highly mineralized that they are essentially devoid of substances (phytols, agar, alginate, carageenan, etc.) common to many algae. The mineral-rich fronds have been utilized as a source of multiple trace elements in agriculture for years [34, 35]. The mineral-rich supplement employed in the present study is currently included in several products designed for human consumption (Marigot, Cork, Ireland). Recently, the same mineral-rich supplement was shown in a short-term clinical study to reduce pain during exercise (walking) in patients with osteoarthritis [36, 37]. Based on the known requirements for an adequate supply of minerals for bone health and on these recent studies, we hypothesized that the multi-mineral-rich supplement from the red marine algae would, in fact, mitigate the deleterious effects on bone structure and function resulting from consumption of a HFWD. The present report describes our effort to test this hypothesis.
Materials and Methods
Mineral-Rich Extract
The mineral-rich extract used in this study is a natural product obtained from the skeletal remains of the red marine algae L. calcareum (Pallas), also known as Phymatolithon calcareum (Pallas) [33]. The algae thrive in the cold Atlantic waters off the southwest coast of Ireland and the northwest coast of Iceland. Minerals from seawater are accumulated in the algae fronds over the life span of the organism. Eventually, the mineral-rich fronds break off of the living organism and fall to the ocean floor, from where they are harvested. The mineralized fronds are separated from extraneous materials, sterilized, dried, and milled under ISO and HACCP certification. The mineral extract contains 12% calcium, 1% magnesium, and measurable levels of 72 other trace minerals. The extract is sold as a food supplement under the name Aquamin® (GRAS 000028) and is used in various products for human consumption in Europe, Asia, Australia, and North America (Marigot). The mineral composition of the marine algae supplement is shown in Table 1.
Table 1.
Composition of the mineral-rich extract
| Element | μg/g | Element | μg/g | Element | μg/g |
|---|---|---|---|---|---|
| Aluminum | 291 | Hafnium | <0.03 | Rubidium | 1.95 |
| Antimony | 6.74 | Holmium | <0.05 | Ruthenium | 0.088 |
| Arsenic | <0.2 | Indium | 0.052 | Samarium | 0.529 |
| Barium | 64.2 | Iodine | 32.8 | Scandium | 0.041 |
| Beryllium | 0.306 | Iridium | <0.05 | Selenium | 0.672 |
| Bismuth | 0.081 | Iron | 915 | Silicon | 504 |
| Boron | 39.5 | Lanthanum | 0.372 | Silver | 0.250 |
| Bromine | 10.1 | Lead | 0.158 | Sodium | 4,150 |
| Cadmium | 0.070 | Lithium | 2.77 | Strontium | 1,810 |
| Calcium | 351,500 | Lutetium | 0.065 | Sulfur | 5,700 |
| Carbon | 122,000 | Magnesium | 25,800 | Tantalum | 0.060 |
| Cerium | 2.17 | Manganese | 57.5 | Tellurium | 0.048 |
| Cesium | 0.096 | Mercury | 0.008 | Terbium | 0.030 |
| Chloride | 910 | Molybdenum | 0.052 | Thallium | 0.088 |
| Chromium | 0.820 | Neodymium | 0.034 | Thorium | <0.02 |
| Cobalt | 0.082 | Nickel | 1.48 | Thulium | 0.061 |
| Copper | 4.89 | Niobium | 0.142 | Tin | 0.197 |
| Dysprosium | 0.078 | Osmium | <0.05 | Titanium | 27.8 |
| Erbium | 4.27 | Palladium | <0.01 | Tungsten | 0.188 |
| Europium | 0.051 | Phosphorus | 310 | Vanadium | 37.5 |
| Fluoride | 7.28 | Platinum | <0.01 | Ytterbium | 0.096 |
| Gadolinium | 0.109 | Potassium | 5,176 | Yttrium | 1.22 |
| Gallium | 2.48 | Praseodymium | 0.228 | Zinc | 15.8 |
| Germanium | 0.207 | Rhenium | <0.05 | Zirconium | 0.339 |
| Gold | <0.01 | Rhodium | <0.01 |
Source: 2008 Test Certificate for Aquamin®, by Advanced Laboratories (Salt Lake City, UT), for client Marigot (Ireland)
Diets
Three diets were used in this study: (1) the AIN76A rodent chow diet, (2) the HFWD, and (3) the same HFWD supplemented with the mineral-rich algae extract. AIN76A is a routinely used, low-fat rodent chow. It contains 5% fat from corn oil. The HFWD, which is derived from AIN76A, was specially prepared according to the formulation of Newmark et al. [28] and designed to mimic the diet consumed by many individuals in Western society. It contains 20% fat from corn oil. On a per weight basis, the percentage of calories from fat in this diet is 37.8% compared to 11.5% in the AIN76A chow diet. Although sucrose is reduced in the HFWD relative to the AIN76A control diet, the overall calories provided in the HFWD are 4,767 kcal% vs. 3,902 kcal% in the rodent chow. In addition to its high fat content, the HFWD has other modifications. Methionine is replaced with cysteine; amounts of fiber, folic acid, and choline are reduced; and, most importantly, the Ca2+ level is reduced to approximately 8% of the level in normal mouse chow. The HFWD supplemented with the mineralrich marine algae extract is similar to the unsupplemented HFWD except that the algae extract is included in the makeup (62 g%) to provide a comparable Ca2+ level to the amount provided in AIN76A. Diets were formulated and provided by Research Diets (New Brunswick, NJ). The composition of the three diets is presented in Table 2.
Table 2.
Diet compositions
| AIN76A |
HFWD |
HFWD + supplement |
||||
|---|---|---|---|---|---|---|
| g% | kcal% | g% | kcal% | g% | kcal% | |
| Protein | 20.3 | 20.8 | 24.4 | 20.5 | 22.9 | 20.5 |
| Carbohydrate | 66 | 67.7 | 48.5 | 41.8 | 45.7 | 41.8 |
| Fat | 5 | 11.5 | 20 | 37.8 | 18.8 | 37.8 |
| Total | 91.3 | 100 | 92.9 | 100 | 87.5 | 100 |
| kcal/g | 3.9 | 4.76 | 4.49 | |||
|
| ||||||
| Ingredients | g | kcal | g | kcal | g | kcal |
|
| ||||||
| Casein (80 mesh) | 200 | 800 | 240 | 960 | 240 | 960 |
| dl-Methionine | 3 | 12 | 0 | 0 | 0 | 0 |
| l-Cystine | 0 | 0 | 3.6 | 14 | 3.6 | 14 |
| Corn starch | 150 | 600 | 100 | 400 | 100 | 400 |
| Maltodextrin 10 | 0 | 0 | 75 | 300 | 75 | 300 |
| Sucrose | 500 | 2,000 | 310.418 | 1,242 | 310.418 | 1,242 |
| Cellulose (BW200) | 50 | 0 | 20 | 0 | 20 | 0 |
| Corn oil | 50 | 450 | 200 | 1,800 | 200 | 1,800 |
| Ethoxyquin | 0.01 | 0 | 0.01 | 0 | 0.01 | 0 |
| Mineral mix S10001a | 35 | 0 | 0 | 0 | 0 | 0 |
| Mineral mix S10001Ab | 0 | 0 | 21 | 0 | 21 | 0 |
| Monosodium phosphate | 0 | 0 | 7.98 | 0 | 7.98 | 0 |
| Monopotassium phosphate | 0 | 0 | 7.91 | 0 | 7.91 | 0 |
| Calcium carbonate | 0 | 0 | 0.88 | 0 | 0.88 | 0 |
| Red algae extract (12% calcium) | 0 | 0 | 0 | 0 | 62 | 0 |
| Vitamin mix V10001 | 10 | 40 | 0 | 0 | 0 | 0 |
| Vitamin mix V13202 | 0 | 0 | 12 | 48 | 12 | 48 |
| Choline bitartrate | 2 | 0 | 1.2 | 0 | 1.2 | 0 |
| Folic acid | 0 | 0 | 0.00023 | 0 | 0.00023 | 0 |
| Vitamin D3 (100,000 IU/g) | 0 | 0 | 0.0012 | 0 | 0.0012 | 0 |
| Total | 1,000.01 | 3,902 | 1,000.05 | 4,764.07 | 1,062.05 | 4,764.07 |
Mineral mix for control diet (per kg mineral mix): calcium phosphate dibasic 500 g, magnesium oxide 24 g, potassium citrate 220 g, potassium sulfate 52 g, sodium chloride 74 g, chromium potassium sulfate 0.55 g, cupric carbonate 0.30 g, potassium iodate 0.01 g, ferric citrate 6 g, manganous carbonate 3.50 g, sodium selenite 0.01 g, zinc carbonate 1.60 g, sucrose 118.03 g
Mineral mix for Western-style diet (per 0.5 kg mineral mix): magnesium oxide 24 g, potassium citrate 220 g, potassium sulfate 52 g, sodium chloride 74 g, chromium potassium sulfate 0.55 g, cupric carbonate 0.30 g, potassium iodate 0.01 g, ferric citrate 6 g, manganous carbonate 3.50 g, sodium selenite 0.01 g, zinc carbonate 1.60 g, sucrose 118.03 g
Treatment Protocol
Sixty C57BL/6 mice (30 male and 30 female) were divided into three groups and maintained for 15 months on the three diets. Food was provided ad libitum. Animals were monitored at weekly intervals throughout the maintenance phase and weighed monthly. Animals that survived for the 15-month period (as well as four animals that died during month 14) were included in the study. This study was reviewed and approved by the University Committee on Use and Care of Animals (UCUCA) at the University of Michigan. Animals that died prematurely were autopsied, but their long bones were not analyzed. The majority of such animals were killed (in accord with UCUCA guidelines) when they developed an ulcerative dermatitis that was unresponsive to topical antibiotic treatment. Additionally, one animal developed neurological symptoms and was killed, one animal had a liver tumor, and the cause of death was not apparent for two. Of the animals that were included in the bone analysis, there were nine males and eight females from the AIN76A group, seven males and four females from the HFWD group, and five males and 10 females from the mineral-supplemented HFWD group.
Preparation of Skeletal Tissue and Micro-Computer-Assisted Tomography
The left femora and left tibiae were carefully dissected free of associated connective tissue at the time of death. The bones were immediately placed in sealed containers with lactated Ringer’s solution and frozen at −20°C until use. The femora and tibiae were then 3D-imaged using a microcomputer-assisted tomography (micro-CT) system (eXplore Locus SP; GE Healthcare Pre-Clinical Imaging, London, Canada) as previously described and validated [38, 39]. Measurements were taken at an operating voltage of 80 kV and 80 mA of current, with an exposure time of 1,600 ms using the Parker scan technique, which rotates the sample 180 degrees plus a fan angle of 20 degrees. The effective voxel size of the reconstructed image was 18 × 18 × 18 μm3. Images were globally thresholded and used to measure the length of both long bones as well as to quantify parameters of bone density, geometry, and morphology.
Cortical regions of interest (ROIs) were selected within the mid-diaphysis of both the femur and tibia. Specifically, the femoral ROI was selected by locating the center point between the greater trochanter and the distal growth plate. A cylindrical ROI then was centered around that point, encompassing the entire cortical cross section, with the depth of the ROI being standardized to a percentage of the overall femur length (18%). The tibial cortical ROI was selected by locating the tibiofibular junction. A cylindrical ROI then was generated just proximal to that junction, encompassing the entire cortical cross section, with the depth of the ROI being standardized to a percentage of the overall tibia length (10%).
The femoral trabecular ROI was selected by using a spline function to manually select a 2D region (key frame contour) encompassing only the trabecular bone within the distal metaphysis. A key frame contour was selected on every 10 frames starting at the distal growth plate and continuing proximal until the ROI depth was reached. The ROI depth was standardized to a percentage of the overall femur length (10%). After completion of the key frame contour selections, additional contours were generated by interpolating contours between key frames. A 3D ROI was then generated from all the contours. The tibial trabecular ROI was selected by using a spline function to manually select a 2D region (key frame contour) encompassing only the trabecular bone within the proximal metaphysis. A key frame contour was selected on every 10 frames starting at the proximal growth plate and continuing distal until the ROI depth was reached. The ROI depth was standardized to a percentage of the overall tibial length (5%). After completion of the key frame contour selections, additional contours were generated by interpolating contours between key frames. A 3D ROI was then generated from all the contours.
The cortical ROIs were assessed both densitometrically (bone mineral content and tissue mineral density) and geometrically (mean thickness and cross-sectional area, bending moments of inertia, and endosteal and periosteal perimeters). The trabecular ROIs were assessed both densitometrically (bone mineral content and tissue mineral density) and morphologically (bone volume fraction, surface-to-volume ratio, and trabecular thickness, number, and spacing).
Biomechanical Testing
Whole-bone mechanical properties were determined by loading the left femora to failure in four-point bending, using a servohydraulic testing machine (858 Mini Bionix II; MTS Systems, Eden Prairie, MN) with a customized testing fixture at a constant displacement rate of 0.5 mm/s [40]. Femora were loaded in the anterior–posterior direction so that the posterior side of the bone was in tension and the anterior side was in compression. Load–displacement curves were analyzed using MATLAB software (version R2008b; Mathworks, Natick, MA) to determine yield load, failure load, stiffness, energy to failure, and displacement ratio. Yield load was defined as the elastic limit before which permanent deformation occurred as measured by the secant method (secant stiffness differed by 10% from the initial tangential stiffness). Failure load was the load at which the bone catastrophically failed. Stiffness was defined as the slope of the linear region of the preyield load–displacement curve. Energy to failure was determined with numerical integration as the area under the load–displacement curve up to the point at which the bone failed. A displacement ratio was calculated as the ratio of ultimate displacement to yield displacement to characterize the relative magnitudes of elastic and plastic deformation.
Tartrate-Resistant Acid Phosphatase, Osteocalcin, and N-Terminal Peptide of Type I Procollagen
Tartrate-resistant acid phosphatase (TRAP), osteocalcin, and N-terminal peptide of type I procollagen (PINP) were assessed in plasma samples using commercially available enzyme-linked immunosorbant assays (ELISAs). Immunodiagnostic Systems (Fountain Hills, AZ) was the source of assay kits for TRAP and PINP. Biomedical Technologies (Stoughton, MA) was the source for the osteocalcin kit. TRAP is produced by osteoclasts and macrophages in large amounts and accumulates in the blood. This assay procedure assesses TRAP 5b, which is the form specific to osteoclasts [41]. Recent studies suggest that TRAP 5b is a measure of osteoclast number rather than activity per se [42]. Osteocalcin and PINP are measures of osteoblast function. Osteocalcin, a major noncollagenous bone protein, is a measure of bone turnover [43]. Type I collagen is the major collagenous protein in bone [44].
Statistical Evaluation
Micro-CT analyses, biomechanical testing data, and data from biochemical assessments were reported as group means and standard deviations. Differences among the dietary groups for both females and males were evaluated statistically by ANOVA (six groups for micro-CT and females only for biomechanical and biochemical assessments), followed by paired group comparisons. Differences were considered significant at the P < 0.05 level.
Results
Micro-CT Analysis of Femora and Tibiae from Female Mice on the HFWD With or Without the Mineral-Rich Extract
Normal C57BL/6 mice were maintained for 15 months on a low-fat rodent chow diet or on the HFWD with or without the mineral-rich extract as a supplement. At the initiation of the study, all animals were 3–4 weeks of age and had an average weight of 16 ± 1 g. Over the 15-month period, animals gained weight on all three diets. At the end of the 15-month period, mice on the AIN76A (rodent chow) diet had an average weight of 40 ± 4 g. The weights of mice on the unsupplemented and supplemented HFWD were 50 ± 6 and 48 ± 7 g, respectively (both statistically different from chow diet weights at P < 0.01 but not statistically different from each other). Although male mice were heavier than female mice in all three groups, relative differences were seen with both males and females.
Surviving animals were killed at month 15, and femora and tibiae were analyzed by micro-CT. The quantitative results from female mice in this study are presented in Tables 3 and 4. Figure 1 presents 3D micro-CT images of the cortical and trabecular regions of a femur from a female mouse in each diet group. To summarize, by the end of the 15-month study, female mice on the HFWD had lost a significant amount of bone mineral compared to female mice on the low-fat (AIN76A) chow diet. In the cortical analysis there were reductions in bone mineral content, tissue mineral density, mean cortical thickness, and cortical cross-sectional area. This was observed in both femora and tibiae. In the trabecular analysis, female mice on the HFWD had lower bone mineral content, tissue mineral density, and bone volume fraction, due to decreases in both trabecular number and thickness.
Table 3.
Micro-CT analysis of cortical and trabecular regions of femora from female mice in the three diet groups
| AIN76A | HFWD | HFWD + supplement | |
|---|---|---|---|
| Cortical | |||
| Bone mineral content (mg) | 4.43 ± 0.35 | 3.77 ± 0.35 | 4.56 ± 0.39* |
| Tissue mineral density (mg/cc) | 1,140 ± 16 | 1,078 ± 27 | 1,162 ± 25** |
| Mean thickness (mm) | 0.196 ± 0.014 | 0.164 ± 0.020 | 0.210 ± 0.017** |
| Polar moment of inertia (mm4) | 0.173 ± 0.013 | 0.177 ± 0.025 | 0.190 ± 0.018 |
| Endosteal perimeter (mm) | 4.12 ± 0.11 | 4.49 ± 0.27 | 4.17 ± 0.10* |
| Periosteal perimeter (mm) | 5.30 ± 0.13 | 5.47 ± 0.15 | 5.40 ± 0.09 |
| Cross-sectional area (mm2) | 0.87 ± 0.06 | 0.78 ± 0.09 | 0.93 ± 0.07* |
| Bone length (mm) | 16.2 ± 0.2 | 15.8 ± 0.2 | 16.0 ± 0.3 |
| Trabecular | |||
| Bone mineral content (mg) | 0.56 ± 0.18 | 0.49 ± 0.06 | 0.59 ± 0.07* |
| Tissue mineral density (mg/cc) | 607 ± 46 | 627 ± 31 | 677 ± 33** |
| Bone volume fraction (mm3/mm3) | 0.04 ± 0.05 | 0.02 ± 0.01 | 0.06 ± 0.03* |
| Surface to volume ratio (mm2/mm3) | 57.11 ± 15.17 | 54.65 ± 6.94 | 42.76 ± 5.76** |
| Trabecular thickness (mm) | 0.037 ± 0.010 | 0.037 ± 0.010 | 0.047 ± 0.010** |
| Trabecular number (1/mm) | 0.52 ± 0.23 | 0.49 ± 0.19 | 1.18 ± 0.48** |
| Trabecular spacing (mm) | 1.91 ± 0.92 | 2.34 ± 1.28 | 0.98 ± 0.54** |
Each bone was subjected to micro-CT at two regions—cortical and trabecular. With each bone, eight cortical parameters and seven trabecular parameters were assessed. Values for each parameter are means and standard deviation. Statistical significance of each parameter was assessed by ANOVA followed by paired group comparisons (P < 0.05). Asterisks are placed with the HFWD + supplement group:
statistically significant improvement relative to the HFWD group
statistically significant improvement relative to both AIN76A and HFWD groups. Data are based on eight mice in the AIN76A diet group, four mice in the HFWD group, and 10 mice in the HFWD + supplement group
Table 4.
Micro-CT analysis of cortical and trabecular regions of tibiae from female mice in the three diet groups
| AIN76A | HFWD | HFWD + supplement | |
|---|---|---|---|
| Cortical | |||
| Bone mineral content (mg) | 1.62 ± 0.10 | 1.43 ± 0.11 | 1.62 ± 0.11* |
| Tissue mineral density (mg/cc) | 1,132 ± 19 | 1,095 ± 44 | 1,150 ± 19* |
| Mean thickness (mm) | 0.21 ± 0.02 | 0.18 ± 0.02 | 0.21 ± 0.01* |
| Polar moment of inertia (mm4) | 0.157 ± 0.023 | 0.137 ± 0.009 | 0.150 ± 0.143 |
| Endosteal perimeter (mm) | 2.52 ± 0.10 | 2.62 ± 0.22 | 2.44 ± 0.09 |
| Periosteal perimeter (mm) | 3.88 ± 0.14 | 3.79 ± 0.10 | 3.77 ± 0.11 |
| Cross-sectional area (mm2) | 0.62 ± 0.05 | 0.56 ± 0.05 | 0.62 ± 0.03* |
| Bone length (mm) | 17.9 ± 0.3 | 17.7 ± 0.2 | 17.9 ± 0.2 |
| Trabecular | |||
| Bone mineral content (mg) | 0.27 ± 0.06 | 0.22 ± 0.01 | 0.34 ± 0.05** |
| Tissue mineral density (mg/cc) | 644 ± 33 | 638 ± 49 | 669 ± 27 |
| Bone volume fraction (mm3/mm3) | 0.04 ± 0.02 | 0.03 ± 0.01 | 0.08 ± 0.02** |
| Surface to volume ratio (mm2/mm3) | 45.47 ± 4.13 | 47.86 ± 5.91 | 38.68 ± 3.39** |
| Trabecular thickness (mm) | 0.044 ± 0.004 | 0.042 ± 0.005 | 0.052 ± 0.005** |
| Trabecular number (1/mm) | 0.84 ± 0.43 | 0.67 ± 0.21 | 1.45 ± 0.30** |
| Trabecular spacing (mm) | 1.38 ± 0.61 | 1.54 ± 0.38 | 0.66 ± 0.15** |
Each bone was subjected to micro-CT at two regions—cortical and trabecular. With each bone, eight cortical parameters and seven trabecular parameters were assessed. Values for each parameter are means and standard deviation. Statistical significance of each parameter was assessed by ANOVA followed by paired group comparisons (P < 0.05). Asterisks are placed with the HFWD + supplement group:
statistically significant improvement relative to the HFWD group
statistically significant improvement relative to both AIN76A and HFWD groups. Data are based on eight mice in the AIN76A diet group, four mice in the HFWD group, and 10 mice in the HFWD + supplement group
Fig. 1.
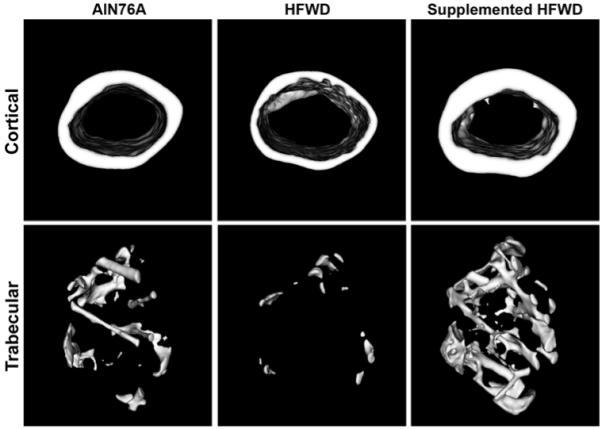
Micro-CT cross-sectional images through cortical (mid-diaphysis) and trabecular (distal metaphysis) ROIs of femora from female mice on three different diets. Differences in cortical thickness and in trabecular number, thickness, and space are evident
Female mice that received the mineral-rich extract as a supplement in the HFWD did not demonstrate bone mineral loss. Statistically significant differences between the HFWD and HFWD with the mineral supplement were seen with several parameters in both the cortical and trabecularregions of both tibiae and femora (Tables 3, 4, Fig. 1). Perhaps most surprising was that female animals on the HFWD with the mineral-rich extract had better bone structural properties than females on the low-fat (AIN76A) diet, even though the AIN76A animals had comparable Ca2+ levels. The most dramatic effects were seen in the trabecular region, where there was a large increase in trabecular number and thickness and a concomitant reduction in trabecular space in the mineral-supplemented HFWD animals relative to both other groups. Similar changes were observed in both femora and tibiae (Tables 3, 4).
Bone Strength Measurements (Female Mice)
Bone strength measurements were obtained by testing femora to failure in four-point bending. The results from these measurements in female mice are presented in Fig. 2, where it can be seen that yield load, failure load, and stiffness were all higher in the animals fed the high-fat diet with the mineral-rich supplement than in animals fed the same high-fat diet without the supplement. There was little difference in yield load and failure load between female mice on the low-fat chow diet and animals on the HFWD without the mineral-rich extract. Thus, the major difference was between animals on the HFWD with the supplement and animals in the other two groups. In addition to these differences, there were differences in stiffness. In regard to bone stiffness, female mice on the AIN76A were intermediary between female mice on the other two diets. Taken together, these data indicate that the mineral-rich extract not only overcame the consequences of the HFWD in female mice but preserved bone strength to a greater degree than did the low-fat chow diet.
Fig. 2.

Bone strength measurements from female mice in the three diet groups. Femora were tested to failure in four-point bending. Values for each parameter are means and standard deviations for females. Statistical significance of each parameter was assessed by ANOVA followed by paired group comparisons. Asterisks are placed on the HFWD + supplement group: * statistically significant improvement relative to the AIN76A group, ** statistically significant improvement relative to both AIN76A and HFWD (P < 0.05). Data are based on eight mice in the AIN76A diet group, four mice in the HFWD group, and 10 mice in the HFWD + supplement group
Finally, energy to failure and displacement ratio were also found to be greater in the animals fed the high-fat diet with the mineral-rich supplement than in animals on the low-fat diet or animals on the high-fat diet without the supplement. Of interest, however, both groups of animals on the high-fat diet (i.e., with or without the mineral-rich extract) required more energy to failure than animals on the low-fat diet. These latter results suggest that the high-fat diet increased the toughness of bone (with or without the mineral-rich supplement). However, without the mineral supplement, the increased toughness came at a significant price—reduced strength and stiffness, reflecting a decreased mineral to matrix ratio (see [45] for in-depth analysis of bone strength vs. toughness).
TRAP, Osteocalcin, and PINP (Female Mice)
TRAP, osteocalcin, and PINP were assessed in plasma samples using commercially available ELISAs. With osteocalcin and PINP, there were no significant differences among female mice of any diet group (Fig. 3). In contrast, TRAP levels were higher in female mice on the HFWD supplemented with the mineral-rich extract than in female mice from the other two diet groups (Fig. 3).
Fig. 3.

Osteocalcin, PINP, and TRAP levels in plasma from female mice in the three diet groups. Plasma levels of osteocalcin, PINP, and TRAP 5b were assessed by ELISA from animals killed at the end of the 15-month study. Statistical significance of each parameter was assessed by ANOVA followed by paired group comparisons. ** Statistically significant difference relative to both AIN76A and HFWD (P < 0.05). Data are based on eight mice in the AIN76A diet group, four mice in the HFWD group, and 10 mice in the HFWD + supplement group
Micro-CT Analysis of Femora and Tibiae from Male Mice on the HFWD With or Without the Mineral-Rich Extract
Femora and tibiae from male mice were analyzed by micro-CT in the same manner as done with bones from female mice. The quantitative results from male mice are presented in Tables 5 and 6. To summarize, when cortical bone data from male mice in the AIN76A control group were compared to cortical bone data from female mice in the same diet group, there was little difference in either femora or tibia. In contrast, there were differences between male mice and female mice in the trabecular region of both bones. In particular, there was a large increase in trabecular number in male mice compared to female mice, without a change in trabecular thickness. The increase in trabecular number without a change in thickness was reflected in differences in trabecular space. This was substantially reduced in both femora and tibiae of male mice relative to what was observed in the same bones from female mice (P < 0.01 between male and female mice on the AIN76A chow diet for both parameters; compare Tables 3 and 4 with Tables 5 and 6).
Table 5.
Micro-CT analysis of cortical and trabecular regions of femora from male mice in three diet groups
| AIN76A | HFWD | HFWD + supplement | |
|---|---|---|---|
| Cortical | |||
| Bone mineral content (mg) | 4.18 ± 0.20 | 4.35 ± 0.36 | 4.14 ± 0.37 |
| Tissue mineral density (mg/cc) | 1,110 ± 13 | 1,105.3 ± 17 | 1,119 ± 28 |
| Mean thickness (mm) | 0.187 ± 0.005 | 0.185 ± 0.008 | 0.183 ± 0.020 |
| Polar moment of inertia (mm4) | 0.144 ± 0.013 | 0.172 ± 0.026 | 0.164 ± 0.018 |
| Endosteal perimeter (mm) | 4.37 ± 0.19 | 4.60 ± 0.21 | 4.63 ± 0.12 |
| Periosteal perimeter (mm) | 5.61 ± 0.25 | 5.94 ± 0.23 | 5.80 ± 0.19 |
| Cross-sectional area (mm2) | 0.82 ± 0.03 | 0.87 ± 0.05 | 0.86 ± 0.09 |
| Bone length (mm) | 15.8 ± 0.2 | 15.4 ± 0.3 | 15.5 ± 0.2 |
| Trabecular | |||
| Bone mineral content (mg) | 0.59 ± 0.05 | 0.62 ± 0.07 | 0.59 ± 0.06 |
| Tissue mineral density (mg/cc) | 577 ± 80 | 574 ± 27 | 636 ± 26** |
| Bone volume fraction (mm3/mm3) | 0.05 ± 0.01 | 0.06 ± 0.01 | 0.06 ± 0.02 |
| Surface to volume ratio (mm2/mm3) | 56.06 ± 2.34 | 56.36 ± 7.69 | 48.83 ± 3.89 |
| Trabecular thickness (mm) | 0.035 ± 0.001 | 0.036 ± 0.005 | 0.041 ± 0.003 |
| Trabecular number (1/mm) | 1.49 ± 0.43 | 1.40 ± 0.34 | 1.45 ± 0.27 |
| Trabecular spacing (mm) | 0.69 ± 0.23 | 0.72 ± 0.20 | 0.67 ± 0.15 |
Each bone was subjected to micro-CT at two regions—cortical and trabecular. With each bone, eight cortical parameters and seven trabecular parameters were assessed. Values for each parameter are means and standard deviation. Statistical significance of each parameter was assessed by ANOVA followed by paired group comparisons (P < 0.05). Asterisks are placed with the HFWD + supplement group:
statistically significant improvement relative to both AIN76A and HFWD groups. Data are based on nine mice in the AIN76A diet group, seven mice in the HFWD group, and five mice in the HFWD + supplement group
Table 6.
Micro-CT analysis of cortical and trabecular regions of tibiae from male mice in the three diet groups
| AIN76A | HFWD | HFWD + supplement | |
|---|---|---|---|
| Cortical | |||
| Bone mineral content (mg) | 1.52 ± 0.05 | 1.45 ± 0.22 | 1.57 ± 0.18 |
| Tissue mineral density (mg/cc) | 1,107 ± 22 | 1,091 ± 46 | 1,135 ± 47 |
| Mean thickness (mm) | 0.198 ± 0.008 | 0.191 ± 0.020 | 0.190 ± 0.022 |
| Polar moment of inertia (mm4) | 0.138 ± 0.009 | 0.141 ± 0.025 | 0.152 ± 0.015 |
| Endosteal perimeter (mm) | 2.51 ± 0.09 | 2.54 ± 0.13 | 2.59 ± 0.14 |
| Periosteal perimeter (mm) | 3.91 ± 0.20 | 3.79 ± 0.13 | 3.96 ± 0.23 |
| Cross-sectional area (mm2) | 0.58 ± 0.03 | 0.58 ± 0.08 | 0.60 ± 0.06 |
| Bone length (mm) | 17.8 ± 0.1 | 17.6 ± 0.2 | 17.7 ± 0.2 |
| Trabecular | |||
| Bone mineral content (mg) | 0.28 ± 0.02 | 0.30 ± 0.03 | 0.32 ± 0.03 |
| Tissue mineral density (mg/cc) | 569 ± 14 | 579 ± 40 | 600 ± 31 |
| Bone volume fraction (mm3/mm3) | 0.06 ± 0.01 | 0.07 ± 0.01 | 0.07 ± 0.01 |
| Surface to volume ratio (mm2/mm3) | 52.54 ± 3.18 | 49.85 ± 4.80 | 51.11 ± 3.98 |
| Trabecular thickness (mm) | 0.038 ± 0.002 | 0.040 ± 0.004 | 0.039 ± 0.003 |
| Trabecular number (1/mm) | 1.67 ± 0.34 | 1.71 ± 0.32 | 1.69 ± 0.31 |
| Trabecular spacing (mm) | 0.58 ± 0.11 | 0.56 ± 0.12 | 0.56 ± 0.10 |
Each bone was subjected to micro-CT at two regions—cortical and trabecular. With each bone, eight cortical parameters and seven trabecular parameters were assessed. Values for each parameter are means and standard deviation. Statistical significance of each parameter was assessed by ANOVA followed by paired group comparisons (P < 0.05). Data are based on nine mice in the AIN76A diet group, seven mice in the HFWD group, and five mice in the HFWD + supplement group
When male mice in the different diet groups were compared to one another, minimal diet-specific differences were observed (Tables 5, 6). In particular, the diet-specific alterations in trabecular thickness, number, and space that were prominent in female mice were not observed in their male counterparts.
Discussion
This report describes a study in which C57BL/6 mice were maintained for 15 months on a high–saturated fat, low-Ca2+ diet with and without a dietary supplement consisting of a multi-mineral-rich marine algae extract. The high-fat diet was formulated to mimic the diet consumed by many individuals in Western countries [24, 25]. The HFWD was originally utilized in studies related to colon polyp formation [28-30], but subsequent work showed that bone mineral loss occurred in mice maintained on a similar dietary regimen [31, 32]. Consistent with these past findings, our study showed that female mice maintained on the HFWD experienced bone mineral loss and decreased bone strength compared to mice maintained over the same time period on a low-fat rodent chow (AIN76A) diet. These deleterious consequences were completely mitigated in female mice that received the mineral-rich supplement in the HFWD. In fact, mice on the HFWD with the mineral-rich supplement had increased mineral content and increased bone strength compared to control mice on the standard, low-fat rodent chow diet. This was in spite of the fact that the low-fat diet and the mineral-supplemented HFWD had comparable Ca2+ levels. The implication of these findings is that while Ca2+ may be the most important cationic mineral, other constituents of the multimineral supplement also appear to play important roles in overcoming the deleterious effects of the HFWD on bone structure and function.
In this study, separate cohorts of male and female mice were included in each diet group. When cortical and trabecular bone parameters were compared in male vs. female mice on the control rodent chow (AIN76A) diet, there was little gender difference in cortical parameters. There were differences, however, in trabecular parameters. Specifically, male mice had a higher average value for trabecular number than did female mice and, correspondingly, a smaller value for trabecular space. In neither of these two parameters, nor in virtually any of the other cortical or trabecular parameters assessed, were there significant dietspecific differences in males. This was very different with female mice. As noted above, detrimental effects of the HFWD were observed in several parameters in both regions of the bone. Concomitantly, protective effects of the mineral-rich supplement were seen in female mice. The basis for these striking, gender-specific differences is not understood. In Caucasian populations, males account for 20–30% of osteoporotic bone fractures [3, 46], but bone mineral loss and fractures tend to occur at more advanced age. The exception to this is in prostate cancer patients, where bone loss is a consequence of hormone-ablation therapy. A reasonable hypothesis is that the precipitous loss of estrogen in women at menopause and the slow decline in testosterone with advancing age in men is largely responsible for (or, at least, contributes to) the time-dependent differences in onset of bone loss and sensitivity to osteoporotic fractures. In male mice, testosterone levels may remain high through 20–24 months in individual animals, while estrogens are essentially gone from female mice by 16 months [47]. Our study (15 months) may simply not have lasted long enough to see age-related bone changes in the male cohort. The fact that there were trends in certain of the parameters (especially tissue mineral density) among male mice is supportive of this suggestion. Additional, longer-term studies will be required to address this issue definitively.
At this point, we do not know which of the multiple minerals present in the supplement contribute to the effects noted or the mechanisms by which they act to preserve bone structure and function in female mice. Additional experiments will be necessary to address both issues. At this point, it seems prudent not to speculate beyond noting that many of the individual components in the multi-mineral-rich dietary product are likely to directly impact bone structure and function [1, 10]. Alternatively, the beneficial effects on bone may be secondary to other, more global effects of the mineral-rich supplement. An attractive (alternative) hypothesis involves a role for the mineral-rich supplement in control of systemic inflammation. Chronic systemic inflammation is well accepted as a risk factor in bone mineral loss [48-50]. We hypothesize that in the high-fat, low-Ca2+ diet, epithelial differentiation in the gastrointestinal tract is impaired, leading to a defective or “leaky” barrier, with a higher level of proinflammatory moieties (bacteria, bacterial toxins, food allergens, etc.) continually “leaching” into the tissues [51]. The mineral-rich extract may retard inflammation by supporting epithelial differentiation in the gastrointestinal tract. Of relevance to this, we recently demonstrated that the mineral-rich algae extract promoted colonic epithelial cell differentiation in vitro [52]. In our study, epithelial cells that were resistant to Ca2+-mediated differentiation, as well as cells that were fully sensitive to the growth- and differentiation-regulating effects of Ca2+, were used. The mineral extract was effective in suppressing growth and inducing differentiation in both populations.
Mechanisms aside, it is important to ask whether the mineral-rich marine algae extract could be used routinely in humans as a dietary supplement under conditions needed for maintenance of bone structure/function. Based on the positive results generated in the present study, it would appear worthwhile to undertake a long-term comprehensive prospective study in human volunteers. Ultimately, only such studies can determine whether or not the mineral mix will have sufficient efficacy without toxicity to warrant development. The algae extract is already available as a food supplement under the name Aquamin (GRAS 000028) and is currently used in various products for human consumption in Europe, Asia, Australia, and North America. The mineral-rich supplement has recently been examined in a small, short-term clinical study [36, 37]. There is no reason why further development of this material for bone health should not be considered.
Acknowledgement
This study was supported in part by Grant CA140760 from the U.S. Public Health Service. We thank Marigot (Cork, Ireland) as the source of the mineral-rich algae extract.
Footnotes
The authors have stated that they have no conflict of interest.
Contributor Information
Muhammad Nadeem Aslam, Department of Pathology, University of Michigan Medical School, 1301 Catherine Street, SPC 5602, Ann Arbor, MI 48109, USA.
Jaclynn M. Kreider, Department of Orthopedic Surgery, The University of Michigan, Ann Arbor, MI 48109, USA
Tejaswi Paruchuri, Department of Pathology, University of Michigan Medical School, 1301 Catherine Street, SPC 5602, Ann Arbor, MI 48109, USA.
Narasimharao Bhagavathula, Department of Pathology, University of Michigan Medical School, 1301 Catherine Street, SPC 5602, Ann Arbor, MI 48109, USA.
Marissa DaSilva, Department of Pathology, University of Michigan Medical School, 1301 Catherine Street, SPC 5602, Ann Arbor, MI 48109, USA.
Ronald F. Zernicke, Department of Orthopedic Surgery, The University of Michigan, Ann Arbor, MI 48109, USA
Steven A. Goldstein, Department of Orthopedic Surgery, The University of Michigan, Ann Arbor, MI 48109, USA
James Varani, Department of Pathology, University of Michigan Medical School, 1301 Catherine Street, SPC 5602, Ann Arbor, MI 48109, USA.
References
- 1.Prentice A. Diet, nutrition and the prevention of osteoporosis. Public Health Nutr. 2004;7:227–243. doi: 10.1079/phn2003590. [DOI] [PubMed] [Google Scholar]
- 2.Iskrant AP. The etiology of fractured hips in females. Am J Public Health. 1968;58:485–490. doi: 10.2105/ajph.58.3.485. [DOI] [PMC free article] [PubMed] [Google Scholar]
- 3.De Laet CE, Van Hout BA, Burger H. Hip fracture prediction in elderly men and women: validation in the Rotterdam study. J Bone Miner Res. 1998;13:1587–1593. doi: 10.1359/jbmr.1998.13.10.1587. [DOI] [PubMed] [Google Scholar]
- 4.Prentice A. Is nutrition important in osteoporosis? Proc Nutr Soc. 1997;56:357–367. doi: 10.1079/pns19970038. [DOI] [PubMed] [Google Scholar]
- 5.Zernicke RF, Salem GJ, Barnard RJ, Schramm E. Longterm high-fat sucrose diet alters rat femoral neck and vertebral morphology, bone mineral content and mechanical properties. Bone. 1995;16:25–31. doi: 10.1016/s8756-3282(00)80007-1. [DOI] [PubMed] [Google Scholar]
- 6.Atteh JO, Leeson S. Effects of dietary saturated or unsaturated fatty acids and calcium levels on performance and mineral metabolism of broiler chicks. Poult Sci. 1984;63:2252–2260. doi: 10.3382/ps.0632252. [DOI] [PubMed] [Google Scholar]
- 7.Li K-C, Zernicke RF, Barnard RJ, F-Y Li A. Effects of a high fat-sucrose diet on cortical bone morphology and biomechanics. Calcif Tissue Int. 1990;47:308–313. doi: 10.1007/BF02555914. [DOI] [PubMed] [Google Scholar]
- 8.Wohl GR, Locehrke L, Watkins BA, Zernicke RF. Effects of high-fat diet on mature bone mineral content, structure and mechanical properties. Calcif Tissue Int. 1998;63:74–79. doi: 10.1007/s002239900492. [DOI] [PubMed] [Google Scholar]
- 9.Parhami F, Tintut Y, Beamer WG, Gharavi N, Goodman W, Demer LL. Atherogenic high-fat diet reduces bone mineralization in mice. J Bone Miner Res. 2001;16:182–188. doi: 10.1359/jbmr.2001.16.1.182. [DOI] [PubMed] [Google Scholar]
- 10.Prentice A. What are the dietary requirements for calcium and vitamin D? Calcif Tissue Int. 2002;70:83–88. doi: 10.1007/s00223-001-0035-0. [DOI] [PubMed] [Google Scholar]
- 11.Dibba B, Prentice A, Cecasay M, Stirling DM, Cole TJ, Poskitt EME. Effect of calcium supplementation on bone mineral accretion in Gambian children accustomed to a low calcium diet. Am J Clin Nutr. 2000;71:544–549. doi: 10.1093/ajcn/71.2.544. [DOI] [PubMed] [Google Scholar]
- 12.Peacock M, Liu G, Carey M. Effect of a calcium or 25OHD vitamin D3 dietary supplementation on bone loss at the hip in men and women over the age of 60. Clin Endocrinol Metab. 2000;85:3011–3019. doi: 10.1210/jcem.85.9.6836. [DOI] [PubMed] [Google Scholar]
- 13.Royal College of Physicians . Osteoporosis. Clinical guidelines for prevention and treatment. Royal College of Physicians of London; London: 1999. [PMC free article] [PubMed] [Google Scholar]
- 14.Toba Y, Kajita Y, Masuyama R, Takada Y, Suzuki K, Aoe S. Dietary magnesium supplementation affects bone metabolism and dynamic strength of bone on ovariectomized rats. J Nutr. 2000;130:216–220. doi: 10.1093/jn/130.2.216. [DOI] [PubMed] [Google Scholar]
- 15.Rude RK, Gruber HE. Magnesium deficiency and osteoporosis: animal and human observations [review] J Nutr Biochem. 2004;15:710–716. doi: 10.1016/j.jnutbio.2004.08.001. [DOI] [PubMed] [Google Scholar]
- 16.Odabasi E, Turan M, Aydin A, Akay C, Kutlu M. Magnesium, zinc, copper, manganese and selenium levels in post-menopausal women with osteoporosis: can magnesium play a key role in osteoporosis. Ann Acad Med Singapore. 2008;37:564–567. [PubMed] [Google Scholar]
- 17.Lowe MN, Fraser WD, Jackson J. Is there potential therapeutic value of copper and zinc for osteoporosis? Proc Nutr Soc. 2002;61:181–185. doi: 10.1079/PNS2002154. [DOI] [PubMed] [Google Scholar]
- 18.Opsahl W, Zeronian H, Ellison M, Lewis D, Rucker RB, Riggins RS. Role of copper in collagen cross-linking and its influence on selected mechanical properties of chick bone and tendon. J Nutr. 1982;112:708–716. doi: 10.1093/jn/112.4.708. [DOI] [PubMed] [Google Scholar]
- 19.Strause LG, Hegenauer J, Saltman P, Cone R, Resnick D. Effects of long-term dietary manganese and copper deficiency on rat skeleton. J Nutr. 1986;116:135–141. doi: 10.1093/jn/116.1.135. [DOI] [PubMed] [Google Scholar]
- 20.Hyun TH, Barret-Connor J, Milne DB. Zinc intakes and plasm concentrations in men with osteoporosis: the Rancho Bernardo Study. Am J Clin Nutr. 2004;80:715–721. doi: 10.1093/ajcn/80.3.715. [DOI] [PubMed] [Google Scholar]
- 21.Chariot P, Bignani O. Skeletal muscle disorders associated with selenium deficiency in humans. Muscle Nerve. 2003;27:662–668. doi: 10.1002/mus.10304. [DOI] [PubMed] [Google Scholar]
- 22.Turan B, Can B, Delibasi E. Selenium combined with vitamin E and vitamin C restores structural alterations of bones in heparin-induced osteoporosis. Clin Rheumatol. 2003;22:432–436. doi: 10.1007/s10067-003-0809-z. [DOI] [PubMed] [Google Scholar]
- 23.Stause I, Saltman P, Smith KT, Bracker M, Andon MD. Spinal bone loss in post-menopausal women supplemented with calcium and trace metals. J Nutr. 1994;124:1060–1064. doi: 10.1093/jn/124.7.1060. [DOI] [PubMed] [Google Scholar]
- 24.Lipkin M, Reddy B, Newmark HL, Lamprecht SA. Dietary factors in human colorectal cancer. Annu Rev Nutr. 1999;19:545–586. doi: 10.1146/annurev.nutr.19.1.545. [DOI] [PubMed] [Google Scholar]
- 25.Reddy BS, De Witt S. Goodman lecture. Novel approaches to he prevention of colon cancer by nutritional manipulation and chemoprevention. Cancer Epidemiol Biomarkers Prev. 2000;9:239–247. [PubMed] [Google Scholar]
- 26.Ilich JZ, Kerstetter JE. Nutrition in bone health revisited: a story beyond calcium [review] J Am Coll Nutr. 2000;19:715–737. doi: 10.1080/07315724.2000.10718070. [DOI] [PubMed] [Google Scholar]
- 27.New SA, Robins SP, Campbell MK, Martin JC, Garton MJ, Boulton-Smith C, Grubb DA, Lee SJ, Reid DM. Dietary influences on bone mass and bone metabolism: further evidence of a positive link between fruit and vegetable consumption and bone health? Am J Clin Nutr. 2000;71:142–151. doi: 10.1093/ajcn/71.1.142. [DOI] [PubMed] [Google Scholar]
- 28.Newmark HL, Yang K, Lipkin M, Kopelovich L, Liu Y, Fan K, Shinozaki H. A Western-style diet induces benign and malignant neoplasms in the colon of normal C57BL/6 mice. Carcinogenesis. 2001;22:1871–1875. doi: 10.1093/carcin/22.11.1871. [DOI] [PubMed] [Google Scholar]
- 29.Yang K, Kurihara N, Fan K, Newmark H, Rigas B, Bancroft L, Corner G, Livote E, Lesser M, Edelmann W, Velcich A, Lipkin M, Augenlicht L. Dietary induction of colonic tumors in a mouse model of sporadic colon cancer. Cancer Res. 2008;68:7803–7810. doi: 10.1158/0008-5472.CAN-08-1209. [DOI] [PubMed] [Google Scholar]
- 30.Newmark H, Yang K, Kurihara N, Fan K, Augenlicht L, Lipkin M. Western-style diet-induced colonic tumors and their modulation by calcium and vitamin D in C57bl/6 mice: a preclinical model for human sporadic colon cancer. Carcinogenesis. 2009;30:88–92. doi: 10.1093/carcin/bgn229. [DOI] [PMC free article] [PubMed] [Google Scholar]
- 31.Ward WE, Kim S, Bruce WR. A Western-style diet reduces bone mass and biomechanical bone strength to a greater degree in male compared with female rats during development. Br J Nutr. 2003;90:589–595. doi: 10.1079/bjn2003952. [DOI] [PubMed] [Google Scholar]
- 32.Demigne C, Bloch-Faure M, Picard N, Sabboh H, Besson C, Remesy C, Geoffroy V, Gaston A-T, Nicoletti A, Hagege A, Menard J, Meneton P. Mice chronically fed a Westernized experimental diet as a model of obesity, metabolic syndrome and osteoporosis. Eur J Nutr. 2006;45:298–306. doi: 10.1007/s00394-006-0599-6. [DOI] [PubMed] [Google Scholar]
- 33.Adey WH, McKibbin DL. Studies on the maerl species Phymatolithon calcareum (Pallas) nov. comb. and Lithothamnium corallioides Crouan in the Ria de Vigo. Bot Marina. 1970;13:100–106. [Google Scholar]
- 34.Blunden G. Agricultural uses of seaweeds and seaweed extracts. In: Guiry MD, Blunden G, editors. Seaweed resources in Europe: uses and potential. John Wiley & Sons; Chichester: 1991. pp. 65–81. [Google Scholar]
- 35.Blunden G, Binns WW, Perks F. Commercial collection and utilisation of maerl. Econ Bot. 1975;29:140–145. [Google Scholar]
- 36.Frestedt JL, Walsh M, Kuskowski MA, Zenk JL. A natural mineral supplement provides relief from knee osteoarthritis symptoms: a randomized controlled pilot trial. Nutr J. 2008;7:9. doi: 10.1186/1475-2891-7-9. [DOI] [PMC free article] [PubMed] [Google Scholar]
- 37.Frestedt JL, Kuskowski MA, Zenk JL. A natural seaweed derived mineral supplement (aquamin F) for knee arthritis: a randomized, placebo controlled pilot study. Nutr J. 2009;8:7. doi: 10.1186/1475-2891-8-7. [DOI] [PMC free article] [PubMed] [Google Scholar]
- 38.Taylor DK, Meganck JA, Terkhorn S, Rajani R, Naik A, O’Keefe RJ, Goldstein SA, Hankenson KD. Thrombospondin-2 influences the proportion of cartilage and bone during fracture healing. J Bone Miner Res. 2009;24:1043–1054. doi: 10.1359/jbmr.090101. [DOI] [PMC free article] [PubMed] [Google Scholar]
- 39.Meganck JA, Kozloff KM, Thornton MM, Broski SM, Goldstein SA. Beam hardening artifacts in micro-computed tomography scanning can be reduced by X-ray beam filtration and the resulting images can be used to accurately measure BMD. Bone. 2009;45:1104–1106. doi: 10.1016/j.bone.2009.07.078. [DOI] [PMC free article] [PubMed] [Google Scholar]
- 40.Salem GJ. Adaptations of immature trabecular bone to moderate exercise: geometrical, biochemical, and biomechanical correlates. Bone. 1993;14:647–654. doi: 10.1016/8756-3282(93)90087-q. [DOI] [PubMed] [Google Scholar]
- 41.Hannon RA, Clowes JA, Eagleton AC, Al Hadari AA, Eastell R, Blumsohn A. Clinical performance of immunoreactive tartrate resistant acid phosphatase isoform 5b as a marker of bone resorption. Bone. 2004;34:187–194. doi: 10.1016/j.bone.2003.04.002. [DOI] [PubMed] [Google Scholar]
- 42.Alatalo SL, Halleen JM, Hentunen TA, Monkkonen J, Vaananen JH. Rapid screening method for osteoclast differentiation in vitro that measures tartrate-resistant acid phosphatase 5b activity secreted into the culture medium. Clin Chem. 2000;46:1751–1754. [PubMed] [Google Scholar]
- 43.Hauschka PV, Lian JB, Cole DEC, Gundberg CM. Osteocalcin and matrix Gla protein: vitamin K–dependent proteins in bone. Physiol Rev. 1989;69:990–1047. doi: 10.1152/physrev.1989.69.3.990. [DOI] [PubMed] [Google Scholar]
- 44.Risteli J, Risteli L. Products of bone collagen metabolism. In: Seibel MJ, Robins SP, Bilezikian JP, editors. Dynamics of bone and cartilage metabolism: principles and clinical applications. 2nd edn. Academic Press; London: 2006. pp. 391–405. [Google Scholar]
- 45.Ritchie RO, Koester KJ, Ionova S, Yao W, Lane NE, Ager JW., III Measurement of the toughness of bone: a tutorial with special reference to small animal studies. Bone. 2008;43:798–812. doi: 10.1016/j.bone.2008.04.027. [DOI] [PMC free article] [PubMed] [Google Scholar]
- 46.Bilezikian JP. Osteoporosis in men. J Clin Endocrinol Metab. 1999;84:3431–3434. doi: 10.1210/jcem.84.10.6060. [DOI] [PubMed] [Google Scholar]
- 47.vom Saal FS, Finch CE, Nelson JF. Natural history and mechanisms of reproduction aging in humans, laboratory rodents and other selected species. In: Knobil E, Neill JD, editors. Physiology of reproduction. 2nd edn. Raven Press; New York: 1994. pp. 1215–1314. [Google Scholar]
- 48.Cashman KD. Altered bone metabolism in inflammatory disease: role for nutrition. Proc Nutr Soc. 2008;67:196–205. doi: 10.1017/S0029665108007039. [DOI] [PubMed] [Google Scholar]
- 49.Hardy R, Cooper MS. Bone loss in inflammatory disorders. J Endocrinol. 2009;201:309–320. doi: 10.1677/JOE-08-0568. [DOI] [PubMed] [Google Scholar]
- 50.Jur T, Mertz M, Aoki K, Horie D, Ohya K, Gautam A, Mouritsen S, Oda H, Nakamura K, Tanaka S. A novel therapeutic vaccine approach, targeting RANKL, prevents bone destruction and bone-related disorders. J Bone Miner Metab. 2002;20:266–268. doi: 10.1007/s007740200038. [DOI] [PubMed] [Google Scholar]
- 51.Clayburgh DR, Shen L, Turner JR. A porous defense: the leaky epithelial barrier in intestinal disease. Lab Invest. 2004;84:282–291. doi: 10.1038/labinvest.3700050. [DOI] [PubMed] [Google Scholar]
- 52.Aslam MN, Bhagavathula N, Chakrabarty S, Varani J. Growth-inhibitory effects of aquamin, a mineralized extract from the red algae, Lithothamnion calcerum, on Ca2+-sensitive and Ca2+-resistant human colon carcinoma cells. Cancer Lett. 2009;283:186–192. doi: 10.1016/j.canlet.2009.03.037. [DOI] [PMC free article] [PubMed] [Google Scholar]