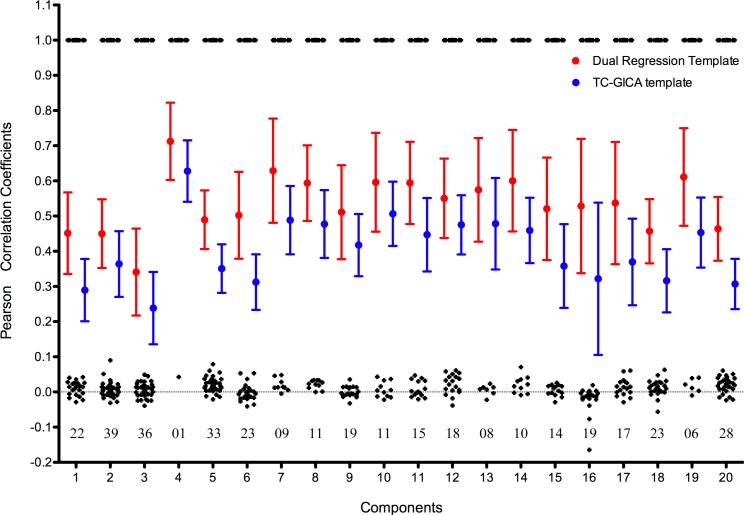
Figure 6. Individual Best Matching Scores As a Reproducibility Measure.
This figure depicts the individual reproducibility measurements for each group-level component (IC). All individual best matching scores are depicted as an error bar graph for each group-level component. Two template strategies were adopted for calculating the individual best matching scores: individual dual-regression derived templates (red) and group-level temporal concatenation group ICA (TC-GICA) derived templates (blue). Meanwhile, for each group-level IC, the consistency of matched results between the two template strategies is calculated as the spatial correlation coefficient (black) between individual dual-regression matched results and individual TC-GICA matched results. The numbers below these black points (i.e., around the line y = 0) represent the number of disagreements between the two template matching strategies.

