

Abstract
Copy number variants (CNVs) within humans can have both adaptive and deleterious effects. Because of their phenotypic significance, researchers have attempted to find single nucleotide polymorphisms (SNPs) in high linkage disequilibrium (LD) with CNVs to use in genomewide association studies. However, studies have found that CNVs are less likely to be in strong LD with flanking markers. We hypothesized that this “taggability gap” can be explained by duplication events that place paralogous sequences far apart. In support of our hypothesis, we find that duplications are significantly less likely than deletions to have a “tag” SNP, even after controlling for CNV length, allele frequency, and availability of appropriate flanking SNPs. Using a novel likelihood method, we are able to show that many complex CNVs—those due to multiple duplication or deletion polymorphisms—are made up of two loci with little LD between them. Additionally, we find that many polymorphic duplications detected in a recent clone-based study are located far from their parental loci. We also examine two other common hypotheses for the taggability gap, and find that recurrent mutation of both deletions and duplications appears to have an effect on LD, but that lower SNP density around CNVs has no effect. Overall, our results suggest that a substantial fraction of CNVs caused by duplication cannot be tagged by markers flanking the parental locus because they have changed genomic location.
Keywords: copy number variation, population genetics, association studies
Introduction
Recent surveys of genomic structural variation have revealed copy number variants (CNVs) among individuals in many species, including humans and flies (Sebat et al. 2004; Tuzun et al. 2005; Dopman and Hartl 2007; Emerson et al. 2008). In humans, CNVs have been linked to both advantageous (e.g., Perry et al. 2007; Xue et al. 2008) and deleterious (e.g., Lupski et al. 1991; Cook and Scherer 2008) phenotypes. Because of their phenotypic significance, an important problem in genomewide association studies is how well we will able to tag common CNVs using single nucleotide polymorphisms (SNPs) in linkage disequilibrium (LD) with them (Conrad and Hurles 2007). However, multiple studies (Locke et al. 2006; Redon et al. 2006; McCarroll et al. 2008) have found a “taggability gap” for common CNVs—fewer of these loci are in strong LD (r2 > 0.8) with flanking markers than are frequency-matched SNPs. The two most often proposed explanations offered for this gap are reduced SNP density around CNVs and recurrent mutation, which results in alleles being present on different SNP backgrounds (Redon et al. 2006; McCarroll et al. 2008). However, no convincing evidence that either of these explanations contribute to the taggability gap has been presented.
Here we examine these hypotheses along with a third explanation that relies on the conflation of two very different mutational sources underlying CNVs: namely duplications and deletions. Given the nature of the array-based genotyping platform used by most studies of CNVs, the locations of deletions (relative to the reference genome) are known exactly—they occur at the same map location as the probes used on the array. However, duplications (relative to the reference genome) do not necessarily have to occur at the same location as the probes that detect them—they can lie anywhere in the genome of the sample. Newly duplicated regions that are inserted far from the location of the probes used to detect them will fail to be tagged by SNPs flanking the “parental” locus (Redon et al. 2006).
There is a large body of evidence showing that a significant proportion of duplications found in the human genome are nontandem (Bailey et al. 2002; She et al. 2004; Cheng et al. 2005; She et al. 2006; Jiang et al. 2007). She et al. (2006) estimate that 55% of recent human duplications longer than 1 kilobase (kb) are more than 1 megabase (Mb) apart or on different chromosomes, while McGrath et al. (2009) find an approximately equal proportion of recent human gene duplicates at similar distances. There are multiple mutational mechanisms responsible for placing duplicated sequences far away from the parental (source) locus, including retrotransposition, nonallelic homologous recombination (NAHR), and nonhomologous end joining (reviewed in Paques and Haber 1999). Because duplications present in the reference assembly and CNVs are likely to share the same mutational mechanisms, and indeed many duplications in the reference are polymorphic (Redon et al. 2006; Conrad and Hurles 2007), there is no reason to believe that CNVs are not commonly transposed to new locations as well.
Although the hypothesis that the taggability gap is explained by transposing duplicates was mentioned in Redon et al. (2006), these authors cited the study of Woodward et al. (2005) as evidence against nontandem duplications. However, this study dealt only with a single locus already known to be a site of tandem duplication (Woodward et al. 1998), so it is of little use in inferring the proportion of polymorphic duplications that are arranged in tandem. Therefore, in this paper we thoroughly examine the hypothesis that the taggability gap between CNVs and SNPs occurs largely because of reduced LD at CNVs caused by transposing duplication events. We present three main analyses that all support this hypothesis, two based on CNV data from microarrays (McCarroll et al. 2008) and one based on data obtained by deep paired-end sequencing of fosmid clones (Kidd et al. 2008). Both of these methods are biased to some extent in that they do not detect all the CNVs in the genome: arrays do not have as many SNPs in highly repetitive regions, and clone-based methods cannot accurately estimate distances in poorly assembled regions. But we show that even if we are missing over half of all CNVs, and these undetected CNVs do not follow the trends we observe, our results still support a general conclusion on the causes of the taggability gap. We also conduct analyses to assess the effects that recurrent mutation or lower SNP density might have and find that recurrence appears to make a modest contribution to the taggability gap, but that low SNP density makes no contribution at all.
Materials and Methods
CNV Data Sets
Three hundred ninety-four biallelic, autosomal CNVs from the McCarroll data set (referred to as “CNPs” in that paper; those found in figure 3 panels c and d of McCarroll et al. 2008) were included in our analyses. CNVs inferred to be duplications relative to the reference had apparent copy numbers of 2, 3, and 4, whereas those inferred to be deletions relative to the reference had copy numbers of 0, 1, and 2 (supplementary fig. S1a, Supplementary Material online). Thirty “complex” CNVs from the McCarroll data set (figure 3 panels e and f of McCarroll et al. 2008) were also examined (see below). SNP genotypes and positions were downloaded from the HapMap Phase II data set (www.hapmap.org). The sequenced inserts from Kidd et al. (2008) were obtained from J.M. Kidd and E. Eichler.
PHASE 2.1 (Stephens and Donnelly 2003) was run on each of the 394 biallelic CNVs separately for each of the four HapMap populations, along with 25 SNPs upstream and 25 SNPs downstream from the same individuals, to determine their haplotypic phase. In cases where there were fewer than 25 SNPs available on one side of the CNV, more SNPs were included on the other side to bring the total to 50. For duplications, individuals with copy numbers of 2, 3, and 4 were assigned the genotypes −/−, −/+, and +/+, respectively. For deletions, these same genotypes were assigned to copy numbers 0, 1, and 2, respectively. The chromosomal positions of the SNPs and CNVs were ignored and default parameters were used. Before phasing and all subsequent analyses, children from family trios present in the HapMap samples were discarded.
Size- and Density-Matched Data Sets of Duplications and Deletions
To construct a subset of the McCarroll et al. (2008), deletions with a length distribution matching that of the duplications, a histogram of duplication lengths was calculated, with bins for increments of 10 kb ranging from 10 kb to 200 kb. Deletions were then binned in the same fashion. For each of these bins, one deletion was randomly selected for each of the duplication in the corresponding duplication bin for a total of 50 deletions. In the few cases where there were bins with fewer deletions than duplications, an extra deletion was taken from the bin corresponding to the next longest range of lengths. The number of duplications in the resulting set with at least one tag SNP (r2 > 0.8) in at least one population was then counted. One thousand such random sets were generated and the average number of deletions with at least one tag SNP in at least one population in these sets was 35.1 of 50. A similar approach was used to make SNP density-matched data sets for duplications and deletions.
Inferring LD at Complex CNVs
In addition to two-allele duplications and deletions, McCarroll et al. (2008) detected a number of “complex CNVs,” or CNVs with more than three distinct copy numbers (i.e., 0, 1, 2, 3, and 4 or 2, 3, 4, 5, and 6; supplementary material fig. S1b and c, Supplementary Material online). Unlike simple duplications and deletions, these complex CNVs likely have two variant loci (see Results and Discussion). Because we can only observe gross copy numbers for diploid individuals, and not exact genotypes, we used maximum likelihood to estimate the marginal allele frequencies at each of the two constituent loci, denoted φ1 and φ2, and the coefficient of disequilibrium, D, between them. Given presence and absence alleles at each of the two variant loci making up a complex CNV, there are four possible haplotypes with frequencies p00, p01, p10, and p11 (where p00 represents the case of two absence alleles on the same chromosome and p11 represents the case of two presence alleles on the same chromosome). Haplotype frequencies are therefore defined as:
 |
(1) |
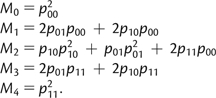
Multiple combinations of haplotypes in a single genotype can underlie the same copy number phenotype; for example, the genotypes p00/p11 and p10/p10 will both give an individual with copy number 2. Assuming Hardy–Weinberg equilibrium, the frequency of each of the observed copy number phenotypes, Mi (where i can take on values 0, 1, 2, 3, or 4), are therefore related to haplotype frequencies by the following set of equations:
 |
(2) |
Finally, the likelihood of each set of assignments for φ1, φ2, and D, is given by:
| (3) |
where ni is the observed number of individuals with i copies at a complex CNV in a given population and Mi is the expected frequency of individuals with i copies calculated from φ1, φ2, and D.
To find the maximum likelihood values for all parameters, allele frequencies between 0 and 1 (inclusive) were generated for all increments of 0.01 for both variant loci. For each generated combination of allele frequencies, the range of values of D was given by the maximum and minimum products of marginal allele frequencies (Lewontin 1964). Since this range can be quite small, depending on the allele frequencies, increments of 0.001 were used. The likelihood was calculated for each assignment of φ1, φ2, and D for each complex CNV in each population to determine the most likely value of D′ (calculated from φ1, φ2, and D). However, many combinations of parameters yielded the same expected values of Mi and were consequently given the same likelihood. Therefore, we took the average value of D′ of all of the combinations of φ1, φ2, and D sharing the highest likelihood score. The likelihood of this value of D′ was then calculated under two different models via simulation: one with perfect LD and one with no LD.
When simulating populations of individuals with complex CNVs under the no-LD model, the two loci in a complex CNV were treated as separate polymorphisms with independent allele frequencies φ1 and φ2 (supplementary material fig. S1c, Supplementary Material online). Given a pair of allele frequencies, the genotype frequencies of each gamete were then generated according to equation (1), with D constrained to be 0. Copy number frequencies were then generated according to equation (2). These copy number frequencies were then multiplied by 60 to create populations with 60 individuals—the same size of the Yoruban adult population in the McCarroll et al. (2008) set of complex CNVs. A population was generated for each pair of φ1 and φ2 such that both allele frequencies were multiples of 0.05 between 0.05 and 0.95.
In the perfect-LD model, both loci in the complex CNV were assumed to always be arranged perfectly in tandem whenever both were present in the same gamete, similar to a microsatellite with two alleles: one copy or two copies (supplementary material fig. S1b, Supplementary Material online). These simulations were carried out by treating the two copies as separate variants with presence/absence alleles and perfect LD between the two variants, such that the only possible haplotypes are: 0 copies (denoted 00), 1 copy (10), and two tandem copies (11). Gamete frequencies for these multiallelic complex CNVs were generated from allele frequencies φ1 and φ2 according to the following equations:
 |
Again, populations of 60 individuals were simulated for all pairs of allele frequencies φ1 and φ2 between 0.05 and 0.95 constraining each to be a multiple of 0.05. For each simulation under each model, the likelihood of all combinations of φ1, φ2, and D was calculated in the same manner as for the real data: the average value of D′ of all combinations sharing the highest likelihood given the simulated copy numbers was calculated.
To classify a complex CNV in the observed data as either being from the no-LD or perfect-LD model, the average D′ value given by all φ1, φ2, and D combinations sharing the highest likelihood score given the observed copy numbers was calculated. The likelihood of this average D′ value was evaluated under the two simulated data sets. The likelihood of a D′ value under the perfect-LD model was given by the area under the curve of the perfect-LD average D′ distribution to the left of that value of D′ (supplementary material fig. S2, Supplementary Material online). Similarly, the likelihood of a D′ value under the no-LD model was given by the area under the curve of the no-LD average D′ distribution to the right of that value of D′.
Simulating Recurrent Mutation at Complex CNVs
In the perfect-LD model described in the previous section, the complex CNV behaves like a microsatellite with three different alleles. The problem of generating such a population with recurrent mutation is identical to that of generating one without recurrence, then adding mutations by performing the following replacements as desired: replacing a 11 with a 10 (recurrent deletion), replacing a 10 with a 11 (recurrent duplication), or replacing a 10 with a 00 (recurrent deletion); note that 00→10 mutations are not considered as a new stretch of DNA would have to be inserted. We performed these replacements to generate populations with recurrent mutations at complex CNVs and constrained the allele frequencies of the two copies to be the same as for the simulations described in the previous section. However, the resulting populations were identical to those generated in the simulations based on the perfect-LD model described in the previous section for all allele frequency pairs, regardless of the rate of recurrence (i.e., the number of replacements).
Blast Analysis
The sequences of 84 high-confidence insertions detected by fosmid end-sequence mapping in Kidd et al. (2008) were Blasted against NCBI build 36 of the human genome. For each query, high-scoring pairs within 100 bp of each other were merged into one hit. The maximum length of these merged hits and the highest percent identity of the hits were then recorded. For a given insert query, all hits that were at least two-thirds the length of the longest hit or within 2.5% of the maximum percent identity were considered to be possible parental loci of the duplication. The closest of these hits was then considered to be the parental locus, and the distance between the closest hit and the coordinates of the insertion reported in Kidd et al. (2008), which were converted to NCBI build 36 coordinates by liftOver on the UCSC Genome Browser (http://genome.ucsc.edu/; Karolchik et al. 2008), was then calculated.
Simulating Error in Deletion Genotyping
Genotyping errors were introduced into our set of deletions for error rate increments of 1%. For a given error rate and deletion polymorphism, the appropriate number individuals were randomly selected from each population for genotyping errors. If the selected individual was inferred by McCarroll et al. (2008) to have two copies or zero copies, this was changed to one, if the individual had one copy, this was randomly changed to a two or a zero with equal probability. After these errors were introduced, LD was recalculated and the number of deletions with a tag SNP in at least one population was counted. This process was repeated using increasing error rates until deletions with simulated errors were not significantly more likely to have tag SNPs than duplications with no simulated errors.
Inferring State of Chimpanzee Genome
For a random subset the biallelic McCarroll CNVs (86 deletions and 12 duplications), the chimpanzee genome was examined to infer the ancestral state of the CNV. For duplications, this was done by doing a Blast search of the CNV against assembly version 2.1 of the chimpanzee genome. Duplications found to have no more than one copy in the chimpanzee genome were inferred to be true duplications, rather than deletions present in the reference. For deletions, the human–chimpanzee genomic alignment of the CNV region was obtained from ENSEMBL (Hubbard et al. 2009) and used to determine if the sequence was present in the chimpanzee genome. If the deleted sequence was found to be mostly present in the chimpanzee genome, the deletion was inferred to be a true deletion in humans rather than duplication present in the human reference genome.
Results and Discussion
Duplications are Less Likely to Have a Tag SNP Than Are Deletions
We collected genotype data for 394 common, biallelic CNVs with simple inheritance patterns from the data set presented in McCarroll et al. (2008), as well as 25 flanking SNPs both upstream and downstream of the probes used to detect each CNV from the same HapMap samples. The CNVs were separated into deletions (n = 344) and duplications (n = 50) based on hybridization intensities, with copy numbers of 0, 1, and 2 for deletions and 2, 3, and 4 for duplications (supplementary material fig. S1a, Supplementary Material online; McCarroll et al. 2008). We constructed haplotypes for each locus for each population separately using the program PHASE v2.1 (Stephens and Donnelly 2003). If duplications do not lie near their parental locus, then the haplotypic phase of these genotypes should be more uncertain than for deletions. This is in fact what we find across populations, with PHASE inferring a greater proportion of duplicates with ambiguous placement onto haplotypes than deletions [P = 0.004, Fisher’s exact test (FET)]. When we further ask about the maximum r2 values found between the flanking SNPs and the CNVs, we find a significant paucity of duplications with tagging SNPs having r2 > 0.8 in any population (P = 1.05 × 10⁻⁸,FET). Nearly 65% of all deletions have a SNP tagging them with r2 > 0.8, whereas only 24% of duplications do (Table 1).
Table 1.
Presence of Flanking SNPs in Linkage Disequilibrium With Duplications and Deletions.
| SNP with r2> 0.8 | No SNP with r2> 0.8 | |
| Duplications | 12 | 38 |
| Deletions | 231 | 113 |
Differences in population allele frequencies between duplications and deletions (Locke et al. 2006; Redon et al. 2006) could lead to differences in levels of LD without any difference in the genomic position of each. To control for this possibility, we made frequency-matched comparisons of r2 for duplications and deletions (fig. 1); the difference in LD between duplications and deletions across frequency bins was highly significant (P < 2 × 10⁻²⁶, analysis of variance). These results demonstrate that there is a general trend for duplications to show lower LD with SNPs flanking the probes used to detect them than there is for deletions.
FIG. 1.

LD properties of different types of CNVs. Taggability of common CNVs due to deletions (circles) and duplications (triangles) expressed as the mean of the maximum correlations (r2) to a flanking SNP for all CNVs in a frequency bin. The dashed line shows the taggability of the closest 3′ SNP flanking each deletion. Bins correspond to 0–0.1, 0.1–0.2, 0.2–0.3, 0.3–0.4, and 0.4–0.5, and average values across all HapMap populations are shown.
Duplications relative to a reference genome detected by hybridization to an array may in fact be deletions that are present in the reference genome. Similarly, deletions relative to a reference may in fact be duplications present in the reference (supplementary material fig. S3, Supplementary Material online). However, because the location of probes used to detect CNVs are based on the reference genome, finding a tag SNP is only dependent on whether CNVs are duplications or deletions relative to the reference genome, and not their evolutionary origin. For example, even if an apparent deletion relative to the reference is really a derived duplication found only in the individuals used to assemble the reference genome, the newly duplicated sequence is included in the assembly and therefore can have probes located at the actual location that it is inserted into (supplementary material fig. S3, Supplementary Material online). Nevertheless, to ensure that the trend we observe in duplications and deletions relative to a reference was also present in evolutionary duplications and deletions, we inferred the ancestral states of a random subset of our CNVs by examining the state of the chimpanzee genome (see Materials and Methods). In total, we determined the ancestral states of approximately one quarter of our data set. Eleven of the 12 duplications relative to the reference were confirmed to be duplications absent in the chimpanzee genome, and 78 of 86 deletions relative to the reference were in fact derived deletions. We then determined which of these 11 duplications and 78 deletions had at least one tag SNP, and found that the trend of lower LD around duplications was still present and significant despite the much smaller data set tested (P = 0.014, FET).
LD Within Complex CNVs
As a second independent test of our hypothesis, we examined 30 so-called “complex” CNVs (loci with more than three distinct copy numbers; McCarroll et al. 2008). In our data set, these loci have copy numbers of either 0, 1, 2, 3, and 4, or 2, 3, 4, 5, and 6. These types of CNVs are sometimes referred to as “multiallelic” in the literature (Conrad and Hurles 2007; McCarroll et al. 2008), where they are thought to act like a microsatellite locus with either 0, 1, or 2 tandem repeats present on any single chromosome (supplementary material fig. S1b, Supplementary Material online). Alternatively, these cases could be due to two paralogous loci each segregating presence and absence alleles, at any distance apart (supplementary material fig. S1c, Supplementary Material online). In either case, every complex CNV is made up two loci, of which either can show the presence or absence of a stretch of DNA. This makes it possible to directly assess LD between the two loci, and allows us to ask whether they are closely linked or not. If the complex CNV is made up of two tandem loci, essentially behaving like a single multiallelic locus, the LD between the two should be quite high. If the two loci are far apart on the same chromosome or even on different chromosomes, the LD should be quite low.
To estimate levels of LD, we found the maximum likelihood values of the marginal allele frequencies at the two loci and the LD coefficient between them (see Materials and Methods). To ensure that this method can accurately identify loci with very high and very low levels of LD, we simulated data sets with combinations of allele frequencies at the two constituent loci between 0.05 and 0.95. Because multiple combinations of parameters give the same maximum likelihood, we used the average D′ of the maximum likelihood combinations for each locus as a measure of LD. Our simulation results (supplementary material fig. S2, Supplementary Material online) show that there is good separation between a model with no LD and a model with complete LD, and therefore that we can classify individual loci as one or the other (or having an intermediate level of LD).
The likelihood of each complex CNV in our data set was calculated under both models (see Materials and Methods). In total, 18 CNVs had higher likelihoods under the perfect-LD model, whereas 12 were more likely under the no-LD model. However, many more of these CNVs fit the perfect-LD model with 95% confidence than the no-LD model (13 vs. 3). These results show that relatively few CNVs have zero LD between copies, but they also seem to show that many do not appear to have very high LD between copies either. These results suggest that some complex CNVs are arranged perfectly in tandem, whereas others have duplicate loci that are separated enough to reduce LD between them but not to eliminate it completely, and only a few are far enough apart to result in no LD at all.
Recurrent mutation is often postulated as an explanation for lower LD around CNVs (see “Alternative Hypotheses” below) as it results in derived alleles being present on multiple SNP backgrounds. Because our analysis above deals only with LD between the polymorphic duplicate loci and not with nearby SNPs, it is unlikely that recurrence could explain the lower LD within complex CNVs. Nevertheless, we simulated populations with complex CNVs exhibiting recurrent tandem mutations, but constrained to have the same marginal allele frequencies (see Materials and Methods). As expected, recurrent mutation has no effect on levels of LD between the two constituent loci (data not shown; see Materials and Methods). This supports our conclusion that low LD within complex CNVs is evidence of transposing duplications.
Clone-based Mapping of CNVs
As a third independent way to demonstrate the possible effects of transposing duplicates on the taggability gap, we looked at the genomic source of duplications identified using a clone-based mapping approach (Tuzun et al. 2005; Kidd et al. 2008). In this method, genomic DNA from a sample individual is used to create a fosmid clone library. The two ends of the inserts in these clones are then sequenced and mapped to the reference genome. The length of the region of the reference genome assembly spanned by the clone is then compared with the expected fosmid insert length. Spanned regions of the reference significantly smaller than the expected insert size are inferred to be the locations of insertions in the sample individual (relative to the reference genome), whereas larger than expected regions of the reference genome spanned by the paired ends are inferred to be the locations of deletions in the sample individual (relative to the reference). One should note that this method offers an alternative to standard array-based approaches because the actual location of the insertion is identified rather than increased hybridization signal at the location of the parental DNA. Although this method is not without its own biases, it allows one to search the human genome for the source of the insertion sequences to determine exactly how far duplicated loci have traveled.
For 84 high-confidence insertion events (those covered by two or more clones) sequenced by the study of Kidd et al. (2008), we were able to determine the source of the parental DNA by finding the best Blast hit of the clone’s insert (with mapped ends removed); we conservatively consider the nearest locus to be the source when multiple regions of the genome were highly similar to the insert. We found that at least three of the polymorphic duplications are on different chromosomes than their parental loci and that at least 39 of all 81 duplications on the same chromosome as their parent are more than 50 kb away, where LD is expected to be significantly reduced (Reich et al. 2001). After removing duplications largely composed of transposable elements, we still found that approximately one-third of the duplicated sequences were greater than 50 kb away from their parental locus and about one-fifth were over 1 Mb away (supplementary material table S1, Supplementary Material online). These results are consistent with multiple studies of paralogous genes and loci found in the human genome reference sequence (Jiang et al. 2007; Han and Hahn 2009) and show that newly duplicated sequences can occur far from the loci they are copied from. The results also support our hypothesis that a substantial fraction of CNVs caused by duplication cannot be tagged by SNPs flanking the parental locus because they have changed genomic location.
Unfortunately, not enough individuals have yet had clone-based maps constructed so that we can calculate LD between the “parent” and “daughter” duplicates. In addition, we did not find any overlap between the CNVs detected in the array-based and clone-based data sets considered here. Further analysis of LD among duplicates known to lie in distant genomic regions will therefore have to wait for larger data sets.
Alternative Hypotheses
As mentioned in the Introduction, there have been several other hypotheses proposed to explain the CNV taggability gap, including recurrent mutation and lower SNP density in regions surrounding CNVs. We consider these two hypotheses in turn as well several additional possible explanations for our results.
One commonly proposed mechanism for the lower taggability of CNVs is that they are subject to higher rates of recurrent mutation than are SNPs (Locke et al. 2006; Redon et al. 2006; McCarroll et al. 2008). To explain our results, however, there must be higher rates of recurrent mutation for duplications than deletions. From a mechanistic perspective such a difference between duplications and deletions seems unlikely: nonallelic crossing-over between sister chromatids or between homologous chromosomes always results in one chromosome with duplicated sequence and one with deleted sequence, whereas nonallelic crossing-over within the same chromatid only results in deletions (Turner et al. 2008). The only mechanism that results solely in duplicated sequence (retrotransposition) is more likely than not to place paralogous sequences on different chromosomes. Very few studies have quantified rates of recurrence in CNVs in an unbiased manner, and those that have done this have actually found that there were more recurrent deletions than duplications (Egan et al. 2007; Turner et al. 2008). Egan et al. (2007) found that 59% of large deletions (13/22) were recurrent, whereas only 45% (9/20) of large duplications were. Turner et al. (2008) examined four loci known to undergo frequent NAHR events and also found that recurrent deletions were more common than recurrent duplications. Despite the small number of loci examined in these studies, their findings clearly show that there is no preference for recurrent duplications over recurrent deletions.
It is possible that CNVs of different lengths have different likelihoods of recurrence, regardless of whether they are duplications or deletions. Though the distribution of lengths between duplication and deletion CNVs in the McCarroll et al. (2008) data set overlap, there is a significant difference in average size (∼15 kb for deletions, and ∼43 kb for duplications) likely due to the higher detectability of small deletions. To ensure that this is not the cause of our observations, we controlled for differences in the length of CNVs by randomly selecting 1000 subsets of deletions with a length distribution matching that of the set of duplications (see Materials and Methods). We then compared the average number of deletions having a tag SNP in these sets with the number of duplications having a tag SNP, finding that the difference was again significant (P = 7.40 × 10⁻⁶, FET). In fact, approximately 70% of these longer deletions had a tag SNP in the bootstrapped data sets on average, slightly higher than deletions as a whole, showing that larger events are not less likely to have a tag SNP.
To directly evaluate the impact of recurrent mutation, we asked whether the nearest 3′ flanking SNP to each of our deletion CNVs were themselves tagged (r2 > 0.8) by another SNP, and compared these counts with the number of deletions with a tag SNP. This paired comparison eliminates any effect of SNP density and should assess only the effect of recurrent mutation (note that this analysis is only informative for SNPs near deletions, as similar observations near duplications would be consistent with both recurrence and nontandem duplication). We find that there is no significant difference between the proportion of SNPs and deletions that are tagged (P = 0.57, FET), though there is a slightly higher proportion for SNPs (supplementary table S2, Supplementary Material online). To further investigate any differences, we again made a frequency-matched comparison of LD between flanking SNPs and deletions (fig. 1). We found a statistically significant difference, though the difference is confined to low-frequency mutations (P ≤ 0.02 for the three frequency bins containing variants with MAF ≤ 0.3, t-tests). This observation is best explained by recurrent mutations creating the same deletion polymorphisms on multiple different backgrounds, though we do not have an explanation for the frequency dependence of the difference in LD between SNPs and CNVs. It is not surprising that we find some evidence for recurrent mutations at CNVs, as CNVs are often found in regions likely to be hotspots of NAHR (Itsara et al. 2009). Although evidence for recurrent mutation at deletions almost certainly implies a similar or slightly smaller effect on duplications (Egan et al. 2007; Turner et al. 2008), the taggability gap between deletions and duplications appears to be larger than the gap between deletions and SNPs. These results imply that transposing duplications may play a greater role in reducing the taggability of CNVs than does recurrent mutation.
A second commonly proposed explanation for the taggability gap is that there is a lower density of SNPs surrounding CNVs—at least on the array—and therefore less of a chance of finding a tag SNP. Again, to explain our observed difference in LD between duplications and deletions, it must be that there is decreased SNP density around duplications relative to deletions. Although we find that the distance to the closest flanking SNP is actually lower for duplications compared with deletions (760 bp vs. 1122 bp), there is slightly lower SNP density in 100 kb windows centered around duplications than deletions (0.00126 SNPs per base pair around deletions vs. 0.00102 per base pair around duplications; P = 0.027, t-test). To control for this, we randomly selected density-matched subsets of deletions, as we did with the size matching described above. Again, we find a paucity of tag SNPs around duplications relative to deletions (P = 7.40 × 10⁻⁶, FET). As with the size-matched set, density-matched deletions were no less likely to have tag SNPs than deletions as a whole, with 69% of density-matched deletions being tagged on average versus 65% of the entire set of deletions. The finding that decreasing SNP density around deletions does not reduce their chances of being tagged by a SNP also casts some doubt on the possibility that lower SNP density around CNVs contributes to the taggability gap. Additionally, we find that the SNP density around the 344 deletions is no lower than the SNP density in 100 random regions of the genome 100 kb in length (P = 0.26, t-test). Thus, it seems highly unlikely that low SNP density around CNVs contributes to the taggability gap.
Lower LD around duplications could also be explained by less-reliable SNP genotyping in repeat regions if more of the SNPs flanking duplications are in repeats than are SNPs flanking deletions. To control for this possibility, we ran RepeatMasker on the genomic regions flanking each biallelic CNV from McCarroll et al. (2008) to determine the proportion of the 50 SNPs used for phasing (and later tagging) that reside in repeats. The proportion of SNPs near duplications found to be in repetitive elements was then compared with that of deletions, with deletions found to have slightly more SNPs in masked regions on average, though this difference was not significant (P = 0.33, t-test). In addition to less-reliable SNP genotyping, correctly inferring copy numbers from log intensity values may be more difficult for CNVs as a whole or as copy number increases (Locke et al. 2006). Thus, the error rate of inferred copy numbers of duplications could be higher than that of deletions, and this could result in lower LD around duplications than deletions. To examine the possibility that error-prone genotyping in duplications biases our results, we randomly introduced errors in copy number into our set of deletions, and then counted the number with a tag SNP (see Materials and Methods). This was done at increasing error rates until the difference in LD between duplications and deletions became nonsignificant, which did not happen until the error rate reached 10% (supplementary table S3, Supplementary Material online). Levels of LD were not equivalent between duplications and deletions until the error rate reached 12%. McCarroll et al. (2008) reported a genotyping accuracy of 99.3%, though they did not specify whether this was achieved by genotyping deletions, duplications, or both. If one were to conservatively assume that this CNV accuracy rate was determined solely by genotyping deletions, this would imply that the error rate for duplications would have to be roughly 15 times higher than that of deletions for our results to be an artifact of error rate.
The Effect of Ascertainment Bias
Finally, it should be noted that there is almost certainly an ascertainment bias in the array technology used to detect and genotype these CNVs: many regions of the genome are not queried by the array because they are repeat and duplication rich (McCarroll et al. 2008). As these regions are also likely to be enriched for CNVs (Iafrate et al. 2004; Sharp et al. 2005; Tuzun et al. 2005), this implies that we may be missing a large proportion of all CNVs. Though our above analyses have attempted to elucidate the causes of the taggability gap found only at observed CNVs in our data set, we wanted to further assess the generality of our findings. To do this, we added increasing numbers of undetected duplications and deletions to our analysis until the difference in taggability between them was no longer significant. Assuming that all the unobserved duplication and deletions have equal probabilities of being tagged, we would have to have detected only 40% of all CNVs for the total differences in taggability to become nonsignificant (supplementary table S4, Supplementary Material online). Though it is certainly possible that our data set contains 40% or less of all relatively common CNVs, there is no reason to believe that the unobserved duplication would be much easier to tag than those in our current set. In fact, the assumption of equal taggability of unobserved duplications and deletions is likely to be extremely conservative, as the duplication-rich regions of the human genome are especially enriched for transposed duplications (Jiang et al. 2007).
Ascertainment bias is also in issue in the fosmid clone-based data, as this method can only detect duplications small enough to be contained in a fosmid (Tuzun et al. 2005). This raises the possibility that the duplications detected by Kidd et al. (2008) could belong to a smaller class of duplications with different properties than those detected by McCarroll et al. (2008). Indeed, we find that CNVs in the McCarroll et al. data set are larger on average than those in the Kidd et al. data set (43 kb vs. 16 kb, P = 0.006, t-test). However, the majority of duplications in the McCarroll et al. data set are less than 40 kb in length, the approximate expected length of a fosmid insert. When we restrict our LD analysis to this set, we still observed decreased taggability relative to deletions (P = 1.90 × 10⁻⁶).
Conclusions
Our results explain apparent conflicts among previous studies on the amount of LD between CNVs and flanking markers (Hinds et al. 2006; McCarroll et al. 2006; Locke et al. 2006). The first of these studies were based only on deletions relative to the reference genome (Hinds et al. 2006; McCarroll et al. 2006) and consequently found higher LD than subsequent CNV studies including both deletions and duplications (Locke et al. 2006; Redon et al. 2006; McCarroll et al. 2008). Our results suggest that the differences between studies are purely due to the types of mutations detected by different methods and not to any larger experimental-design or experimental-platform issues. Although we have found that recurrent mutation may play some role in the taggability gap, we found no obvious effect of SNP density on the taggability of CNVs. The finding that transposing duplicates contribute to the taggability gap implies that studies of CNVs must consider the location of the insertion event as well as the location of the parental copy. To understand the mutational mechanisms underlying human phenotypes, it may be equally (or more) important to discover any gene that is disrupted by a duplication as it is to understand the function of the duplicated gene itself. Only methods that detect insertion sites (i.e., clone-based methods; Tuzun et al. 2005; Kidd et al. 2008) are currently able to do this, though our results suggest a way to map duplications by finding SNPs in high LD with them.
Supplementary Material
Figures S1, S2, and S3, and tables S1, S2, S3, and S4 are available at Molecular Biology and Evolution online (http://www.mbe.oxfordjournals.org/).
Supplementary Material
Acknowledgments
We thank J. Kidd and E. Eichler for sharing their data, and M. Lynch for discussion. This work was supported by a grant from the National Institutes of Health to S. Nuzhdin and M.W.H. (R01-GM076643A) and by a grant from the National Science Foundation to M.W.H. (DBI-0845494).
References
- Bailey JA, Gu ZP, Clark RA, Reinert K, Samonte RV, Schwartz S, Adams MD, Myers EW, Li PW, Eichler EE. Recent segmental duplications in the human genome. Science. 2002;297:1003–1007. doi: 10.1126/science.1072047. [DOI] [PubMed] [Google Scholar]
- Cheng Z, Ventura M, She XW, et al. (12 co-authors) A genome-wide comparison of recent chimpanzee and human segmental duplications. Nature. 2005;437:88–93. doi: 10.1038/nature04000. [DOI] [PubMed] [Google Scholar]
- Conrad DF, Hurles ME. The population genetics of structural variation. Nat Genet. 2007;39:S30–S36. doi: 10.1038/ng2042. [DOI] [PMC free article] [PubMed] [Google Scholar]
- Cook EH, Jr, Scherer SW. Copy-number variations associated with neuropsychiatric conditions. Nature. 2008;455:919–923. doi: 10.1038/nature07458. [DOI] [PubMed] [Google Scholar]
- Dopman EB, Hartl DL. A portrait of copy-number polymorphism in Drosophila melanogaster. Proc Natl Acad Sci USA. 2007;104:19920–19925. doi: 10.1073/pnas.0709888104. [DOI] [PMC free article] [PubMed] [Google Scholar]
- Egan CM, Sridhar S, Wigler M, Hall IM. Recurrent DNA copy number variation in the laboratory mouse. Nat Genet. 2007;39:1384–1389. doi: 10.1038/ng.2007.19. [DOI] [PubMed] [Google Scholar]
- Emerson JJ, Cardoso-Moreira M, Borevitz JO, Long M. Natural selection shapes genome-wide patterns of copy-number polymorphism in Drosophila melanogaster. Science. 2008;320:1629–1631. doi: 10.1126/science.1158078. [DOI] [PubMed] [Google Scholar]
- Han MV, Hahn MW. Identifying parent-daughter relationships among duplicated genes. Pac Symp Biocomput. 2009;14:114–125. [PubMed] [Google Scholar]
- Hinds DA, Kloek AP, Jen M, Chen XY, Frazer KA. Common deletions and SNPs are in linkage disequilibrium in the human genome. Nat Genet. 2006;38:82–85. doi: 10.1038/ng1695. [DOI] [PubMed] [Google Scholar]
- Hubbard TJP, Aken BL, Ayling S, et al. (58 co-authors) Ensembl 2009. Nucleic Acids Res. 2009;37:D690–D697. doi: 10.1093/nar/gkn828. [DOI] [PMC free article] [PubMed] [Google Scholar]
- Iafrate AJ, Feuk L, Rivera MN, Listewnik ML, Donahoe PK, Qi Y, Scherer SW, Lee C. Detection of large-scale variation in the human genome. Nat Genet. 2004;36:949–951. doi: 10.1038/ng1416. [DOI] [PubMed] [Google Scholar]
- Itsara A, Cooper GM, Baker C, et al. (14 co-authors) Population analysis of large copy number variants and hotspots of human genetic disease. Am J Hum Genet. 2009;84:148–161. doi: 10.1016/j.ajhg.2008.12.014. [DOI] [PMC free article] [PubMed] [Google Scholar]
- Jiang Z, Tang H, Ventura M, Cardone MF, Marques-Bonet T, She X, Pevzner PA, Eichler EE. Ancestral reconstruction of segmental duplications reveals punctuated cores of human genome evolution. Nat Genet. 2007;39:1361–1368. doi: 10.1038/ng.2007.9. [DOI] [PubMed] [Google Scholar]
- Karolchik D, Kuhn RM, Baertsch R, et al. (25 co-authors) The UCSC Genome Browser Database: 2008 update. Nucleic Acids Res. 2008;36:D773–D779. doi: 10.1093/nar/gkm966. [DOI] [PMC free article] [PubMed] [Google Scholar]
- Kidd JM, Cooper GM, Donahue WF, et al. (46 co-authors) Mapping and sequencing of structural variation from eight human genomes. Nature. 2008;453:56–64. doi: 10.1038/nature06862. [DOI] [PMC free article] [PubMed] [Google Scholar]
- Lewontin RC. The interaction of selection and linkage. I. General considerations; Heterotic models. Genetics. 1964;49:49–67. doi: 10.1093/genetics/49.1.49. [DOI] [PMC free article] [PubMed] [Google Scholar]
- Locke DP, Sharp AJ, McCarroll SA, et al. (11 co-authors) Linkage disequilibrium and heritability of copy-number polymorphisms within duplicated regions of the human genome. Am J Hum Genet. 2006;79:275–290. doi: 10.1086/505653. [DOI] [PMC free article] [PubMed] [Google Scholar]
- Lupski JR, Montes de Oca-Luna R, Slaugenhaupt S, et al. (12 co-authors) DNA duplication associated with Charcot-Marie-Tooth disease type 1A. Cell. 1991;66:219–232. doi: 10.1016/0092-8674(91)90613-4. [DOI] [PubMed] [Google Scholar]
- McCarroll S, Kuruvilla F, Korn J, et al. (26 co-authors) Integrated detection and population-genetic analysis of SNPs and copy number variation. Nature Genetics. 2008;40:1166–1174. doi: 10.1038/ng.238. [DOI] [PubMed] [Google Scholar]
- McCarroll SA, Hadnott TN, Perry GH, et al. (11 co-authors) Common deletion polymorphisms in the human genome. Nat Genet. 2006;38:86–92. doi: 10.1038/ng1696. [DOI] [PubMed] [Google Scholar]
- McGrath CL, Casola C, Hahn MW. Minimal effect of ectopic gene conversion among recent duplicates in four mammalian genomes. Genetics. 2009;182:615–622. doi: 10.1534/genetics.109.101428. [DOI] [PMC free article] [PubMed] [Google Scholar]
- Paques F, Haber JE. Multiple pathways of recombination induced by double-strand breaks in Saccharomyces cerevisiae. Microbiol Mol Biol Rev. 1999;63:349–404. doi: 10.1128/mmbr.63.2.349-404.1999. [DOI] [PMC free article] [PubMed] [Google Scholar]
- Perry GH, Dominy NJ, Claw KG, et al. (13 co-authors) Diet and the evolution of human amylase gene copy number variation. Nature Genetics. 2007;39:1256–1260. doi: 10.1038/ng2123. [DOI] [PMC free article] [PubMed] [Google Scholar]
- Redon R, Ishikawa S, Fitch KR, et al. (43 co-authors) Global variation in copy number in the human genome. Nature. 2006;444:444–454. doi: 10.1038/nature05329. [DOI] [PMC free article] [PubMed] [Google Scholar]
- Reich DE, Cargill M, Bolk S, et al. (11 co-authors) Linkage disequilibrium in the human genome. Nature. 2001;411:199–204. doi: 10.1038/35075590. [DOI] [PubMed] [Google Scholar]
- Sebat J, Lakshmi B, Troge J, et al. (21 co-authors) Large-scale copy number polymorphism in the human genome. Science. 2004;305:525–528. doi: 10.1126/science.1098918. [DOI] [PubMed] [Google Scholar]
- She XW, Jiang ZX, Clark RL, Liu G, Cheng Z, Tuzun E, Church DM, Sutton G, Halpern AL, Eichler EE. Shotgun sequence assembly and recent segmental duplications within the human genome. Nature. 2004;431:927–930. doi: 10.1038/nature03062. [DOI] [PubMed] [Google Scholar]
- Sharp AJ, Locke P, McGrath SD, et al. (14 co-authors) Segmental duplications and copy-number variation in the human genome. Am J Hum Genet. 2005;77:78–88. doi: 10.1086/431652. [DOI] [PMC free article] [PubMed] [Google Scholar]
- She XW, Liu G, Ventura M, et al. (21 co-authors) A preliminary comparative analysis of primate segmental duplications shows elevated substitution rates and a great-ape expansion of intrachromosomal duplications. Genome Res. 2006;16:576–583. doi: 10.1101/gr.4949406. [DOI] [PMC free article] [PubMed] [Google Scholar]
- Stephens M, Donnelly P. A comparison of Bayesian methods for haplotype reconstruction from population genotype data. Am J Hum Genet. 2003;73:1162–1169. doi: 10.1086/379378. [DOI] [PMC free article] [PubMed] [Google Scholar]
- Turner DJ, Miretti M, Rajan D, Fiegler H, Carter NP, Blayney ML, Beck S, Hurles ME. The rates of de novo meiotic deletions and duplications causing several genomic disorders in the male germline. Nat Genet. 2008;40:90–95. doi: 10.1038/ng.2007.40. [DOI] [PMC free article] [PubMed] [Google Scholar]
- Tuzun E, Sharp AJ, Bailey JA, et al. (12 co-authors) Fine-scale structural variation of the human genome. Nat Genet. 2005;37:727–732. doi: 10.1038/ng1562. [DOI] [PubMed] [Google Scholar]
- Woodward K, Kendall E, Vetrie D, Malcolm S. Pelizaeus-Merzbacher disease: Identification of Xq22 proteolipid-protein duplications and characterization of breakpoints by interphase FISH. Am J Hum Genet. 1998;63:207–217. doi: 10.1086/301933. [DOI] [PMC free article] [PubMed] [Google Scholar]
- Woodward KJ, Cundall M, Sperle K, et al. (16 co-authors) Heterogeneous duplications in patients with Pelizaeus-Merzbacher disease suggest a mechanism of coupled homologous and nonhomologous recombination. Am J Hum Genet. 2005;77:966–987. doi: 10.1086/498048. [DOI] [PMC free article] [PubMed] [Google Scholar]
- Xue YL, Sun DL, Daly A, et al. (12 co-authors) Adaptive evolution of UGT2B17 copy-number variation. Am J Hum Genet. 2008;83:337–346. doi: 10.1016/j.ajhg.2008.08.004. [DOI] [PMC free article] [PubMed] [Google Scholar]
Associated Data
This section collects any data citations, data availability statements, or supplementary materials included in this article.