

Abstract
Interactions between prevalent late-life medical conditions and expansion of the cerebral ventricles are not well understood. Thirty elderly subjects received three magnetic resonance (MR) scans each, in 1997–1999, 2002–2004, and 2003–2005. A linear expansion model of MR-measured lateral ventricle volume was estimated for each subject by fitting a line to a plot of their 1997–1999 and 2002–2004 volumes as a function of time. Acceleration in ventricular expansion was defined as the deviation between the 2003–2005 volumes measured from MR and the 2003–2005 volumes predicted by the linear expansion model. Ventricular acceleration was analyzed in a multivariate model with age, race, history of heart disease, diabetes, and hypertension as fixed effects. Ventricular acceleration was significantly higher in non-whites, diabetics, and those without heart disease (p < 0.05). Ventricular acceleration was higher in subjects with a history of hypertension, but the difference was not statistically significant (p = 0.08). Acceleration of ventricular expansion in the elderly may be related to demographic and cardiovascular factors.
Keywords: Magnetic resonance imaging, Lateral ventricles, Aging, Diabetes, Heart disease
1. Introduction
Cross-sectional imaging studies have suggested that the cerebral ventricles expand throughout early adulthood at a steady pace as a result of gradual neuronal death, but that the rate of ventricular expansion accelerates late in life [10,30,25]. The question of whether the expansion rate is modulated by risk factors in the elderly could be of clinical importance, since ventricular dilation has been associated with risk of Alzheimer’s disease (AD) and with late-life cognitive decline in general [17,1,4,26,21].
Previous studies have suggested that faster rates of ventricular expansion may be associated with AD pathology, APOE ε-4 carrier status, and cardiovascular risk factors such as hypertension and diabetes [3,8,31,35,12,29,2,25,15]. However, since most previous studies measure ventricular volume at one or two time points per subject, they are limited in the information they can provide about the time course of ventricular expansion. For example, if ventricular volume is only measured at two time points in a particular subject, it is not possible to directly measure whether ventricular expansion is accelerating, slowing, or remaining constant over time in that subject. Determining whether comorbidities are associated with fast and steady, as opposed to accelerating, ventricular expansion could be important for understanding the underlying effects of the comorbidities, and for predicting future ventricular volume in a clinical setting.
In this study, we measured ventricular volumes at three time points per subject in order to determine whether each subject experienced ventricular expansion that accelerated, slowed, or remained constant over time. Our goal was to determine whether accelerating ventricular expansion was linked to specific clinical factors. Subjects were drawn from a community-based epidemiological study in an attempt to avoid selection bias issues. Following a growing trend in region-of-interest based neuroimaging studies, we computed ventricular volumes using a fully automated computerized technique to avoid concerns about the reliability and reproducibility of human region-of-interest tracings [9,36]. We hope that the current study extends the results of an earlier study in which the same image processing methodology was used for prospective analysis of a larger group of subjects who received only a single MR scan at baseline, but returned for a follow-up clinical evaluation 4 years later [6].
2. Methods
2.1. Subjects
There were 389 subjects who received clinical evaluations and high-resolution MR scans in 1997–1999 as part of the Cardiovascular Health Study (CHS) Cognition Study at the Pittsburgh center. Details of the diagnostic criteria and clinical evaluation have been reported previously [23,22]. From this initial sample, 107 subjects received a follow-up clinical evaluation and MR scan between 2002 and 2004. Of the 107 subjects who received evaluations and scans in 1997–1999 and 2002–2004, 31 subjects received a third evaluation and MR scan in 2004–2005. Complete demographic and clinical data was available for 30 of the 31 subjects who received three evaluations and scans. At time of the 1997–1999 evaluation, 28 of the 30 subjects were diagnosed as cognitively normal and two were diagnosed with mild cognitive impairment (MCI). In the period between the 1997–1999 and 2005 evaluations, seven subjects converted to dementia, 10 converted to MCI, and 11 remained normal. None of the 30 subjects had a history of stroke prior to the 1997–1999 visit or incident stroke between the 1997–1999 and 2005 evaluations. Infarcts were apparent on 8 of the 30 1997–1999 scans; however, no additional infarcts were seen on 2002–2004 or 2005 scans. A comparison of the 389 CHS Cognition Study subjects who received at least the 1997–1999 clinical evaluation and MR scan, and the 30 subjects with 3 evaluations, 3 MR scans, and complete clinical data, is shown in Table 1, including the results of two-sided t-tests for the numeric variables. All data items were measured during the 1997–1999 visit. Mean age and mean Digit Symbol Substitution Test scores were not significantly different between the groups. However, mean Modified Mini-Mental State Examination score was significantly higher in the group with three scans and evaluations, and mean Hachinski ischemic scale and unified Parkinson disease rating scale scores were significantly lower in the group with three scans and evaluations.
Table 1.
Comparison of demographic data between CHS Cognition Study subjects who received three clinical evaluations and MRI scans, and the full set of CHS Cognition Study subjects who received at least one clinical evaluation and MRI scan
| Three evaluations | At least A 1997 evaluation | p | |
|---|---|---|---|
| Gender (female, male) | 20, 10 | 238, 151 | |
| Race (Caucasian, African-American, other) | 21,9,0 | 308, 80, 1 | |
| Education level (up to, beyond high school) | 20, 10 | 236, 153 | |
| Age in 1997–1999 (mean, S.D.) | 73.37, 4.09 | 73.55, 4.24 | 0.81 |
| Hachinski ischemic scale (mean, S.D., N/A) | 0.93, 0.83, 0 | 1.29, 1.67, 65 | 0.049 |
| Unified Parkinson disease rating scale (UPDRS; mean, S.D., N/A) | 3.8, 3.85, 0 | 5.46, 5.70, 65 | 0.037 |
| Modified mini mental state exam (3MSE; mean, S.D.) | 96.03, 3.61 | 93.03, 8.57 | 0.00034 |
| Digit-symbol substitution test (DSST; mean, S.D.) | 45.57, 10.97 | 43.15, 14.03 | 0.26 |
All data items were measured during the 1997–1999 visit. Entries in bold show variables that were significantly different between the groups under two-sided t-tests at the p = 0.05 level.
2.2. MRI acquisition and processing
MR images were collected from 1997 to 2005 on the same 1.5 T Signa scanner (GE Medical Systems) with high performance gradients (4 G/cm and 150 T/m s). The subjects were positioned in a standard head coil and a volumetric spoiled gradient recalled acquisition (SPGR) sequence with parameters optimized for maximal contrast among gray matter, white matter, and cerebrospinal fluid was acquired in the coronal plane (TE/TR = 5/25, flip angle = 40°, NEX = 1, slice thickness = 1.5 mm/0mm interslice). Lateral ventricular volumes were estimated fully automatically on all scans using a technique described in a previous study and validated on a set of dilated ventricles [5] [Carmichael et al. 2006, submitted]. In short, images were resampled to obtain 1mm×1mm×1mm voxels, anisotropically smoothed [33], skull-stripped [32], cropped to remove all-zero planes, and geometrically aligned [7] to images on which the lateral ventricles had been delineated manually or automatically. Specifically, 1997–1999 images were aligned to a single, randomly selected subject image on which the lateral ventricles had been manually traced by a trained rater to include the frontal horn and body, as well as the temporal and posterior horns, using a tracing protocol described previously [27]. 2002–2004 images were aligned to their corresponding 1997–1999 images, and 2005 images were aligned to their corresponding 2002–2004 images. The alignment between 1997 and 1999 images and the manually traced subject image allowed the manual ventricle tracing to be transferred to the 1997–1999 subject images. Consequently, the alignment between corresponding 1997–1999, 2002–2004, and 2005 images allowed the manual-tracing-based ventricle delineation to be transferred from the 1997–1999 to 2002–2004 and 2005 images.
2.3. Statistical analysis
Ventricular volumes were measured in all scans. Kolmogorov–Smirnov tests were used to test the distributions of 1997–1999, 2002–2004, and 2005 ventricular volumes for normality. For each subject, a predictive linear model of ventricular volume as a function of time was estimated by fitting a regression line to a plot of the 1997–1999 and 2002–2004 ventricular volumes as a function of time. In each per-subject model, time was the predictor variable, ventricular volume was the outcome variable, and the slope and intercept of the regression line were the model parameters. In more detail, a graph with time on the x axis and ventricular volume on the y axis was constructed for each subject. Ventricular volume at the time of the 1997–1999 visit was plotted at the time of the 1997–1999 visit, and ventricular volume at the time of the 2002–2004 visit was plotted at the time of the 2002–2004 visit. A line connecting these two plotted points was used as a linear model of ventricular expansion over time, given data exclusively from the 1997–1999 and 2002–2004 evaluations. We refer to this line as the “linear expansion model” for that subject, and emphasize that the term “linear” refers to change in volume with respect to time, not the spatial pattern of ventricular expansion. The assumption of linear ventricular expansion over time was then evaluated for each subject by using the linear expansion model to predict ventricular volume at the time of the 2005 evaluation. For each subject, the signed percent difference between the ventricular volume measured from the 2005 MR scan, and the 2005 ventricular volume predicted by the linear expansion model, was computed and analyzed as an indicator of whether the rate of ventricular expansion accelerated, decelerated, or stayed constant in the period between 2002–2004 and 2005, compared to the ventricular expansion rate between 1997–1999 and 2002–2004. We refer to the signed percent difference between measured and predicted 2005 volumes as the ventricular acceleration; if greater than 0, the ventricles expanded at a faster rate between 2002–2004 and 2005 than they did between 1997–1999 and 2002–2004 (see Fig. 1).
Fig. 1.

Schematic description of ventricular acceleration. Ventricular volumes are measured from MRI in 1997–1999, 2002–2004, and 2005 for all subjects (black dots). A linear expansion model of ventricular volume over time is established based on the 1997–1999 and 2002–2004 ventricular volumes (solid line). The linear expansion model is extrapolated to the 2005 scan date to give a predicted 2005 ventricular volume, based on an assumption of linear ventricular expansion (grey dot). The percentage difference between the predicted and measured 2005 ventricular volumes is referred to as the ventricular acceleration (dashed line).
Ventricular acceleration was analyzed in a multivariate linear fixed-effects model in which 1997–1999 and 2002–2004 clinical data were fixed effects. Specifically, the following factors were fixed effects: subject age in 1997–1999, race (white versus non-white), and presence of heart disease, diabetes, and hypertension in 1997–1999 and/or 2002–2004. The significance of each of these factors in modulating ventricular acceleration was assessed through omnibus F tests in a five-way ANOVA design. Effect size was determined by the contrast correlation rcontrast [28].
In the fixed effects analysis, ventricular acceleration is modeled by an overall population mean that is modulated by additive terms that depend on age, race, and presence of heart disease, diabetes, and hypertension. We used the results of the fixed-effects analysis to assess the incremental value of using clinical data as predictor variables in a model of 2005 ventricular volume. To do so, we made two predictive estimates of 2005 ventricular volume for each subject, and compared the predicted volumes with that measured directly from 2005 MRI. The first predictive estimatewas based on the linear expansion model described above; a 2005 ventricular volume was estimated by drawing a line through the 1997–1999 and 2002–2004 ventricular volumes on a plot versus time, and following the line to the 2005 scan date. The second predictive estimate modulated the linear expansion estimate by a ventricular acceleration that was estimated from subject clinical data through the fixed effects analysis. The 2005 ventricular volumes predicted by the linear expansion models and covariate-modulated models were compared to the measured 2005 ventricular volumes, and residual errors from the two sets of estimates were compared to each other using two-tailed paired t tests to assess whether the introduction of clinical variables in the covariate-modulated models incrementally reduced the prediction residuals.
3. Results
Kolmogorov–Smirnov tests did not reject the hypotheses that the 1997–1999, 2002–2004, or 2005 ventricular volumes were normally distributed (p = 0.97, 0.84, 0.73). The significance of factors in modulating ventricular acceleration is summarized in Table 2. Ventricular expansion accelerated in non-whites, diabetics, and those who did not have heart disease. Additionally, higher ventricular acceleration was associated with hypertension, but the difference was not statistically significant. Fig. 2 shows box plots of venctricular acceleration in terms of significant factors in the model, plus hypertension. Percent error in 2005 ventricular volume was significantly lower for the covariate-modulated model compared to the linear expansion model (two-sided t-test, t = −2.8775, d.f. = 29, p = 0.007). Box plots of percent error in the two models is shown in Fig. 3.
Table 2.
Significance of factors in a predictive model of 2002–2004 ventricular expansion based on 1998 and 2002 ventricular volumes and clinical data
| Factor | F | d.f. | p | rcontrast |
|---|---|---|---|---|
| Age | 1.1121 | 1 | 0.3021 | 0.2104 |
| Race | 18.6592 | 1 | 0.0002 | 0.6614 |
| Heart disease | 4.9483 | 1 | 0.0358 | 0.4134 |
| Diabetes | 9.9091 | 1 | 0.0044 | 0.5406 |
| Hypertension | 3.2507 | 1 | 0.0840 | 0.3454 |
Fig. 2.
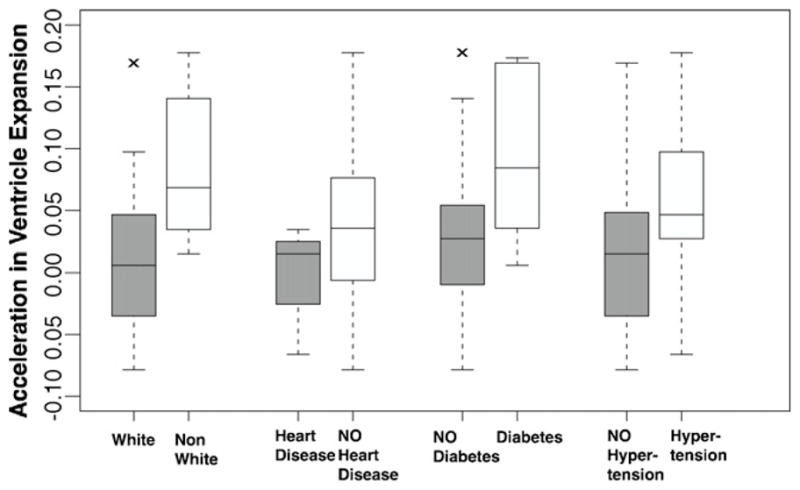
Box plots of ventricular expansion acceleration by race and cardiovascular risk factors. Boxes show the median and first and third quartiles; whiskers extend to the most extreme data point which is no more than 1.5 times the interquartile range from the box. Raw values of ventricular acceleration are shown, with no adjustment for terms from the multivariate statistical model.
Fig. 3.

Percent error in predicted 2004 ventricular volume from two models of ventricular expansion. One model predicts 2004 volume using a regression line fit to 1998 and 2002 ventricular volumes (“Model WITHOUT Covariates”). The other model uses clinical covariates to modulate the volume predicted by the regression line (“Model WITH Covariates”). Boxes show the median and first and third quartiles; whiskers extend to the most extreme data point which is no more than 1.5 times the interquartile range from the box. Raw values of ventricular acceleration are shown, with no adjustment for terms from statistical models.
4. Discussion
The key finding of this study is that subjects with hypertension or diabetes experienced ventricular expansion that accelerated over time, independent of age or race. Since hypertension and diabetes are related to higher incidence of MR-identified white matter lesions, and white matter lesions are in turn associated with increased risk of ventricular expansion, we speculate that the accelerating expansion could be related to white matter damage that accumulates continually over time [37,19,18,21]. Diabetes-related structural brain changes may be related to the increased dementia risk among diabetics in the CHS [14]. Future studies involving larger numbers of ventricular volume measurements per subject may help to determine whether ventricular expansion accelerates continually until death, or reaches a steady-state expansion rate, in subjects with hypertension or diabetes.
Acceleration in ventricular expansion was lower in subjects with heart disease. While the relationship between ventricular acceleration and mortality has not been established, we speculate that subjects with a history of heart disease and accelerating ventricular expansion were more likely to excluded from our cohort due to increased mortality associated with ventricular expansion and heart disease. Specifically, a variety of measures related to heart disease were associated with mortality in the CHS[11], and ventricular expansion was associated with mortality in the CHS and elsewhere [16,34]. We speculate that concomitant heart disease and quickly accelerating ventricular acceleration increase mortality risk to such an extent that any CHS subjects with these characteristics died before the 2005 follow-up, and were therefore excluded from this study. Among subjects with heart disease, only those with concomitant near-constant ventricular expansion survived to 2005, leading to the appearance of decreased ventricular acceleration among those with heart disease. Low ventricular acceleration could be associated with decreased mortality among subjects with heart disease, for reasons that remain unclear.
Previous studies of the CHS cohort have suggested larger ventricles among non-whites [38,24]. Since the non-white subjects in this study were African-American, and African-American race has been associated with higher incidence of relatively severe white matter hyperintensities, we speculate that accelerating ventricular expansion among African-Americans could be related to white matter damage that accumulates over time [20]. However, associations between race and brain structure characteristics could also reflect complex interactions between genetics, socioeconomic status, and other factors [13].
Methodologically, we note that previous studies vary widely with respect to subject selection criteria and accounting for comorbidities. Furthermore, while most studies fit regression lines to plots of ventricular volume as a function of age, our results suggest that linear models of ventricular expansion could possibly be insufficient for accurate modeling, especially among subjects with prevalent late-life comorbidities, and that higher-order models may be more appropriate [25]. In the future, this hypothesis could be tested on a larger data set through statistical tests that directly compare linear and higher-order models, for example those with quadratic terms.
Acknowledgments
The research reported in this article was supported by National Heart, Lung, and Blood Institute contracts N01-HC-85079 through N01-HC-85086, N01-HC-35129, N01 HC-15103, N01 HC-55222, and U01 HL080295; NIH grants NS07391, MH064625, AG05133, DA015900-01, MH01077, EB001561, RR019771, RR021813, AG016570, AG20098, and AG15928; and additional contribution from the National Institute of Neurological Disorders and Stroke.
References
- 1.Adak S, Illouz K, Gorman W, Tandon R, Zimmerman E, Guariglia R, et al. Predicting the rate of cognitive decline in aging and early Alzheimer disease. Neurology. 2004;63(1):108–14. doi: 10.1212/01.wnl.0000132520.69612.ab. [DOI] [PubMed] [Google Scholar]
- 2.Biessels G-J. Cerebral complications of diabetes: clinical findings and pathogenetic mechanisms. Neth J Med. 1999;54:35–45. doi: 10.1016/s0300-2977(98)00134-x. [DOI] [PubMed] [Google Scholar]
- 3.Bradley K, Bydder G, Budge M, Hajnal J, White S, Ripley B, et al. Serial brain MRI at 3–6 month intervals as a surrogate marker for Alzheimer’s disease. Br J Radiol. 2002;75(894):506–13. doi: 10.1259/bjr.75.894.750506. [DOI] [PubMed] [Google Scholar]
- 4.Breteler M, van Amerongen N, van Swieten J, Claus J, Grobbee D, van Gijn J, et al. Cognitive correlates of ventricular enlargement and cerebral white matter lesions on magnetic resonance imaging: The Rotterdam Study. Stroke. 1994;25(6):1109–15. doi: 10.1161/01.str.25.6.1109. [DOI] [PubMed] [Google Scholar]
- 5.Carmichael OT, Aizenstein HA, Davis SW, Becker JT, Thompson PM, Meltzer CC, et al. Atlas-based hippocampus segmentation in Alzheimer’s disease and mild cognitive impairment. NeuroImage. 2005;27(4):979–90. doi: 10.1016/j.neuroimage.2005.05.005. [DOI] [PMC free article] [PubMed] [Google Scholar]
- 6.Carmichael OT, Kuller LH, Lopez OL, Thompson PM, Lu A, Lee SE, et al. Ventricular volume and dementia progression in the Cardiovascular Health Study. Neurobiol Aging. 2007;28:389–97. doi: 10.1016/j.neurobiolaging.2006.01.006. [DOI] [PMC free article] [PubMed] [Google Scholar]
- 7.Chen M. PhD Thesis. Robotics Institute, Carnegie Mellon University; Pittsburgh, PA: 1999. 3D deformable registration using a statistical atlas with applications in medicine. [Google Scholar]
- 8.Ezekiel F, Chao L, Kornak J, Du A, Cardenas V, Truran D, et al. Comparisons between global and focal brain atrophy rates in normal aging and Alzheimer disease: Boundary shift integral versus tracing of the entorhinal cortex and hippocampus. Alzheimer Dis Assoc Disord. 2004;18(4):196–201. [PMC free article] [PubMed] [Google Scholar]
- 9.Fischl B, Salat D, Busa E, Albert M, Dieterich M, Haselgrove C, et al. Whole brain segmentation: automated labeling of neuroanatomical structures in the human brain. Neuron. 2002;33:341–55. doi: 10.1016/s0896-6273(02)00569-x. [DOI] [PubMed] [Google Scholar]
- 10.Foundas A, Zipin D, Browning C. Age-related changes of the insular cortex and lateral ventricles: conventional MRI volumetric measures. J Neuroimaging. 1998;8:216–21. doi: 10.1111/jon199884216. [DOI] [PubMed] [Google Scholar]
- 11.Fried LP, Kronmal, et al. Risk factors for 5-year mortality in older adults: the Cardiovascular Health Study. JAMA. 1998;279(8):585–92. doi: 10.1001/jama.279.8.585. [DOI] [PubMed] [Google Scholar]
- 12.Goldstein IB, Bartzokis G, Guthrie D, Shapiro D. Ambulatory blood pressure and brain atrophy in the healthy elderly. Neurology. 2002;59:713–19. doi: 10.1212/wnl.59.5.713. [DOI] [PubMed] [Google Scholar]
- 13.Gorelick PB. Cerebrovascular disease in African Americans. Stroke. 1998;29:2656–64. doi: 10.1161/01.str.29.12.2656. [DOI] [PubMed] [Google Scholar]
- 14.Irie F, Fitzpatrick AL, Lopez OL, Kuller LH, Peila R, Newman A, Launer LJ. Type 2 diabetes, genetic susceptibility, and the incidence of dementia in the Cardiovascular Health Study. Cardiovascular Health Study Paper Proposal. 2005:A210. [Google Scholar]
- 15.Knopman DS, Mosley TH, Catellier DJ, Sharrett AR Atherosclerosis Risk in Communities (ARIC) Study. Cardiovascular risk factors and cerebral atrophy in a middle-aged cohort. Neurology. 2005;64(12):2056–62. doi: 10.1212/01.wnl.0000176074.09733.a8. [DOI] [PubMed] [Google Scholar]
- 16.Kuller LH, Arnold AM, Longstreth WL, Manolio TA, O’Leary DH, Burke GL, et al. Longevity and probable vascular disease in the brain: the Cardiovascular Health Study. Proceedings of the 46th AHA annual conference on cardiovascular disease epidemiology and prevention; 2006. [Google Scholar]
- 17.Kuller LH, Lopez OL, Newman A, Beauchamp NJ, Burke G, Dulberg C, et al. Risk factors for dementia in the Cardiovascular Health Cognition Study. Neuroepidemiology. 2003;22(1):13–22. doi: 10.1159/000067109. [DOI] [PubMed] [Google Scholar]
- 18.Lazarus R, Prettyman R, Cherryman G. White matter lesions on magnetic resonance imaging and their relationship with vascular risk factors in memory clinic attenders. Int J Geriatr Psychiatry. 2005;20(3):274–79. doi: 10.1002/gps.1283. [DOI] [PubMed] [Google Scholar]
- 19.Leeuw FD, Barkhof F, Scheltens P. Alzheimer’s disease–one clinical syndrome, two radiological expressions: a study on blood pressure. J Neurol Neurosurg Psychiatry. 2004;75(9):1270–74. doi: 10.1136/jnnp.2003.030189. [DOI] [PMC free article] [PubMed] [Google Scholar]
- 20.Liao D, Cooper L, Cai J, Toole J, Bryan N, Burke G, et al. The prevalence and severity of white matter lesions, their relationship with age, ethnicity, gender, and cardiovascular disease risk factors: the ARIC study. Neuroepidemiology. 1997;16:149–62. doi: 10.1159/000368814. [DOI] [PubMed] [Google Scholar]
- 21.Longstreth W, et al. Clinical correlates of ventricular and sulcal size on cranial magnetic resonance imaging of 3301 elderly people: the Cardiovascular Health Study. Neuroepidemiology. 2000;19(1):30–42. doi: 10.1159/000026235. [DOI] [PubMed] [Google Scholar]
- 22.Lopez O, Jagust W, Becker SDJ, Fitzpatrick A, Dulberg C, Breitner J, et al. Prevalence and classification of mild cognitive impairment in O.T. Carmichael et al./Neurobiology of Aging 28 (2007) 1316–1321 1321 the Cardiovascular Health Study Cognition Study: Part 1. Arch Neurol. 2003;60(10):1385–89. doi: 10.1001/archneur.60.10.1385. [DOI] [PubMed] [Google Scholar]
- 23.Lopez OL, Kuller LH, Fitzpatrick A, Ives D, Becker JT, Beauchamp N. Evaluation of dementia in the Cardiovascular Health Cognition Study. Neuroepidemiology. 2003;22(1):1–12. doi: 10.1159/000067110. [DOI] [PubMed] [Google Scholar]
- 24.Manolio T, Kronmal R, Burke G, Poirier V, O’Leary D, Gardin J, et al. Magnetic resonance abnormalities and cardiovascular disease in older adults: The Cardiovascular Health Study. Stroke. 1994;25(2):318–27. doi: 10.1161/01.str.25.2.318. [DOI] [PubMed] [Google Scholar]
- 25.Meyer J, Rauch G, Crawford K, Rauch R, Konno S, Akiyama H, et al. Risk factors accelerating cerebral degenerative changes, cognitive decline and dementia. Int J Geriatr Psychiatry. 1999;14(12):1050–61. doi: 10.1002/(sici)1099-1166(199912)14:12<1050::aid-gps56>3.0.co;2-z. [DOI] [PubMed] [Google Scholar]
- 26.Mosley TH, Knopman DS, Catellier DJ, Bryan N, Hutchinson RG, Grothues CA, et al. MRI findings and cognitive functioning: The Atherosclerosis Risk in Communities Study. Neurology. 2005;64(12) doi: 10.1212/01.WNL.0000165985.97397.88. [DOI] [PubMed] [Google Scholar]
- 27.Narr KL, Thompson PM, Sharma T, Moussai J, Blanton R, Anvar B, et al. Three-dimensional mapping of temporo-limbic regions and the lateral ventricles in schizophrenia: Gender effects. Biol Psychiatry. 2001;50:84–97. doi: 10.1016/s0006-3223(00)01120-3. [DOI] [PubMed] [Google Scholar]
- 28.Rosenthal R, Rosnow RL, Rubin DB. Contrasts and effect sizes in behavioral research: a correlational approach. Cambridge, UK: Cambridge University Press; 2000. [Google Scholar]
- 29.Salerno J, Murphy D, Horwitz B, DeCarli C, Haxby J, Rapoport S, et al. Brain atrophy in hypertension: a volumetric magnetic resonance imaging study. Hypertension. 1992;20(3):340–48. doi: 10.1161/01.hyp.20.3.340. [DOI] [PubMed] [Google Scholar]
- 30.Scahill R, Frost C, Jenkins R, Whitwell J, Rossor M, Fox N. A longitudinal study of brain volume changes in normal aging using serial registered magnetic resonance imaging. Arch Neurol. 2003;60(7):989–94. doi: 10.1001/archneur.60.7.989. [DOI] [PubMed] [Google Scholar]
- 31.Silbert L, Quinn J, Moore M, Corbridge E, Ball M, Murdoch G, et al. Changes in premorbid brain volume predict Alzheimer’s disease pathology. Neurology. 2003;61(4):487–92. doi: 10.1212/01.wnl.0000079053.77227.14. [DOI] [PubMed] [Google Scholar]
- 32.Smith S. Fast robust automated brain extraction. Hum Brain Mapping. 2002;17(3):143–55. doi: 10.1002/hbm.10062. [DOI] [PMC free article] [PubMed] [Google Scholar]
- 33.Smith S, Brady J. SUSAN - a new approach to low level image processing. IJCV. 1997;23(1):45–78. [Google Scholar]
- 34.Ueki A, Miyoshi K, Fujita H, Shinjo H, Nakajima T, Iwasaki S, et al. Epidemiological study of the prognosis and relevant factors of demented patients. Nippon Ronen Igakkai Zasshi. 1995;32(10):656–63. doi: 10.3143/geriatrics.32.656. [DOI] [PubMed] [Google Scholar]
- 35.Wahlund L-O, Julin P, Lannfelt L, Lindqvist J, Svensson L. Inheritance of the ApoE e4 allele increases the rate of brain atrophy in dementia patients. Dement Geriatr Cogn Disord. 1999;10(4):262–68. doi: 10.1159/000017130. [DOI] [PubMed] [Google Scholar]
- 36.Walhovd K, Fjell A, Reinvang I, Lundervold A, Dale A, Eilertsen D, et al. Effects of age on volumes of cortex, white matter and subcortical structures. Neurobiol Aging. 2005;26(9):1261–70. doi: 10.1016/j.neurobiolaging.2005.05.020. [DOI] [PubMed] [Google Scholar]
- 37.Wiseman R, Saxby B, Burton E, Barber R, Ford G, O’Brien J. Hippocampal atrophy, whole brain volume, and white matter lesions in older hypertensive subjects. Neurology. 2004;63(10):1892–97. doi: 10.1212/01.wnl.0000144280.59178.78. [DOI] [PubMed] [Google Scholar]
- 38.Yue N, Arnold A, Longstreth W, Elster A, Jungreis C, O’Leary D, et al. Sulcal, ventricular, and white matter changes at MR imaging in the aging brain: data from the Cardiovascular Health Study. Radiology. 1997;202:33–9. doi: 10.1148/radiology.202.1.8988189. [DOI] [PubMed] [Google Scholar]