Abstract
Thrombin is generated enzymatically from prothrombin by two pathways with the intermediates of meizothrombin and prethrombin-2. Experimental concentration profiles from two independent groups for these two pathways have been re-analyzed. By rationally combining the independent data sets, a simple mechanism can be established and rate constants determined. A structural model is consistent with the data-derived finding that mechanisms that feature channeling or ratcheting are not necessary to describe thrombin production.
Keywords: enzyme kinetics, molecular dynamics simulation, blood coagulation
1. Introduction
Prothrombin is a zymogen of a serine protease (Sp) made up of a Gla, Kringle 1, Kringle 2 and a Sp domain [1,2]. The prothrombinase catalytic complex consists of factor Xa (the catalytic agent), factor Va (a cofactor), negatively charged membrane surfaces and calcium ions. Human prothrombin has two cleavage positions (Arg-271-Thr-272 and Arg-320-Ile-321), the cleavages of which are effected by prothrombinase [3,4,5,6]. There are two intermediates—meizothrombin, which results from an initial cleavage at Arg-320, and prethrombin-2, which results from an initial cleavage at Arg-271. A second cleavage in both cases leads to thrombin formation [3,4,5,6]. A controversial issue revolves around whether prothrombinase has two interconverting forms—each form of which leads to one of the two cleavages, or has a single form that carries out the cleavages sequentially, with two possible paths. Two groups have proposed somewhat divergent views based on independent experiments—the Nesheim group (NG) proposing the former [7,8] view and the Krishnaswamy group (KG) proposing the latter [9].
A significant history has preceded the current standoff—almost 100 papers have been published with the keywords prothrombinase, Nesheim or Krishnaswamy since the late 1970’s with essentially equal contributions. Two of the most cited of these papers [10,11] dealt directly with the activation of prothrombin. Although studying the same two pathways for the prothrombin to thrombin conversion, NG [8] and KG [9] produced somewhat different concentration profiles for the four measurables: prothrombin, meizothrombin, prethrombin-2, and thrombin. In this work, we have re-analyzed the different features of the two independent data sets qualitatively and quantitatively. In doing so, we have striven to provide a unified picture for the kinetics of prothrombinase. Our approach is to first show that the NG’s rejection [8] of a one form model (potentially consistent with the KG’s view [9]) is mathematically flawed. We then use the corrected one form mechanism, which includes ratcheting (time movement of the substrate to accommodate the multiple cleavages) and channelling (the direct formation of thrombin from initial complexes of prothrombinase and prothrombin) components, together with adjusted and combined data sets from both the NG [8] and KG [9], to derive consistent concentration profiles. We also show that the corrected one form model can be reduced significantly by eliminating ratcheting and channeling. Finally, a 3D structural model for the interaction of prothrombinase and prothrombin is provided which is consistent with the reduced corrected one form model and which provides a quite simple view of how thrombin is made.
2. Methods
2.1. Corrected one form mechanism
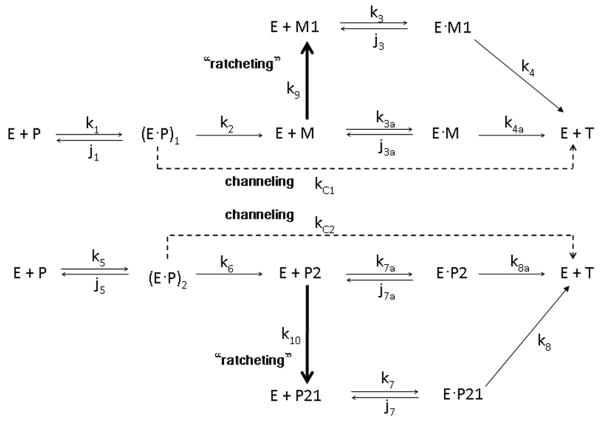
We review one of the mathematical models proposed by NG [8]. This model (the “one form” model) was ultimately dismissed by NG as inadequate. We will show, however, that when properly described mathematically, it is sufficient to describe the concentration profile data for thrombin generation. We initially adopt the mechanistic scheme of NG for the one form model as shown in Fig. 1.
Figure 1.
The mechanism of a one form model of prothrombinase for the activation of prothrombin proposed by NG [8]. The mechanism for the activation of prothrombin to thrombin by prothrombinase is achieved through two distinct intermediate pathways. In the scheme, a dotted arrow represents a channeling process and a thick arrow represents a ratcheting process (as defined by Ref.8). The notations for the scheme are as follows: E: enzyme (prothrombinase), P: prothrombin, M: meizothrombin, P2: prethrombin-2, M1: ratcheted meizothrombin, P21: ratcheted prethrombin-2, T: thrombin, •: complex form, (E•P)1 and (E•P)2: enzyme-substrate binding complex forms of prothrombin and prothrombinase, k with subscripts: kinetic constants for forward elementary reactions, and j with subscripts: kinetic constants for reverse elementary reactions.
Fig. 1 is an expanded form of scheme 1 in Ref.8, modified so as to be consistent with the one form system of differential equations provided in the appendix of Ref.8. We developed (from Fig. 1, the Nesheim one form model) a corrected list of the differential equations showing the time dependence of all species based on this mechanism:
| (1) |
| (2) |
| (3) |
| (4) |
| (5) |
| (6) |
| (7) |
| (8) |
| (9) |
| (10) |
| (11) |
| (12) |
| (13) |
where [A] denotes concentration of species A, and d[A]/dt denotes the time derivative of concentration of species A. The notations for the scheme are as follows: E: enzyme (prothrombinase), P: prothrombin, M: meizothrombin, P2: prethrombin-2, M1: ratcheted meizothrombin, P21: ratcheted prethrombin-2, T: thrombin, •: complex form, (E•P)1 and (E•P)2: substrate-enzyme binding complex forms of prothrombin and prothrombinase, k with subscripts: rate constants for forward elementary reactions, and j with subscripts: rate constants for reverse elementary reactions. Several important modifications to the NG scheme are necessary: (i) Equation 13, which accommodates the time dependence of the thrombin species, is added. (ii) In Ref.8, d[P]/dt in Eqn.S8 includes −(k2 +kC1)(E•P)1 terms and − (k6−kC2)(E•P)2 terms. These terms are irrelevant to the concentration change of [P] and thus, should be eliminated. (iii) In Eqn.S7 in Ref.8, k7 must be replaced by j7. (iv) The terms in Ref.8 involving k4a in Eqn.S9, k4 in Eqn.S10, k8a in Eqn.S11, and k8 in Eqn.S12 are incorrect and should be removed. In this minimalist model, the formation of enzyme-substrate complexes, (E•P)1 or (E•P)2 (Fig. 1), can be interpreted as a composite of the substrate’s exosite binding and subsequent rearrangement to form the active site conformation [12,13,14].
2.2 Solution of the system of ordinary differential equations
The solution of the correct set of ordinary differential equations (Eqns.1–13) was obtained by application of the ODE45 [15] routine of MATLAB 7.4 [16]. A systematic sensitivity approach was employed to find a set of final rate constants that reasonably reproduce the concentration profiles starting initially with the NG rate constants.
2.3 Qualitative and quantitative analysis of NG and KG data
The original NG and KG data for prothrombin to thrombin are shown in Supplementary material Fig. S1.A and Supplementary material Fig. S1.B. We adopt the original data of NG as given in Fig. 1.A of the paper [8] and KG in Fig. 3 of the paper [9]. For accuracy, we applied data extraction software (xyExtractor Graph Digitizer [17]) to faithfully reconstruct the essential concentration profiles. These are difference in the two data sets: (i) one of the intermediates, prethrombin-2, was apparently not detected in the KG experiments [9]. (ii) the profile of meizothrombin in the KG data [9] shows a near cusp around 150 sec. (iii) the ratio of meizothrombin to other species in the KG data [9] amounts to 40% of the total sum of all the species at its maximum. In the NG data, on the other hand, this ratio of meizothrombin to the sum of all species is less than 20%. (iv) thrombin production builds more rapidly in the early phase of the reaction for the NG data set [8]; i.e. there is a lag in the initial production of thrombin in the KG data set [9].
An important issue also arises with both data sets, however, in that the sum of the four species (prothrombin, thrombin, meizothrombin, and prethrombin-2) at specific time points does not always sum to the initial concentration of the prothrombin (i.e. lack of conservation of mass); several of the time points have summed concentrations yielding larger or smaller values than the initial concentration of prothrombin. This means, of course, that no solution of the differential equations can exactly fit all of the experimental data simultaneously since differential equation solvers are conservative with respect to mass. This is an essential and critical observation. To provide for a meaningful comparison, we scaled the concentration profiles of the two data sets [8,9] to be on a common scale (1μM prothrombin) and then plotted the rescaled NG data and the original KG data together. The rescaled concentration profiles of the two experiments are shown in Supplementary material Fig. S2. In addition, to highlight the difference in the concentration profiles of the two data sets, the non-conservative properties of NG and KG data are displayed. The differences between the two experiments present obstacles to deducing a unified description for the kinetics of prothrombinase through mathematical approaches.
However, an alternative is possible! Both experimental groups, the NG and KG, have long distinguished records in the study of the thrombin generation problem. Both groups report profiles for the same four participants. Suppose we weight their results equally and thus build a consensus model by averaging. Conservation is very nearly established (Fig. 2) by this procedure and well-behaved concentration profiles are found. The averaged data set enables us to provide a renewed insight into the kinetics of prothrombinase with mathematical accuracy.
Figure 2.
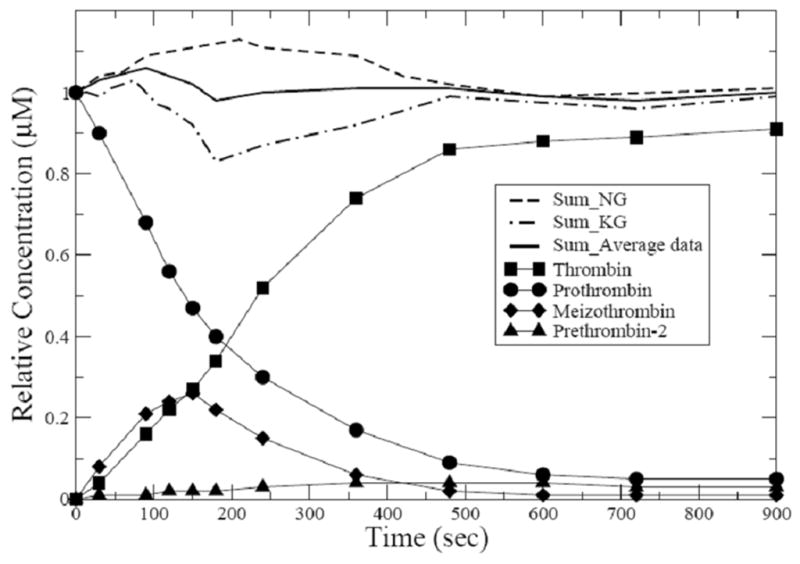
The data set derived by averaging over the NG and KG data sets. The summed concentrations almost recover a conservation of mass.
2.4 A 3D structural model for the prothrombinase-prothrombin complex
A 3D model structure of the prothrombinase/prothrombin (II) complex was obtained from solvent-equilibration molecular dynamics (MD) simulations for factor Xa (fXa)/factor Va (fVa)/II. The complex for fXa/fVa was the final output structure from Ref. 18. FXa is composed of four domains: serine protease (Sp), EGF2, EGF1, and Gla. The Sp domain is the C-terminus and contains the catalytic unit that provides the cleavage of prothrombin. The N-terminus Gla domain contains a number of γ-carboxyglutamic acid residues which bind Ca2+ ions and provide for fXa binding to negatively charged membrane. Prothrombin is similar to fXa with its Sp and Gla domains; the EGF2 and EGF1 domains of fXa, however, are replaced with Kringle domains K2 and K1, respectively, in prothrombin. The homology model for Sp domain of II (IISp) was derived from the X-ray crystal structures of bovine meizothrombin des F1 (PDB code: 1A0H) [19] and human prethrombin-2 (PDB code: 1NU9) [20] by using the program MODELLER8v2 [21].
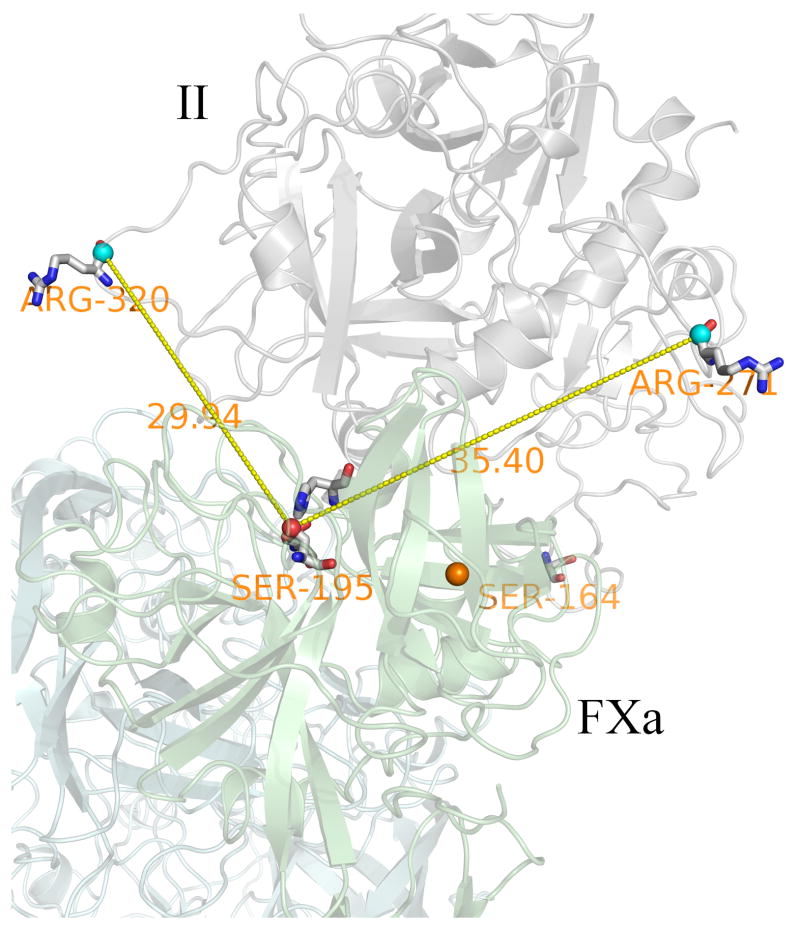
An initial docking complex (II to fXa/fVa) was obtained by using the available experimental binding data as biological filtering conditions for FFT docking for Kringle2 (K2)-Serine Protease (Sp) domains of II onto fXa/fVa, and then the docking of Gla-Kringle1 (K1) domains of II onto fXa/fVa. The flexible linker region (143–170) between the two kringle domains was constructed via loop search method in the Modeller program. A constrained MD simulation using AMBER-9 [22] was performed in a NPT ensemble at 300 K, 1 atm and in an initial 12.5 Å TIP3P [23] water box. The constraint was released after 9 ns and equilibrated over 24 ns. The picture shows the final snapshot at 27 ns. Only the interaction between Sp domains of II and fXa is shown in Fig. 5.
Figure 5.
The arrangement of Arg-320 and Arg-271 with respect to the active site of prothrombinase. (See text and Supplementary material S8)
3. Results
3.1 Correction to the ODE proposed by NG
The original differential equations published by NG [8] were solved with MATLAB using the rate constants derived from a curve fitting procedure. As shown in Supplementary material Fig. S3, only the prothrombin concentration profile is reasonably reproduced. The situation is not improved when the original rate constants from NG are applied to the corrected equations (Eqns.1–13) as shown in Supplementary material Fig. S4. However, it is possible to find a solution of the 13 corrected differential equations that fits the NG data somewhat reasonably well as shown in Supplementary material Fig. S5. Recall that one can not expect a perfect fit in this specific case due to the species conservation issues in the original data profiles discussed above. A fit to the KG data set is shown in Supplementary material Fig. S6. Mass conservation, no detection of prethrombin-2 and cusp behavior of meizothrombin make an acceptable fit impossible with this mechanism. Reaction constants derived for the NG, KG and the averaged data sets are listed in Table 1. A sensitivity analysis of the derived rate constants was conducted in the 12 constant case (Table 1). The rate constants were modified by the formula ki′=ki(1±0.1×rand[0,1]) to get a perturbation of a maximum of ±10% for two additional runs of predicted data. The rand[0,1] is a random number between 0 and 1. The standard errors for the three independent runs are shown in Fig. S7. In general, the standard errors for the procedure are small. Finally, the MATLAB fit to the averaged data set is given in Fig. 3.
Table 1.
| NG reaction constants (8) | Reaction constants for NG data in modified one-form model | Reaction constants for KG data in modified one-form model | Reaction constants for averaged data in modified one-form model | |
|---|---|---|---|---|
| k1 | 111.8 | 1.18×10² | 1.08×10² | 91.8 |
| k2 | 48.84 | 54.0 | 59.0 | 82.4 |
| k3 | 222.2 | 51.7 | 42.7 | 10.4b |
| k4 | 362.0 | 2.24×10³ | 57.1 | 38.1b |
| k5 | 36.04 | 12.6 | 12.8 | 5.16 |
| k6 | 10.74 | 37.9 | 34.7 | 32.3 |
| k7 | 8.08 | 1.99×10⁻⁶ | 2.56×10⁻⁶ | 6.76×10⁻⁸b |
| k8 | 215.1 | 0.230 | 4.62×10⁻² | 5.99×10⁻³b |
| k9 | 0.0369 | 2.17×10⁻⁹ | 4.36×10⁻⁸ | 3.12×10⁻⁸b |
| k10 | 0.0185 | 4.39×10⁻⁵ | 0.576 | 7.23×10⁻¹⁰b |
| j1 | 1.267 | 1.83×10⁻⁸ | 48.2 | 33.4 |
| j3 | 0.2058 | 1.70×10⁻⁵ | 1.45×10⁻⁵ | 1.58×10⁻⁶b |
| j5 | 0.2571 | 1.59×10⁻² | 640.2 | 21.8 |
| j7 | 7.841 | 0.102 | 3.74×10⁻⁸ | 4.46×10⁻⁹b |
| k3a | 1.677 | 1.44×10³ | 49.08 | 151.5 |
| k4a | 22.19 | 2.68×10² | 179.2 | 209.9 |
| k7a | 17.30 | 1.00 | 5.943 | 4.70 |
| k8a | 19.41 | 46.0 | 98.32 | 42.6 |
| j3a | 0.3494 | 2.56×10³ | 12.90 | 0.185 |
| j7a | 0.0022 | 8.30×10⁻⁴ | 5.29×10⁻⁴ | 2.66×10⁻⁵ |
| kC1 | 5.432×10⁻⁵ | 87.9 | 0.3785 | 2.39×10⁻⁶ b |
| kC2 | 2.6480 | 5.01 | 2.64×10⁻⁸ | 0.031 b |
The units for all association rate constants (k1, k3, k5, k7, k3a, k7a) values are μM−1sec−1. The units for all dissociation rate constants (j1, j3, j5, j7, j3a, j7a) values, turnover rate constants (k2, k4, k6, k8, k4a, k8a, kC1, kC2), and rate constants for ratcheting (k9, k10) are sec−1.
Set equal to zero in the reduced 12 parameter model of the averaged data.
NG: Nesheim group
KG: Krishnaswamy group
Figure 3.
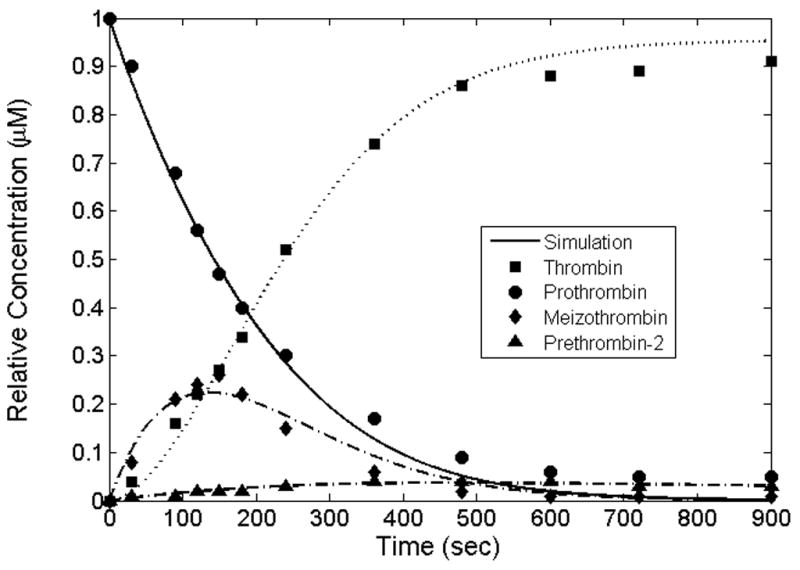
A fit to the averaged data set. Concentration profiles of prothrombin, thrombin, meizothrombin and prethrombin-2 from solving the modified differential equations using the averaged data set.
3.2 Biochemical implication of the modified one-form model for the averaged data set
In solving the corrected differential equations, it early became apparent that the fit of the concentration profiles is more sensitive to some rate constants than others. Subsequently, we asked if it would be possible to reduce the number of rate constants but nevertheless retain a reasonable fit. In fact, by reducing the set of parameters from 22 to 12 and then re-solving the differential equations with only these 12 parameters (identified in the last column of Table 1) for the averaged data set, we obtained an overall fit not distinguishable from the initial fit. Interestingly, we found, based on the surviving constants, that neither channeling nor ratcheting plays a critical role in the thrombin generation. In our study, the “ratcheting” process refers to the k9 and k10 reactions in the schematic one-form model shown in Fig. 1. From this reduced set of parameters, we can reconstruct a schematic one-form model corresponding to the averaged data set. The schematic model for averaged data is shown in Fig. 4. To show the predominant thrombin generation via the meizothrombin pathway qualitatively, we decomposed the total amount of thrombin (T) into thrombin generation via each of the meizothrombin (Tmeizo) and prethrombin-2 pathways (Tpre-2) respectively (See Supplementary material Fig. S8). By our estimation, thrombin is predominantly generated via the meizothrombin pathway (> 95%), consistent with that estimated by KG [9].
Figure 4.
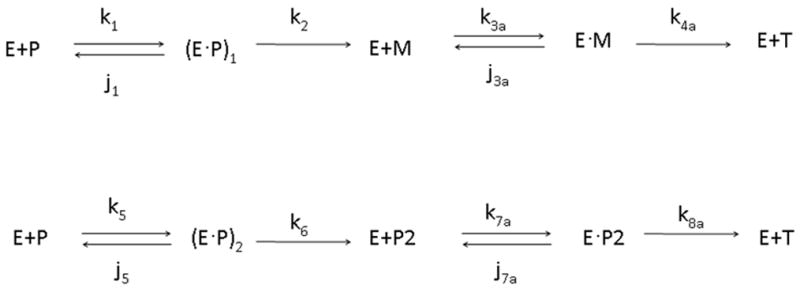
A schematic one-form model for the averaged data with 12 reduced parameters. Neither channeling nor ratcheting plays a role in this reduced model.
4. Discussion
It is beyond our scope to discuss in detail why the NG and KG have produced different concentration profiles for the same system. It is clear, however, that neither the NG nor KG experiment has satisfied the requirement for conservation of mass. Thus, it is impossible to adjudicate whether NG or KG is more correct. However, a positive approach is to argue that both NG and KG are studying the same system and that both groups have extensive experience in the study of the kinetics of coagulation systems. By judicious averaging their data sets, we are able to generate a data set that is largely conservative with respect to the mass of all the species. A best fit solution of the modified one-form model to the averaged data set indicates that neither channeling nor ratcheting is required for the thrombin generation. At this point, we sought a structural rationale for this observation.
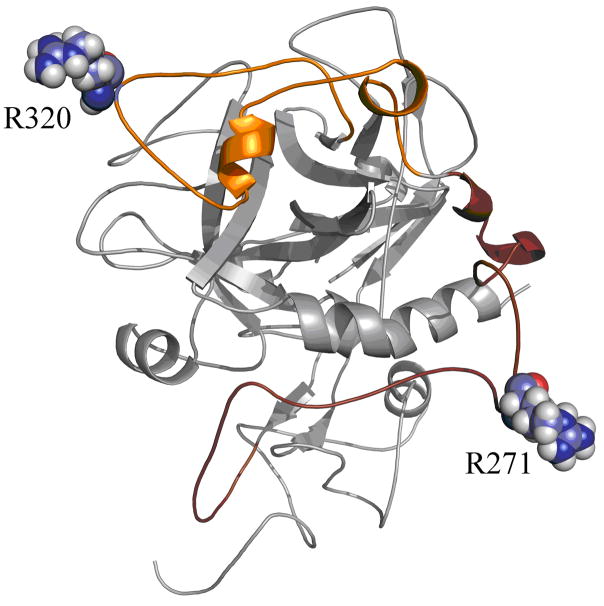
We have previously developed a solution-equilibrated model for human factor Va (fVa) in complex with factor Xa (fXa) [18]. We have subsequently docked (details in section 2.4) a model for the Sp domain of prothrombin into the putative binding site of fVa/fXa that was suggested in Ref.18. This model was then solution-equilibrated with accurate molecular dynamics simulation. In this model (available on request) Arg-320 is located closer to the active site of prothrombinase than Arg-271 as shown in Fig. 5. The model emphasizes the two flexible loops that harbor Arg-320 and Arg-271 in the middle of the respective loops as shown in Fig. 6. The two flexible loops of Arg-320 and Arg-271 are composed of 41 and 44 residues respectively. Given that Arg-320 and Arg-271 reside in the middle of long loops, the cleavage process might more simply be explained as a competition of these two loops to diffusively, with probably some local steering, sample the space of the protease (fXa) active site. Experiments show that cleavage at Arg-320 occurs most frequently. Thus, no channeling or ratcheting is required, consistent with the reduced average data model (Fig. 4) .i.e. Occam’s razor applies.
Figure 6.
Two loop conformations of Arg-320 and Arg-271. Arg320 is positioned in a loop region composed of almost 41-residues (Gly294-Trp334). On the other hand, Arg271 is positioned in a loop region composed of almost 44-residues (Glu249-Asp292). Sequence of the loop region including Arg-320 is GLRPLFEKKSLEDKTERELLESYIDGRIVEGSDAEIGMSPW. Sequence of the loop region including Arg-271 is EEAVEEETGDGLDEDSDRAIEGRTATSEYQTFFNPRTFGSGEAD.
An interesting connection can be made with the simulation structure discussed above and a recent X-ray crystallographic structure (2.1Å resolution) of human meizothrombin desF1 [24]. This crystal structure shows a well-defined Na+ binding site involving three residues, one of which is near the crucial S1 site of the Sp domain. An earlier X-ray crystal structure of bovine meizothrombin [19], while at lower resolution (3.1Å), also shows the same Na+ binding site architecture and overall overlays closely with the higher resolution desF1 structure. The connection is that our modeled prothrombin Sp-K2 structure (based on the bovine meizothrombin structure [19] and a structure for prethrombin-2 [20]) prior to equilibration dynamics and with no sodium ion(s) also predicts the Na+ binding site. This is not surprising. What is surprising, however, is that after 24ns of solvent equilibration of our II 3D model, although the overlay of the simulation structure is very similar to the initial modeled structure, the Na+ binding site is no longer recognizable. Thus, our simulation structure modeled without Na+ present is a candidate for being an E*-analog prothrombin structure, E* being the proposed non-active, no Na+-bound form of meizothrombin desF1 [24] and thrombin [25]. Studies are in progress to secure a simulation structure of prothrombin which has Na+ bound in the proposed Na+ binding site.
In this study, we also tested a major conclusion of the NG work [8], i.e. is it valid to throw out the one form model of prothrombinase for the activation of prothrombin? We believe that it is not. The data can be well accommodated by both solving the differential equations directly as shown in Fig. 3. How then did the NG [8] manage to curve fit the data reasonably with their set of model equations which have intrinsic mathematical errors? The answer is (apparently) that they applied a curve fitting procedure without solving the appropriate differential equations initially. But curve fitting can be somewhat blind to the correctness of the equations and so it is possible that a reasonable fit was obtained with incorrect equations. The one form prothrombinase model (reduced to 12 rate constants) is not, of course, proven by our work here. (See, for instance, Fig. S9 in Supporting material for a very simplified model that may provide an even additionally reduced model) What we have established is that the NG data [8] and KG data [9] have their limitations violating the requirement for conservation of mass. The set of differential equations (Eqns. 1–13, corrected from Ref.8) that represents the one form model of prothrombinase leads to a reasonable fit to the averaged data from NG and KG. Thus, the one form model cannot be ruled out.
Supplementary Material
Acknowledgments
This work was supported by the National Institute of Health (HL-06350) and the National Science Foundation (FRG DMR 084549).
Footnotes
Publisher's Disclaimer: This is a PDF file of an unedited manuscript that has been accepted for publication. As a service to our customers we are providing this early version of the manuscript. The manuscript will undergo copyediting, typesetting, and review of the resulting proof before it is published in its final citable form. Please note that during the production process errors may be discovered which could affect the content, and all legal disclaimers that apply to the journal pertain.
References
- 1.Ortel TL, Kane WK, Keller FG. Molecular basis of thrombosis and hematostasis. In: High KA, Roberts HR, editors. Factor V. Marcel Dekker; New York: 1995. p. 119. [Google Scholar]
- 2.Jackson CM, Nemerson Y. Blood coagulation. Annu Rev Biochem. 1980;49:765–811. doi: 10.1146/annurev.bi.49.070180.004001. [DOI] [PubMed] [Google Scholar]
- 3.Owen NG, Esmon CT, Jackson CM. The conversion of prothrombin to thrombin. J Biol Chem. 1974;249:594–605. [PubMed] [Google Scholar]
- 4.Krishnaswamy S, Mann KG, Nesheim ME. The prothrombinase-catalyzed activation of prothrombin proceeds through the intermediate meizothrombin in an ordered, sequential reaction. J Biol Chem. 1986;261:8977–8984. [PubMed] [Google Scholar]
- 5.Walker RK, Krishnaswamy S. The activation of prothrombin by the prothrombinase complex. J Biol Chem. 1994;269:27441–27450. [PubMed] [Google Scholar]
- 6.Boskovic DS, Bajzar LS, Nesheim ME. Channeling during prothrombin activation. J Biol Chem. 2001;276:28686–28693. doi: 10.1074/jbc.M101813200. [DOI] [PubMed] [Google Scholar]
- 7.Brufatto N, Nesheim ME. Analysis of the kinetics of prothrombin activation and evidence that two equilibrating forms of prothrombinase are involved in the process. J Biol Chem. 2003;278:6755–6764. doi: 10.1074/jbc.M206413200. [DOI] [PubMed] [Google Scholar]
- 8.Kim PY, Nesheim ME. Further evidence for two functional forms of prothrombinase each specific for either of the two prothrombin activation cleavages. J Biol Chem. 2007;282:32568–32581. doi: 10.1074/jbc.M701781200. [DOI] [PubMed] [Google Scholar]
- 9.Orcutt SJ, Krishnaswamy S. Binding of substrate in two conformations to human prothrombinase drives consecutive cleavage at two sites in prothrombin. J Biol Chem. 2004;279:54927–54936. doi: 10.1074/jbc.M410866200. [DOI] [PubMed] [Google Scholar]
- 10.Nesheim ME, Taswell JB, Mann KG. The contribution of factor V and factor Va to the activity of prothrombinase. J Biol Chem. 1979;254:10952–10962. [PubMed] [Google Scholar]
- 11.Krishnaswamy S, Church WR, Nesheim ME, Mann KG. Activation of human prothrombin by human prothrombinase. J Biol Chem. 1987;262:3291–3299. [PubMed] [Google Scholar]
- 12.Krishnaswamy S. Exosite-driven substrate specificity and function in coagulation. J Thromb Haemost. 2005;3:54–67. doi: 10.1111/j.1538-7836.2004.01021.x. [DOI] [PubMed] [Google Scholar]
- 13.Bianchini EP, Orcutt SJ, Panizzi P, Bock PE, Krishnaswamy S. Ratcheting of the substrate from the zymogen to proteinase conformations directs the sequential cleavage of prothrombin by prothrombinase. Proc Natl Acad Sci U S A. 2005;102:10099–10104. doi: 10.1073/pnas.0504704102. [DOI] [PMC free article] [PubMed] [Google Scholar]
- 14.Hacisalihoglu, Panizzi P, Bock PE, Camire RM, Krishnaswamy S. Restricted active site docking by enzyme-bound substrate enforces the ordered cleavage of prothrombin by prothrombinase. J Biol Chem. 2007;282:32974–32982. doi: 10.1074/jbc.M706529200. [DOI] [PMC free article] [PubMed] [Google Scholar]
- 15.http://www.mathworks.com/support/tech-notes/1500/1510.html
- 16.MATLAB 7.4 (R2007a) MATLAB®
- 17.xyExtractor Graph Digitizer Version 4.1. 2008. [Google Scholar]
- 18.Lee CJ, Lin P, Chandrasekaran V, Duke RE, Everse SJ, Perera L, Pedersen LG. Proposed structural models of human factor Va and prothrombinase. J Thromb Haemost. 2007;6:83–89. doi: 10.1111/j.1538-7836.2007.02821.x. [DOI] [PubMed] [Google Scholar]
- 19.Martin PD, Malkowski MG, Box J, Esmon CT, Edwards BFP. New insghts into the regulation of the blood clotting cascade derived from the X-ray crystal structure of bovine meizothrombin des F1 in complex with PPACK. Structure. 1997;5:1681–1693. doi: 10.1016/s0969-2126(97)00314-6. [DOI] [PubMed] [Google Scholar]
- 20.Friedrich R, Panizzi P, Fuentes-Prior P, Richter K, Verhamme I, Anderson PJ, Kawabata S, Huber R, Bode W, Bock PE. Staphylocoagulase is a prototype for the mechanism of cofactor-induced zymogen activation. Nature. 2003;425:535–539. doi: 10.1038/nature01962. [DOI] [PubMed] [Google Scholar]
- 21.Sâli A, Blundell TL. Comparative protein modelling by satisfaction of spatial restraints. J Mol Biol. 1993;234:779–815. doi: 10.1006/jmbi.1993.1626. [DOI] [PubMed] [Google Scholar]
- 22.Case DA, Darden TA, Cheatham TE, III, Simmerling CL, Wang J, Duke RE, Luo R, Merz KM, Pearlman DA, Crowley M, Walker RC, Zhang W, Wang B, Hayik S, Roitberg A, Seabra G, Wong KF, Paesani F, Wu X, Brozell S, Tsui V, Gohlke H, Yang L, Tan C, Mongan J, Hornak V, Cui G, Beroza P, Mathews DH, Schafmeister C, Ross WS, Kollman PA. AMBER. Vol. 9. University of California; San Francisco: 2009. [Google Scholar]
- 23.Jorgensen WL, Chandrasekhar J, Madura JD, Impey RW, Klein ML. Comparison of simple potential functions for simulating liquid water. J Chem Phys. 1983;79:926–935. [Google Scholar]
- 24.Papaconstantinou ME, Gandhi PS, Chen Z, Bah A, Di Cera E. Na+ binding to meizothrombin desF1. Cell Mol Life Sci. 2008;65:3688–3697. doi: 10.1007/s00018-008-8502-7. [DOI] [PMC free article] [PubMed] [Google Scholar]
- 25.Niu W, Chen Z, Bush-Pelc LA, Bah A, Gandhi PS, Di Cera E. Mutant N143 reveals how Na+ activates thrombin. J Biol Chem. 2009;284:36175–36185. doi: 10.1074/jbc.M109.069500. [DOI] [PMC free article] [PubMed] [Google Scholar]
Associated Data
This section collects any data citations, data availability statements, or supplementary materials included in this article.


