1. Introduction
Since its discovery in the 1940's, magnetic resonance (MR) spectroscopy (MRS) has developed into a major technique used by chemists to elucidate molecular structures. The underlying principle of MRS is the generation of radiofrequency (RF) signals by magnetic nuclear spins that are excited with a specific RF to precess in an external magnetic field B0. The magnetic resonance frequency ω0 is linearly dependent on B0 and the gyromagnetic ratio of the nucleus γ, as ω0 = γB0. The MR signal intensity depends on the concentration of nuclear spins, the magnetic field strength B0, and the gyromagnetic ratio γ of these spins. The magnetization signal in MRS is characterized by two rate constants, the spin-lattice (or longitudinal relaxation time) T1, and the spin-spin (or tranverse relaxation time) T2. Since the resonance frequency of a particular nucleus is dependent upon its molecular structure, an important aspect of MRS is the ability to distinguish a nucleus with respect to its environment in the molecule. Because the molecular structure-based frequency shift and the resonance frequency are directly proportional to the strength of the magnetic field, the frequency shift is converted into a field-independent dimensionless value known as the chemical shift. Since the frequency shifts are extremely small in comparison to the resonance frequency, the chemical shift is expressed in parts per million (ppm). The chemical shift is typically reported relative to a reference resonance frequency. MRS therefore provides information about the chemical environment of the nuclear spin such as number of chemical bonds, neighboring nuclei, and overall chemical structure. As a result, each peak in an MR spectrum has a characteristic chemical shift that is dependent upon the chemical structure of the metabolite or compound, and a peak area that is proportional to the concentration of the compound. Scalar spin-spin interactions, or J-couplings, produce fine multiplet structures that can be used to further analyze the chemical structure of a given molecule.
Within the past two decades, the same principles of chemical shifts, magnetic moments, relaxation rates, and deriving concentrations from peak integrals have been applied in several preclinical and clinical studies to advance cancer discovery, diagnosis, and treatment. Incorporating imaging techniques with MRS has resulted in the development of MR spectroscopic imaging (MRSI) where the chemical information is spatially phase encoded,1–3 providing images of specific chemical compounds such as metabolites, reporter probes, labeled substrates, or drugs. The purpose of this article is to review recent developments and examples of the use of multi-nuclear MRS in cancer, and its integration with multi-modality imaging in cancer discovery and treatment.
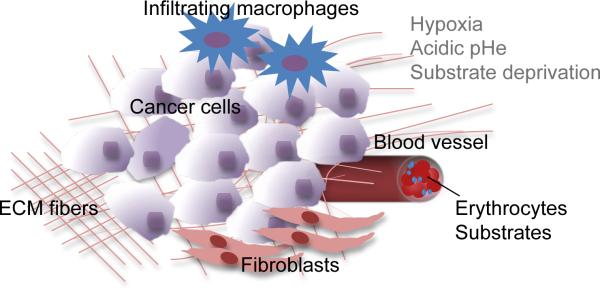
The ability of cancer cells to adapt and survive treatments, and the collateral damage to normal cells as a result of several cancer treatments, continue to make the successful treatment of cancer a major challenge for the twenty first century. Tumor recurrence and metastasis are the leading causes of morbidity and mortality from cancer and, despite major advances in cancer research and treatment, cancer continues to evade cure. This is not surprising given the complexities of a tumor, and the genomic plasticity of cancer cells and stromal cells that are co-opted within the tumor. A schematic of the different components of a tumor is shown in Figure 1.
Figure 1.
Schematic of the components of a tumor. Cancer cells are embedded within the extracellular matrix (ECM). The ECM consists of a complex meshwork of structural extracellular proteins. The tumor microenvironment (TME) contains the ECM and stromal cells such as endothelial cells, fibroblasts, and macrophages that are co-opted by the tumor. The TME is typically characterized by hypoxia, acidic extracellular pH, and substrate depletion.
Physiological conditions such as hypoxia and acidic extracellular pH (pHe) that exist in the tumor microenvironment, the interactions between cancer cells and stromal cells such as endothelial cells, fibroblasts and macrophages, the extracellular matrix, and the numerous secreted factors and cytokines cumulatively influence progression, aggressiveness, and response of the disease to treatment. Hypoxia, in particular, is a major cause of radio- and chemo-resistance in cancer cells. Because of the remarkable ability of cancer cells to adapt and survive, finding effective treatments against cancer depends upon identifying and attacking targets and pathways critically important for the cancer cell. Multi-nuclear MRS provides unique opportunities for molecular and functional imaging of cancer in preclinical and clinical studies, and for imaging interactions between cancer cells and stromal cells. Some of these applications of MRS, the nuclei commonly studied, and the information that can be obtained are summarized in Table 1. From this table it is apparent that multi-nuclear noninvasive MRS methods have wide-ranging applications in cancer that can translate from bench to beside. The chemical structures of various compounds referred to in this review article are summarized in Tables 2 and 3. Table 3 also provides details regarding administration and dose of the contrast agents described here.
Table 1.
Nuclei commonly studied in order of sensitivity of detection and some of their preclinical (+) and clinical (*) applications in cancer. The intensity of the MR signal depends on the concentration of nuclear spins, and the gyromagnetic ratio γ of the spins. The detection limits of 1H and 19F MRS are typically within the mM range, with higher concentrations required for less-sensitive nuclei such as 31P and 13C.
| Nucleus | γ [MHz/T] | Sensitivity of detection | Applications |
|---|---|---|---|
| 1H | 42.58 |

|
|
| 19F | 40.08 |
|
|
| 31P | 17.25 |
|
|
| 13C | 10.71 |
|
Table 2.
Chemical structures of metabolites referred to in this review article.
| Compound Name | Chemical Structure | Detected Nuclei | References |
|---|---|---|---|
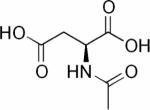
| N-acetyl aspartate |
|
1H | 18 – 22 |
| Citrate |

|
1H | 18 – 22 |
| Glucose, [1-13C]-/[U-13C]-glucose |
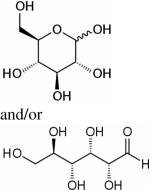
|
1H, 13C, hyperpolarized 13C | 15–18,63–68,71 |
| Lactate, [3-13C]-lactate |
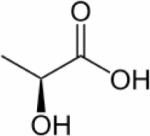
|
1H, 13C, hyperpolarized 13C | 15–18,63–68,71 |
| Pyruvate |
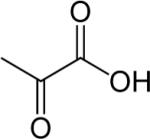
|
1H, hyperpolarized 13C | 70,71,196 |
| [1,4-13C2]-fumarate |

|
Hyperpolarized 13C | 70,196 |
| Choline (Cho) |

|
1H, 31P | 75 – 81 |
| Phosphocholine (PC) |

|
1H, 31P | 75 – 81 |
| Glycerophosphocholine (GPC) |
|
1H, 31P | 75 – 82 |
| Phosphoethanolamine (PE) |

|
1H, 31P | 82 – 84 |
| Glycerophosphoethanolamine (GPE) |
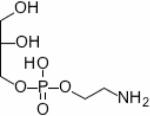
|
1H, 31P | 82 – 84 |
| Triacylglycerides, example of C55H98O6, palmitic acid, oleic acid, alpha-linolenic acid (from top to bottom) |

|
1H | 89 – 95 |
| Nucleoside triphosphates (NTP), example of ATP |

|
31P | 57,58,96–101 |
| Nucleoside diphosphates (NDP), example of ADP |

|
31P | 57,58,96–101 |
| Phosphocreatine (PCr) |

|
31P | 57,58,96–101 |
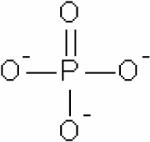
| Inorganic phosphate (Pi) |
|
31P | 57,58,96–101 |
Table 3.
Chemical structures of reporter molecules referred to in this review article.
| Compound Name | Chemical Structure | Detected Nuclei | Reported Property | Required Concentration | References |
|---|---|---|---|---|---|
| Hexamethyldisiloxane (HMDSO) |

|
1H | Oxygen Tension | Direct tissue injection of 50 μl pure HMDSO11 | 11,126 |
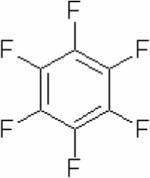
| Hexafluorobenzene (HFB) |
|
19F | Oxygen Tension | Direct tissue injection of 40 μl pure HFB125 | 125,126 |
| Nitroimidazoles, for example 2-Nitro-α-[(2,2,2-trifluoroethoxy)methyl]-imidazole-1-ethanol (TF-MISO) |

|
19F | Oxygen Tension | 75 mg/kg intravenous injection of TF-MISO (dissolved in saline)129 | 128 – 130 |
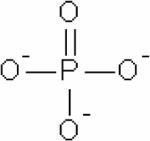
| Inorganic phosphate (Pi) |
|
31P, pH-dependent, chemical shift | pH, mostly pHi | Endogenous, ~1 mM | 57,58,96–101 |
| 3-aminopropylphosphonate (3-APP) |

|
31P | pHe | Intraperitoneal injection of 0.3 ml of 63.8 mg/ml 3-APP in saline136 | 136,207 |
| 2-imidazole-1-yl-ethoxy carbonyl propionic acid (IEPA) |

|
1H | pHe | Intraperitoneal injection of 0.15 ml of 310 mM IEPA solution per 25 mg mouse137,142,148 | 137,142,148 |
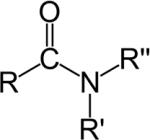
| Endogenous amide hydrogens in proteins |
|
1H CEST | Endogenous tissue pH, biodegradable molecular imaging reporter | ~50 mM | 112,113,149 |
| Paramagnetic lanthanide chelates (ParaCEST), for example EuCNPHC3+ |

|
1H ParaCEST | No in vivo studies available | ~10 mM | 150 – 153 |
| Bicarbonate, ratio of H13CO3− to 13CO2 |

|
Hyper-polarized 13C | Tissue pH | Catheter-based intravenous injection of 0.2 ml of 100 mM hyperpolarized H13CO3− solution155 | 155 |
| [5-19F]-fluorouracil (5-FU) |
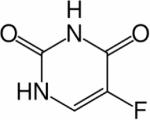
|
19F | Drug Delivery and Metabolism of Chemotherape utic Agent 5-FU | Humans are given a ~0.7 mM dose of [5-19F]- FU199 | 199 |
| [5-19F]-fluorocytosine (5-FC) |

|
19F | Pro-drug Therapy | Intraperitoneal injection of 5-FC at a dose of 450 mg/kg201 | 201 |
| [13C]-temozolomide (TMZ) |
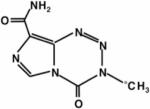
|
13C | Drug Delivery of TMZ | Catheter-based intraperitoneal infusion of 0.3 ml of 3 mg/ml [13C]TMZ in saline204 | 204 |
The past decade has seen major advances in sequence design, development of novel reporter probes, and technological advances that have significantly increased the uses of MRS in molecular and functional imaging applications in oncology. Some of the recent applications of 1H, 13C, 31P, and 19F MRS in preclinical models of cancer are reviewed, and examples of biomedical MRS applications for each nucleus are shown in Figure 2. New developments, such as hyperpolarization of spins to increase the sensitivity of detection of the MR signal of 13C-labeled substrates are discussed. Advantages and limitations of the spectroscopic techniques and challenges for the future are outlined.
Figure 2.
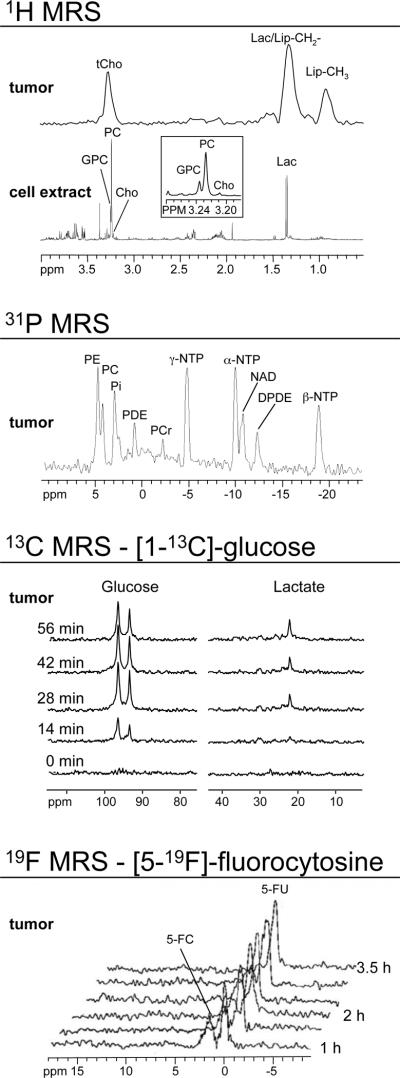
Examples of multi-nuclear MRS applications. From top to bottom: Representative in vivo single-voxel 1H MRS of an MDA-MB-231 breast tumor xenograft model obtained at 4.7T, and ex vivo high-resolution 1H MRS of a water-soluble MDA-MB-231 cell extract obtained at 11.7T.17 The insert shows an expanded region around 3.2 ppm demonstrating that human breast cancer cells exhibit low GPC levels, high PC levels and high levels of total choline-containing metabolites. Representative in vivo single-voxel 31P MRS of an MDA-MB-231 breast tumor model obtained at 4.7T.191 Time course of in vivo 13C MRS of a RIF-1 tumor obtained at 9.4T using heteronuclear cross polarization.52 The animal was injected with 900 mg/kg of [1-13C]-labeled D-glucose. The glycolytic rate of the tumor can be determined by kinetic analysis of [3-13C]-lactate build-up. Representative in vivo 19F MRS of the conversion of prodrug to anticancer drug in an MDA-MB-231 breast tumor model.201 The animal was injected with 450 mg/kg of [5-19F]-fluorocytosine at 24 h after injection of a cytosine deaminase-containing nanoplex, and the conversion of the pro-drug [5-19F]-fluorocytosine to the anticancer drug [5-19F]-fluorouracil was followed by 19F MRS at 4.7T. Assignments: Cho, free choline; 5-FC, [5-19F]-fluorocytosine; 5-FU, [5-19F]-fluorouracil; GPC, glycerophosphocholine; GPE, glycerophosphoethanolamine; NAD, nicotinamide adenine dinucleotide; DPDE, diphosphodiester; NDP, nucleoside diphosphate; NTP, nucleoside triphosphate; Lac, lactate; Lip-CH2-, methylene groups of mobile lipids; Lip-CH3, methyl groups of mobile lipids; PC, phosphocholine; PE, phosphoethanolamine; PCr, phosphocreatine; Pi, inorganic phosphate; tCho, total choline-containing compounds (Cho+PC+GPC). Adapted from +++17,52,191,201.
The use of MR biomarkers such as the total choline (tCho) signal and perfusion are already being explored clinically for characterizing tumors and following treatment response.4–7 The elevation of choline compounds presents a unique target to exploit for molecular targeting; such targeting can be imaged noninvasively with MRS.8,9 Both pharmacological and molecular approaches are being developed to target choline metabolism, specifically choline kinase activity, which is the first step in choline phospholipid biosynthesis.
The interaction between cancer cells and the tumor microenvironment is providing new insights into the etiology and progression of cancer. For example, oxygen partial pressure (pO2) in tumors can be imaged by both 1H and 19F MRSI.10,11 Oxygen is sensed by administration of reporter molecules through changes in the spin-lattice relaxation rate. Integrating MRSI with MRI and other imaging modalities such as optical and nuclear imaging is providing useful insights into the dynamics between hypoxia and the tumor extracellular matrix (ECM), vascularization, extracellular pH, interstitial fluid transport, and metabolism in preclinical models.12–14 These insights can be exploited to find effective treatment strategies.
2. Metabolic, Molecular, and Functional MRS of Cancer Cells and Their Microenvironment
2.1 Metabolic MRS
Along with, and frequently because of, aberrations in their genome and proteome, cancer cells exhibit a unique metabolic phenotype characterized by high glucose uptake, increased glycolytic activity and lactate production, decreased mitochondrial activity, low bioenergetic status, and aberrant phospholipid metabolism.15–18 In addition, tissue-specific metabolites such as N-acetyl aspartate in the brain, and citrate in the prostate, decrease as the cancer cell population in the tissue expands.18–22 The chemical structures of glucose, lactate, N-acetyl aspartate and citrate are shown in Table 2. MRS or MRSI detection of the 1H or 31P MRS signals of these endogenous metabolites can assist in the diagnosis of cancer,23–46 and in monitoring anticancer therapy in cases where these metabolites have been established as surrogate markers for a specific therapy, as discussed in Section 3.2. Detection of aberrant metabolism with MRS can also lead to the identification of enzymes as novel anticancer targets.9,17,47–51
Labeled Substrates
In addition to the detection of endogenous metabolites using 1H or 31P MRS, 13C MRS detection of 13C-labeled metabolites can be performed following administration of suitable 13C-labeled substrates in cancer cells and solid tumors to study glycolysis (see Figure 2) or other metabolic pathways such as choline metabolism.8 The flux of substrates through metabolic pathways can be evaluated by detecting the incorporation of 13C label into downstream metabolites and products with 13C MRS, followed by metabolic modeling. The relatively low sensitivity of 13C MRS can be improved by a number of magnetization transfer techniques such as nuclear Overhauser effect (NOE), heteronuclear cross-polarization (HCP) experiments,52 and indirect inverse detection methods.53 Such methods enable detecting 13C label with sensitivity close to that of 1H MRS, which significantly increases the detection sensitivity of 13C-labeled metabolites in vivo. Weak 13C signals are enhanced by transferring strong magnetization from the neighboring protons via space using dipole-dipole spin coupling (in NOE methods) or through chemical bonds via J-coupling between 13C and 1H spins. In direct detection methods such as NOE, distortionless enhancement by polarization transfer (DEPT), insensitive nuclei enhanced by polarization transfer (INEPT), and HCP the enhanced 13C signals are detected directly with broadband proton decoupling. In the indirect detection scheme, the magnetization is transferred from 1H to 13C and then back to protons in heteronuclear multiple quantum coherence (HMQC) and heteronuclear single quantum coherence (HSQC) methods. The 13C signals are thus detected indirectly as 1H frequencies with significantly enhanced sensitivity due to the higher gyromagnetic ratio γ of 1H.53
Glucose/Lactate
Cancer cells exhibit high glycolytic activity even in the presence of oxygen,54,55 an observation made by Otto Warburg in 1930 and subsequently called the `Warburg Effect'. The molecular mechanisms underlying this aerobic glycolysis are mediated, in part, through the stabilization of the hypoxia inducible factor alpha (HIF-1α).55 HIF-1α expression mediates the switch in glucose metabolism through the induction of lactate dehydrogenase, which converts pyruvate to lactate, and the inactivation of pyruvate dehydrogenase, the enzyme responsible for the conversion of pyruvate to acetyl-Coenzyme A.56 The poor blood flow in tumors and the resulting hypoxia also contribute toward increasing anaerobic glycolysis.57,58 Glucose uptake within cells also increases through up-regulation of glucose transporter GLUT-1 and -3 expression, and possibly others GLUTs.59,60 As a result, cancer cells rapidly metabolize glucose to form lactate. Intravenous infusion of [1-13C]-labeled glucose enables the investigation of glycolysis in vivo, and detection of the kinetics of [3-13C]-labeled lactate formation, as shown in the 13C MR spectra in Figure 2. Glucose uptake, delivery, and glycolytic breakdown, as well as lactate synthesis and clearance from the tumor can be derived by following the 13C-label of these substrates.61 Several factors, such as tumor hemodynamics, substrate supply, hypoxia, venous clearance, glucose supply, extent of necrosis, and degree of inflammatory cell infiltrate, contribute to lactate levels in tumors.62 Multiple signaling pathways and oncogenes can regulate glycolysis.54 Decreasing tumor oxygenation correlated with increasing glycolytic rate in a murine mammary carcinoma model in a study using volume localized 13C MRS with 1H-13C cross polarization to detect the conversion of [1-13C]-glucose to [3-13C]-lactate.63 Several studies showed that [1-13C]-labeled glucose is metabolized to lactate in poorly differentiated tumors.64–67 High-resolution (HR) 13C MRS studies of tumor or organ extracts from animals infused with [1-13C]- or [U-13C]-labeled glucose reveal complex 13C-labeling patterns of various metabolites that can provide insight into metabolic compartmentalization, shuttling of metabolites between cell types or organs, and metabolic fluxes.68 See Table 2 for the chemical structures of glucose, pyruvate, and lactate.
Hyperpolarization
The large increase of sensitivity introduced by the use of dynamic nuclear polarization (DNP) for solution-state magnetic resonance spectroscopy (DNP-MRS)69 for in vivo MRS and MRSI detection of hyperpolarized 13C-labeled substrates has revitalized 13C MRS studies.70,71 Theoretically, DNP can increase the detection sensitivity of hyperpolarized 13C-labeled substrates and their metabolites by as much as 10,000-fold, without background signal from nonpolarized material.70,71 DNP is based on polarizing nuclear spins in the solid state.72 The mechanism requires the availability of unpaired electrons, which are added to the sample as homogeneously distributed organic free radicals before cooling the sample.69 In the solid state, the high electron spin polarization is, in part, transferred to the nuclear spins by microwave irradiation, and subsequently brought into a liquid solution after rapid dissolution.69 With this method, it is possible to bring the polarized, cold, solid sample into solution while preserving its nuclear polarization for a short time, sufficient for spectroscopic imaging.69 However, complexities in terms of the chemistry of achieving hyperpolarization in the solid state, the appropriate free radicals, and the limited number of molecules amenable, reduce the achievable sensitivity. Commercial DNP-MR spectrometers and hyperpolarizers are currently becoming available. Elevated hyperpolarized lactate and possibly alanine produced from hyperpolarized [1-13C]-labeled pyruvate are being actively investigated as noninvasive biomarkers of cancer presence and histologic grade in preclinical models, which may be used in the future for the detection and management of cancer in humans.71 An alternative mechanism to hyperpolarize 13C nuclei includes the use of parahydrogen to hydrogenate multiple bonds in chemical structures containing enriched 13C isotopes (PASADENA).73,74 Parahydrogen based hyperpolarization requires 13C substrates with a specific chemical structure, which may limit its general applicability in comparison to DNP-based methods.
Choline phospholipid metabolism
Choline phospholipid metabolism is significantly altered in cancers, as validated by several preclinical and clinical studies.75–79 Almost all cancers display elevated phosphocholine (PC) and increased total choline-containing metabolites (total choline, tCho).75–79 A switch from high glycerophosphocholine (GPC)/low PC to low GPC/high PC can be detected following malignant transformation in breast80 and ovarian81 cancer cells by HR 1H or 31P MRS of cell extracts (see 1H MRS of cell extract in Figure 2). These metabolic changes can be detected in vivo, and in biopsied tumor tissue ex vivo by 1H or 31P MRS of the endogenous metabolites. The predominant 1H MRS signals from water-soluble choline metabolism intermediates arise from the nine chemically equivalent protons in the choline –N(CH3)3 groups between 3.2 – 3.3 ppm. Because nine protons contribute to the signal, it displays a relatively higher signal intensity than 1H signals detected in chemical groups with fewer equivalent protons. Free choline (Cho) is typically detected at 3.21 ppm, PC at 3.23 ppm, and GPC at 3.24 ppm, measured at pH 7.4 with 3-(trimethylsilyl)propionic-2,2,3,3-d4 acid as a chemical shift reference, in HR MR spectra of cell or tissue extracts, or in HR magic angle spinning (MAS) MR spectra of biopsies. In the in vivo setting, the spectral resolution that can be achieved even at high magnetic fields is much lower, and unable to resolve Cho, PC, and GPC, as evident in the 1H MR spectra in Figure 2. Instead, an overlap of these three signals is detected as the tCho signal. The chemical structures of Cho, PC, and GPC are shown in Table 2.
Currently, clinical multi-center trials are underway to establish 1H MRS of a single voxel covering a region of interest, such as for example a lesion for breast cancer detection. Single-voxel 1H MRS detects a single localized MR spectrum. Alternatively in vivo 1H MRS imaging (MRSI) can be performed of one or multiple slice(s) through a region of interest. Multi-voxel techniques, in which multiple spectra are acquired over a slice or volume of tissue, enabling the detection of the spatial distribution of tCho (as well as other metabolites), are being developed. Such two-dimensional or three-dimensional MRSI have been used to detect elevated tCho in vivo in several types of cancer as discussed in Section 3. The phosphorus-containing choline metabolites can also be detected with 31P MRS, as shown in Figure 2. HR 31P MR spectra of extracts detect PC at 3.9 ppm and GPC at 0.5 ppm, upon chemical shift calibration to a reference compound, such as methylene diphosphonic acid at 18 ppm. Phosphorus MRS in vivo detects a mixed phosphomonoester (PME) signal comprising unresolved PC and phosphoethanolamine (PE) resonances, and a mixed phosphodiester (PDE) signal comprising unresolved GPC and glycerophosphoethanolamine (GPE) resonances. PC and PE, and/or GPE and GPC, can be partially resolved in clinical studies by using 1H-decoupled 31P MRS techniques at 1.5 T,82 and at higher field strengths that are clinically available, such as 3T. However, in vivo clinical studies often favor 1H MRS because of its higher sensitivity and better availability on clinical scanners when compared to 31P MRS. Neither 1H nor 31P MRS in routine in vivo settings are able to spectrally resolve Cho, GPC, and PC as individual signals. As a consequence, non-invasively detected PME, PDE, and tCho changes in in vivo 31P and 1H MR spectra, often arise from changes in the concentrations of several different metabolites. In some cases, this can be overcome by acquiring consecutive proton-decoupled 31P and 1H MR spectra.83 Recently, a novel 1H to 31P polarization transfer method was developed on a clinical 3T MR scanner, which improved the signal-to-noise ratio by more than twofold compared to direct 31P MRS methods.84 This method achieved 1H to 31P polarization transfer by applying chemical shift selective refocusing pulses at 3T, which cancelled the homonuclear J-coupling effects that attenuate 31P signals in PE, PC, GPE, and GPC in previous refocused INEPT experiments.84 The method allowed the identification of these four metabolites in human brains with a voxel size of 2 × 2 × 2 cm3 in a three-dimensional MRSI data set.84 The chemical structures of these metabolites are shown in Table 2.
The increased PC levels observed in cancer cells and tumors result from increased expression and activity of choline kinase,48–50 a higher rate of choline transport,85,86 and increased phospholipase C and D activity.81,87 These enzymes, amongst others, are involved in the biosynthetic and breakdown pathways of the major membrane phospholipid phosphatidylcholine (PtdCho), the precursors and breakdown products of which are GPC, PC, and Cho.8 Some of these enzymes, such as choline kinase9,17,47–51 and PtdCho-specific phospholipase D88 and C,81 have recently been developed for MRS-monitored, targeted anticancer therapies, mediated by gene silencing or enzyme inhibition, as discussed in detail in Section 3.2. Enzymes in choline phospholipid metabolism are influenced by growth factor signaling, cytokine action, oncogene activation, and chemical carcinogenesis.17,75,76 The chemical structures of choline- and ethanolamine-related compounds are shown in Table 2.
Mobile lipids
In vivo single-voxel 1H MRS and MRSI detect several signals that are related to choline and lipid metabolism, such as the total choline (tCho) signal at 3.2 ppm, the methylene signal at 1.3 ppm, and the methyl signal at 0.9 ppm (see representative 1H MR spectra in Figure 2). These methylene and methyl signals arise from CH2 and CH3 groups in mobile lipids located in the cytoplasm of intact cancer cells, or in the intercellular space of solid tumors.89,90 The lipid signals at 1.3 and 0.9 ppm detected in intact cells and tumors in vivo have been assigned to the fatty acid acyl chains in triacylglycerides (see Table 2 for chemical structure) that form mobile lipid droplets.89,90 The low mobility of membrane lipids limits their detection by MRS in vivo, and therefore membrane lipids do not contribute to these lipid signals at 1.3 and 0.9 ppm.89,90 These lipid signals overlap with various other signals, such as lactate at 1.3 ppm, and spectral editing is required to separate these signals. Additional signals at 5.4 and 2.8 ppm can be assigned to mobile polyunsaturated fatty acyl chains to assess polyunsaturation of mobile lipids90, although the signal at 5.4 ppm is difficult to detect due to its proximity to the large water signal at 4.7 ppm. High-grade human gliomas displayed significantly higher levels of lipid than low-grade gliomas, suggesting that the lipid signal at 1.3 ppm may prove useful in tumor grading.89 Lipid droplets in tumors were also shown to correlate with drug resistance or response.89 The cytoplasmic accumulation of triacyglycerides in cancer cells and tumors has been attributed to such diverse biological processes as hypoxia, degeneration of mitochondria, differentiation, growth arrest, and apoptotic cell death.89–91 Triacyglycerides are formed from increased diacylglycerol and triacyglycerol biosynthesis in lipid metabolism.90,91 Changes in the mobile lipid signal have also been observed following apoptosis, necrosis, or lipid droplets formation.92–94 MRS-visible lipids accumulate with apoptosis,95 suggesting that this signal may serve as a surrogate marker for apoptosis, detected in vivo by 1H MRS.
Energy Metabolism
While 31P MRS is useful for detecting energy metabolism in vivo,96–99 it suffers from poor sensitivity, and therefore its use has declined in recent years, especially for clinical studies. Solid tumors contain nucleoside triphosphates (NTP), nucleoside diphosphates (NDP), phosphocreatine (PCr), and inorganic phosphate (Pi), all of which can be detected in 31P MR spectra (see Figure 2). The chemical shift of the Pi resonance can be used to calculate the pH of the tumor as outlined in Section 2.3. Due to the Warburg effect, the bioenergetic state of cancer cells is relatively low.54 Since the production of high energy phosphates such as NTP and PCr depend on glucose and oxygen, which are delivered to tumors through blood vessels, energy metabolism is tightly coupled to tumor blood flow,100,101, and decreases in hypoxic regions. Vaupel et al.57,58 observed a significant positive correlation between the 31P MRS-detected ratios of PCr/Pi and NTP/Pi with tumor oxygenation. In preclinical studies, 31P MRS may be useful in detecting blood flow mediated changes in tumor reoxygenation102 during radiation therapy.103 The chemical structures of high-energy phosphates are shown in Table 2.
HR-MAS MRS
High-resolution magic angle spinning (HR MAS) 1H MRS is a relatively new technology for examining intact biological tissue ex vivo, such as biopsy specimens, at high spectral resolution.22,104–109 One of the advantages of HR MAS 1H MRS, in comparison to HR MRS of extracts, is that the tissue can be used subsequently for histologic, biochemical, and genetic analysis.22,104–109 HR MAS 31P MRS is sensitive enough to be a potential future tool for assessing phospholipid metabolism in tumor samples prior to histopathologic examination.110
2.2 Molecular MRS
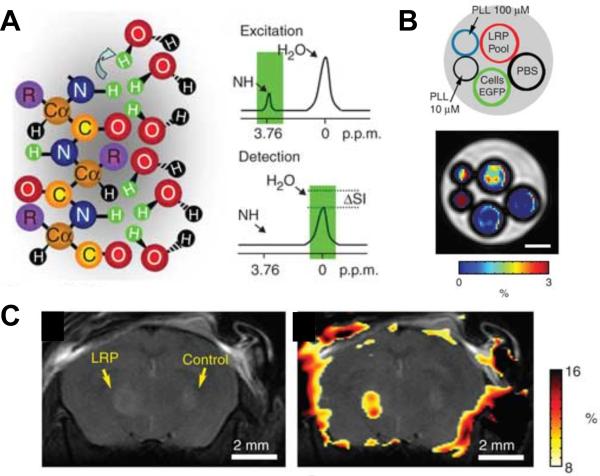
Magnetization transfer (MT) is a frequency selective MR technique that can be employed to evaluate 1H and other nuclei chemical exchange to study chemical reactions.111 Proton chemical-exchange-dependent saturation transfer (CEST) can provide, among other applications, a strategy to measure pH in vivo as outlined in Section 2.3. Exogenous CEST-contrast agents have been tested, demonstrating the feasibility of detecting a CEST-based MRI contrast agent.112 Detecting amide protons of endogenous mobile cellular proteins and peptides (see Table 3 for chemical structure, chemical shift of 8.3 ± 0.5 ppm) that undergo proton exchange with water has been demonstrated by 1H MRS and MRI.113 Amide proton CEST contrast was achieved by selectively irradiating amide protons with a radiofrequency pulse at 8.3 ppm; water was imaged after several seconds of transfer, and the MT ratio asymmetry parameter calculated.113 Recently, a novel nonmetallic, biodegradable, lysine rich-protein (LRP) reporter was genetically engineered to provide a CEST reporter protein with frequency-selective contrast,114 as demonstrated in Figure 3. Similar to fluorescent proteins in optical imaging, such CEST reporter proteins can be used for molecular imaging studies in gene promoter or gene expression studies, in which 1H MRI is used as the imaging modality. Figure 3A shows the principle of CEST. Frequency-selective radiofrequency pulses saturate the excitation of amide protons in LRP, which exchange with water protons and decrease the detected signal intensity (SI) of the water signal. Figure 3B and C show that ex vivo and in vivo LRP reporter imaging is feasible. To date, several different polypeptides have been tested for their feasibility as “multicolor” CEST reporters.115 These different CEST reporter proteins can be assigned artificial colors based on their particular amino acid units (lysine, arginine, threonine, or serine), which lead to different resonance frequencies of the exchangeable protons in different CEST reporters.115 These new CEST agents are potentially suitable for designing MR reporter genes for cell and tumor imaging, and for distinguishing multiple targets within the same MR image.115
Figure 3.
CEST imaging of lysine rich–protein (LRP) reporter. (A) Frequency-selective radiofrequency pulses excite the amide protons. These protons exchange with water protons, thereby reducing the MRSI signal intensity (SI) of the water signal by ΔSI. (B) Ex vivo proof-of-principle MRSI of the LRP reporter protein in phantoms demonstrated that the LRP-containing phantom displayed significantly higher ΔSI when excited at ±3.76 ppm as compared to poly-L-lysine, phosphate-buffered saline, or green fluorescent protein as controls (scale bar, 1 mm). (C) Anatomical image (left) and CEST signal intensity–difference map overlaid on the anatomical image (right) was able to distinguish the LRP-expressing and control tumor xenografts. Adapted from114.
2.3. The Tumor Microenvironment – Hypoxia and pH
The tumor microenvironment is usually characterized by areas of hypoxia, a neutral to alkaline intracellular pH (pHi), and an acidic extracellular pH (pHe).57 Hypoxia arises in tumors from the chaotic and abnormal vasculature that results in areas with poor oxygenation and substrate supply.116 If the hypoxia is severe enough, these areas will ultimately progress to form necrosis. pHi depends upon the buffering capacity of the cell, the efficiency of proton pumps in the plasma membrane, and the rate of proton production.117 Extracellular pH also depends upon these factors, and additionally, on the ability of the vasculature to clear the protons.117 Both hypoxia and an acidic pHe result in a more aggressive phenotype,118 and hypoxia results in radiation- and chemo-resistance.119 MRS reporters that noninvasively measure pH and oxygen tension are therefore useful for selecting treatments and following changes in these parameters during treatment. Since these parameters are spatially heterogeneous, techniques that provide spatial information are the most useful. Global unlocalized information, however, is also valuable for understanding cancer pathophysiology and for developing effective therapeutic strategies that target hypoxia and pH.
Imaging Hypoxia by MRS/I
Perfluorocarbons (PFCs) have been used as probes to measure pO2 using 19F MRS because their relaxivity is strongly dependent on the concentration of dissolved molecular oxygen.120–123 The advantages of 19F MRS-based oxygen probes are a relatively high sensitivity due to the large gyromagnetic ratio of the 19F nucleus, and the absence of endogenous 19F-containing molecules in the body. More recently, an analogous approach with 1H MRS has been developed using hexamethyldisiloxane (HMDSO).11 1H MRS has the highest sensitivity, but it is important that the reporter signal has a chemical shift that is well separated from metabolite signals and the water signal to avoid overlap. HMDSO has a single signal close to that of tetramethysilane and is therefore well separated from metabolites and water. Ideally, these reporters should also have a single resonance, low temperature sensitivity, and display a linear response to pO2. PFCs and HMDSO are poorly water-soluble, and therefore have to be administered as an emulsion. Intravenous administration of PFC emulsion results in uptake by the reticuloendothelial system, and the localization of the probe in the tumor periphery, which may skew measurements towards well perfused regions.124–126 Alternatively, similar to the use of an Eppendorf electrode, the probes can be injected directly into the tissue to report on oxygen tensions in regions of interest, with the advantage of being able to follow oxygenation over a period of time.127 Both 1H MRS-detected HMDSO and the symmetric 19F MRS-detected PFC hexafluorobenzene (HFB) have a single resonance and a temperature-insensitive, oxygen-dependent relaxivity.126 Both probes have previously been used to measure oxygen tensions in tumor models.126 The high sensitivity of 19F and 1H allow spatial localization for detection of these probes with an in-plane resolution of ~1 mm. The temporal resolution, which depends upon the ability to detect adequate signal at physiological non-toxic concentrations, is typically on the order of an hour or less. To date, these probes have not been used clinically.126 The chemical structures of HMDSO and HFB are shown in Table 3.
Qualitative measurements of tumor hypoxia have also been performed using 19F MRS of reporter molecules such as nitroimidazoles, which accumulate in hypoxic cells.128,129 Nitroimidazoles are reduced by one-electron nitroreductase enzymes under hypoxic conditions to form reduction products that bind to endogenous cellular molecules. In the activation reaction, the addition of the first electron to form a nitroradical anion is reversible in the presence of oxygen. Therefore the process is dependent on oxygen concentration, and an accumulation of these reporters can be used to estimate hypoxia.130 A potential problem is that two-electron reductases such as DT-diaphorase ([NAD(P)H:(quinone-acceptor) oxidoreductase, EC 1.6.99.2]) can reduce nitroimidazoles in two-electron steps, resulting in the reduction occurring independently of oxygen concentration.131,132 In addition, the adducts formed are short-lived.132
Imaging Tumor pH by MRS/I
In 1973, Moon and Richards observed that the chemical shift of intracellular phosphates in whole blood was sensitive to pH.133 This led to the development and use of the Pi peak to measure pH with MRS. Both intra- and extracellular Pi contribute to the Pi signal in vivo (see Table 3 for chemical structure). In tumors, the Pi signal is primarily of intracellular origin.134 As a result, the chemical shift of Pi reports on intracellular pH (pHi). Since tumors are highly glycolytic, the concept of an acidic tumor pH had become commonly accepted until 31P MRS of tumors demonstrated that tumor intracellular pH was typically neutral or alkaline.135 The subsequent development of an extracellular pH probe, 3-aminopropylphosphonate, 3-APP (for chemical structure see Table 3),136,137 allowed simultaneous detection of intra- and extracellular pH in tumors. These studies further confirmed that the extracellular pH (pHe) of tumors is acidic, while the intracellular pH (pHi) is neutral-to-alkaline. Acidic pHe has been observed to stimulate invasion in culture.138 pH can be increased in vivo by chronic or acute treatment with bicarbonate.139 Interestingly, a recent study has shown that mice treated with bicarbonate developed significantly fewer metastasis.140 Phosphorus MRS has been used to measure pHi in human cancers,75 but as yet probes to measure pHe in humans are not available. Other than acquiring spectra from 3–4 mm thick tumor slices or using large voxel sizes of ~ 6 × 6 × 6 mm3 localized on the tumor to avoid including signals from normal tissue, the low sensitivity of 31P MRS does not allow acquisition of spectra with high spatial resolution.
Several pH sensitive probes for 1H and 19F MRS141–144 have been used to measure localized tumor pH using MRSI with spatial resolutions approaching 1 × 1 × 1 mm3.137,142,145,146 These pH probes are based on imidazole compounds.141,146,147 One imidazole-based compound, 2-imidazole-1-yl-ethoxy carbonyl propionic acid (IEPA, for chemical structure see Table 3), has been used to image tumor pHe in several tumor models. Consistent with earlier findings, the probe reported an acidic and heterogeneous pHe.137,142,148 IEPA has also been used in combination with vascular MRI to obtain co-localized multi-parametric data sets.142 By combining MRSI of pHe with vascular MRI measurements it is possible to exploit the multi-parametric capability of MR to understand the dynamics between pHe and vascular parameters in tumors with different phenotypic characteristics.142
Chemical exchange saturation transfer (CEST) has also been used to measure pH by determining the rate of acid-catalyzed exchange of exogenous or endogenous amide hydrogens with bulk water.112,113,149 CEST is relatively insensitive, requiring more than a 50 mM concentration of exchangeable amides (chemical structure shown in Table 3). Although the sensitivity of detection can be improved by using pH-sensitive paramagnetic lanthanide chelates (ParaCEST, see Table 3 for the chemical structure of a representative example),150–152 this approach still requires ~10 mM contrast agent and is also concentration dependent. Therefore, it is necessary to determine the concentration of the probe.153 A recent approach of attaching a 19F-moiety on the same carrier as the pH-responsive paramagnetic complex provides a strategy to normalize the concentration of the probe.154
One exciting development in the use of MRS to measure tumor pHe is the application of hyperpolarized 13C-labeled bicarbonate (see Table 3 for structure).155 This nontoxic probe that can be infused in humans at relatively high concentrations, utilizes the cellular buffering systems to determine pHe. By DNP of 13C-bicarbonate, the sensitivity of 13C detection is increased by as much as 10,000-fold, which allows for 13C MRSI of tissues in vivo. The ratio of H13CO3− to 13CO2 is used to determine pH, assuming a pKa of 6.17. Initial preclinical studies demonstrated the feasibility of obtaining pHe maps with a spatial resolution of 2 × 2 × 6 mm3. The availability of such a nontoxic probe may be used, in the future, to image pH in humans not only in oncology but also in other disease processes with abnormal acid-base conditions.
3. MRS Applications in Diagnosis and Therapy Monitoring
3.1. Diagnosis
In vivo 1H MRS provides clinically useful information and is routinely implemented in the majority of clinical MR scanners.23,37,42,156–159 In addition to standard dynamic contrast-enhanced (DCE) MR imaging (MRI), quantitative 1H MRS and 1H MRSI measurements of tCho, in addition to other tissue-specific metabolites, are increasingly being implemented to diagnose primary malignant tumors in brain,23–34 prostate,35–38 and breast.39–46,160 The addition of MRS to standard MRI techniques can lead to significant improvements in sensitivity of up to 88%, in specificity of greater than 90%, and diagnostic accuracy of up to 91%. Choline phospholipid metabolism intermediates, among other metabolites, can also serve as robust biomarkers ex vivo, when analyzed in human biopsy specimens using HR 1H MRS or HR MAS 1H MRS. High tCho and PC concentrations have been used to identify meningiomas and recurrent astrocytomas in human brain tissue specimens,161 breast cancer in fine-needle aspirates of breast tumors,162 prostatic carcinoma in postsurgical prostate tissue samples,21 and well-differentiated liposarcomas in surgically resected fat tissue specimens.20
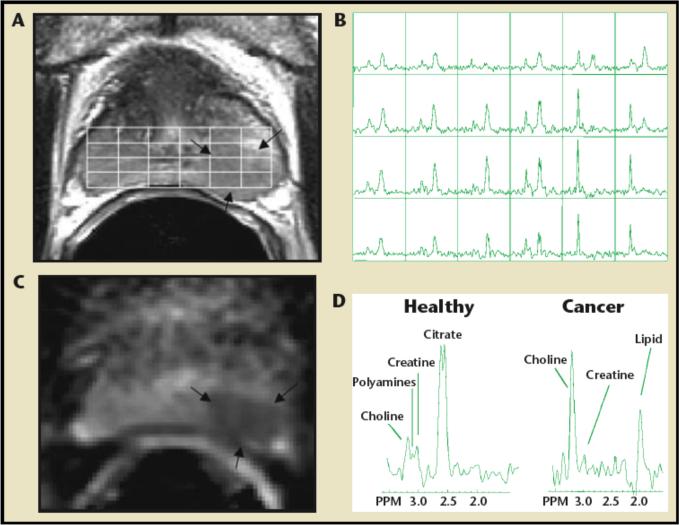
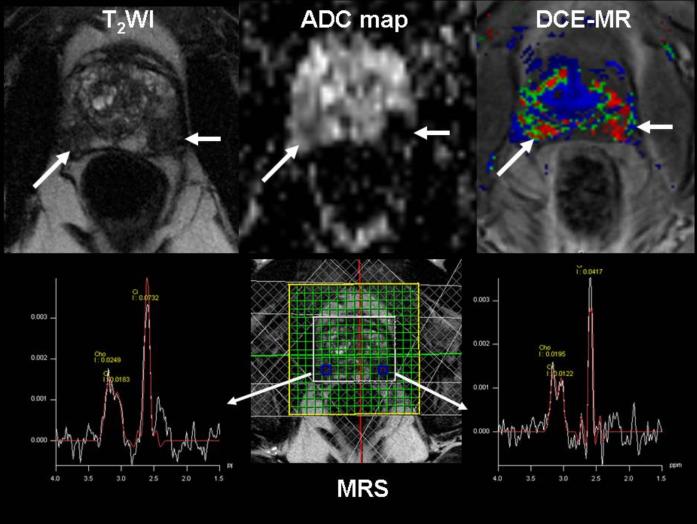
As discussed in detail in Section 2.1, significant spectral differences exist between normal tissue and tumors. One of the most reliable differences is observed in tCho, with low tCho concentration in normal tissue and high tCho levels in tumors.23,42,158,159 Proton MRS and MRSI can therefore be used clinically to help diagnose cancer, and to determine the margins of brain,23–25,163 prostate,158,159 and breast5,40–42,164,165 tumors, amongst others. Clinical 1H MRS detection of tCho can also help differentiate tumor recurrence from necrosis following anti-tumor treatment in brain166–168 or prostate.169 As single-voxel 1H MRS or MRSI detects changes in tCho and other metabolites such as creatine, N-acetyl-aspartate (NAA), and lactate (see Table 2), obtaining metabolite ratios can improve the specificity of detection. Figure 4 shows an example of multiparametric MR of the prostate that includes an apparent diffusion coefficient (ADC) map from diffusion-weighted imaging (DWI), and three-dimensional MRSI acquired at 1.5T. The three-dimensional MRSI spectral array in Figure 4B shows the presence of an aggressive tumor that contains elevated tCho and reduced citrate on the left side of the gland (right side of the image).170
Figure 4.
Combined MRI, DWI/ADC mapping, and MRSI of the prostate at 1.5T. (A) Axial T2-weighted image and three-dimensional MRSI spectral grid. The arrows indicate a region of prostate cancer. (B) Corresponding MRSI spectral array, showing the presence of an aggressive tumor (elevated total choline and reduced citrate) on the left side of the gland (right side of the image). (C) Image of the apparent diffusion coefficient of water demonstrates a region of prostate cancer (arrows) in the same location as the T2-weighted image and MRSI. (D) Representative spectra taken from the region of healthy prostate tissue (left) and prostate cancer (right). Adapted from170.
In current radiological practice, several MRI parameters, such as T2-weighted contrast, T1-weighted DCE-MRI, and DWI are combined to identify suspicious lesions in the prostate. Normal prostatic tissue has high T2-weighted MRI signal, whereas low T2-weighted MRI signal was found to correlate with pathological prostatic tissue.171 Studies at 3T have demonstrated an increase in sensitivity and specificity using T2-weighted MRI, presumably due to increased signal-to-noise and contrast-to-noise ratios, as shown in Figure 5. Despite the improvement in visualization of prostate morphology using T2-weighted MRI at 3T, there is a need for increased specificity, and for obtaining “functional” cellular and metabolic information from prostate tissue. This can be achieved by including MRSI.172 Adding MRSI can improve the reliable estimation of tumor margins and the extent of tumor infiltration into healthy tissue. However, a few benign and highly proliferative lesions can display relatively high tCho signals. In these cases, a differential diagnosis could be based on clinical information from other diagnostic scans.40–42,173 Another clinical application for single-voxel 1H MRS, as well as 1H MRSI, is in treatment planning for radiation174 or brachytherapy.175
Figure 5.
Demonstration of T2-weighted image, DWI/ADC map, MRS, and DCE-MRI of a 55 year old man with suspected prostate cancer (Gleason score =7). Multi-parametric MRI of the prostate gland revealed focal areas of “dark” T2 signal bilaterally with corresponding decreased ADC in the left/mid area of the gland (0.41±0.13×10⁻³ mm2/s) and 0.97±0.34×10⁻³ mm2/s on the right side (although a smaller region). DCE-MRI kinetics detect increased permeability and extra-vascular fraction in the right and left mid gland areas that are correlated to the Gleason score 7. Moreover, both sides show evidence of increased total choline and decreased citrate by MRS.
3.2. Monitoring Therapy
Some of the most sought after goals in cancer management are the development of noninvasive biomarkers that predict risk, allow early identification, assist in the selection of treatment, and detect response.176 Cancer cells have a remarkable ability to adapt and survive. Finding effective treatments against cancer depends upon identifying and attacking targets and pathways critically important for the cancer cell, with the additional caveat that each cancer represents an individual disease, and that no two cancers may be alike. As more critical targets in cancer cells are revealed, this decade is witnessing a transition in cancer treatment from the `sledgehammer' approach of conventional chemo- and radiotherapy toward specific molecular targeting. The success of these molecular targeted treatments critically depends upon the availability of noninvasive imaging techniques to select targeted therapies that would be most effective against a particular cancer, and to detect response.177 The identification of specific targets in cancer is also driving advances in novel image-guided platforms such as nanoparticles, liposomes, and microencapsulation devices to deliver small interfering RNA (siRNA)178 or drugs to down regulate these targets and pathways.
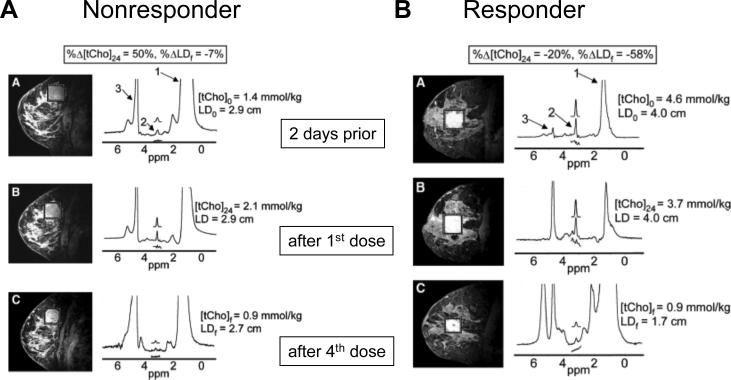
Detection of early therapeutic response following treatment with traditional cytotoxic drugs is critically important to minimize damage to normal tissue in nonresponding tumors, and to alter the therapeutic strategy well before the full course of treatment. Single-voxel 1H MRS and MRSI were found to be useful in assessing treatment response in brain,31,32,179 breast,5,164 and prostate158 cancers. In breast cancer, several studies show that tCho has a high likelihood of detecting early response.180 Response to primary systemic therapy (PST) of breast cancer was detected within 24 h of treatment by monitoring the change in tCho concentration,5 as evident in Figure 6. In this study MRI and MRS were performed on a 4T research MR scanner prior to treatment and within 24 h after treatment with combined doxorubicin and cyclophosphamide (see Figure 6). A lower tCho level compared to baseline was detected within 24 h with a further decrease after the fourth dose in patients who were objective responders (Figure 6). Total choline levels remained unchanged or increased in patients who were nonresponders (Figure 6).
Figure 6.
(A) Sagittal three-dimensional gadolinium-enhanced fat-suppressed MR images (left) and corresponding spectra (right) of the right breast in a 42-year-old nonresponder with invasive ductal carcinoma. (B) Sagittal three-dimensional gadolinium-enhanced fat-suppressed MR images (left) and corresponding spectra (right) of the right breast in a 43-year-old objective responder with invasive ductal carcinoma and positive lymph nodes. On MR images, boxes surrounding enhancing lesions depict spectroscopy voxels. The labeled spectral peaks rise from lipid (1), tCho (2), and water (3). Assignments: tCho, total choline-containing compounds; LD, longest diameter. Adapted from5.
Similar studies showed that the decrease in [tCho/citrate] ratios quantified from 1H MR spectra could detect the response of prostate cancer to hormone-deprivation therapy158,159 and cryosurgery181 early on. Characteristic changes in choline phospholipid metabolites that were induced by anticancer treatments leading to apoptosis or necrosis were also reported.15,182,183 Similarly, reduction of tCho has been associated with early response in lymphomas.184 In some cancers, such as cervical cancer,185 the tCho signal did not change following neoadjuvant treatment, but there was a reduction of tumor volume and the triglyceride signal.185 The tumors were resected after treatment, but there were no differences in survival in patients with or without neoadjuvant therapy, and no survival advantage associated with reduction of tumor volume or decrease of triglycerides.185
As molecular targeted preclinical studies are revealing, while a decrease of tCho and PC is observed following treatment with molecular targeting of several pathways, e.g. mitogen activatived protein kinase (MAPK),186 fatty acid synthase,187 and Bcr-Abl tyrosine kinase,188 the decrease of tCho or PC cannot always be associated with response, and depends upon the target selected. This was exemplified in a study showing that PC levels increased following histone deacetylase (HDAC) inhibition in cells.189 However, PC levels did not change in tumors in vivo following HDAC inhibition.189 This study also describes a novel fluorinated lysine derivative, which is a cleavable HDAC substrate that can be monitored by 19F MRS to detect HDAC activity.189
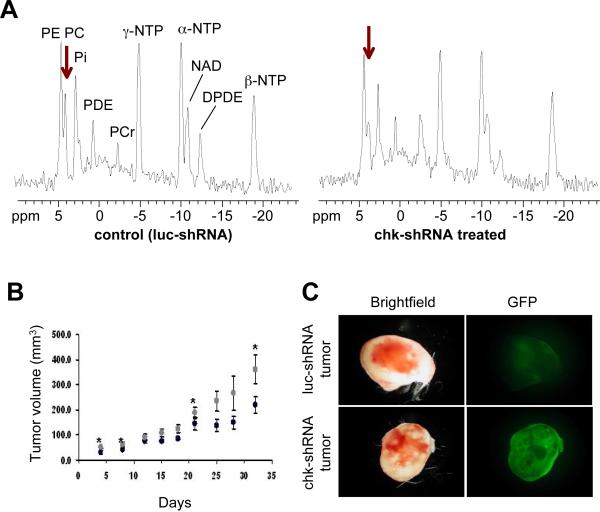
Since one of the major causes of high PC in tumors is the increase in expression and activity of choline kinase (Chk), Chk presents an attractive target that can be exploited for cancer treatment.9,190–193 An additional advantage of targeting Chk is that the decrease of PC and tCho resulting from its downregulation can be detected noninvasively with 31P or 1H MRS.190,191 Chk has been targeted with novel pharmacological inhibitors.192,193 Pharmacological inhibition of Chk was found to result in growth arrest and apoptosis.51,190 Chk has also been downregulated by RNA interference (RNAi).9,191 RNAi is a naturally occurring process that mediates sequence-specific inhibition of gene expression.194,195 Small interfering RNA (siRNA) is small double-stranded RNA of 19–23 nucleotides that can target virtually any gene and silence its expression.194,195 Downregulation of Chk-α with siRNA resulted in a significant reduction of cell proliferation and increased differentiation in highly invasive MDA-MB-231 human breast cancer cells, but not in non-malignant immortalized MCF-12A mammary epithelial cells.9 We subsequently used a lentiviral vector, injected intravenously, to deliver Chk-specific short-hairpin RNA (shRNA) in a breast cancer model.191 In this study, downregulation of Chk was monitored noninvasively by single-voxel 31P MRS as shown in Figure 7. We observed a reduction of PC and PME, which indicated that Chk was successfully downregulated in this lentiviral Chk-targeted gene therapy.191 Chk downregulation also resulted in a reduction of cell proliferation and tumor growth (see Figure 7). These studies demonstrate the feasibility of future gene therapy trials targeting Chk in tumors.
Figure 7.
(A) In vivo single-voxel 31P MRS of MDA-MB-231 tumor xenografts. (A) Representative in vivo single-voxel 31P MRS of MDA-MB-231 tumor xenografts following systemic delivery of lentivirus expressing control shRNA that targets luciferase (luc-shRNA, left) or Chk-targeting shRNA (chk-shRNA, right). Chk-shRNA injection resulted in a significant reduction of PC (arrow) as compared to luc-shRNA. (B) Tumor growth rates were significantly reduced with lentivirus-mediated Chk targeting as compared to control luc-shRNA transduced controls. Tumor volume of luc-shRNA (gray circles, n=5) and chk-shRNA (black circles, n=5) transduced tumors is given in mm3. Values represent mean and standard error. * P < 0.075. (C) Representative brightfield and fluorescence photomicrographs of tumor sections showing distribution of enhanced green fluorescent protein (EGFP), which was expressed from the lentiviral vectors as delivery control, in luc-shRNA (upper panel) and chk-shRNA (lower panel) transduced tumors. This demonstrated successful delivery of lentiviruses into tumors following tail vein injection. Assignments: chk-shRNA, treated with lentivirus targeting choline kinase (chk) with specific short-hairpin RNA; DPDE, diphosphodiester; luc-shRNA; treated with lentivirus targeting luciferase (luc) with specific short-hairpin RNA as vector control; NAD, Nucleoside adenosine diphosphate; NTP, Nucleoside triphosphate; PC, phosphocholine; PDE, phosphodiester; PCr, phosphocreatine; PE, phosphoethanolamine; PME, phosphomonoester. Adapted from191.
Recently, 13C MRSI of hyperpolarized 13C-labeled substrates, such as [1-13C]-pyruvate and [1,4-13C2]-fumarate was used to detect treatment response in a murine lymphoma model.70,196 The chemical structures of these compounds are shown in Table 2. Tumor response was detected by a decrease in the flux of hyperpolarized 13C label between pyruvate and lactate in the case of [1-13C]-pyruvate, and an increase of [1,4-13C2]-malate production in the case of [1,4-13C2]-fumarate. The increase of [1,4-13C2]-malate production was attributed to increased necrosis. These studies are important fore-runners of the use of hyperpolarized 13C-labeled substrates for detecting therapeutic response in tumors.
Poor drug delivery is another major problem in cancer chemotherapy, where MR methods can be used to directly determine the pharmacokinetics of a drug in the tumor, or to provide surrogate indices of drug uptake.197,198 Until recently, MR pharmacokinetic measurements of tumors in vivo were mainly restricted to fluorinated drugs such as [5-19F]-fluorouracil (5-FU, for chemical structure see Table 3) detected by 19F MRS,199 because 19F MRS has the advantage of relatively high sensitivity and no background signal. Fluorine-19 MRS was used to detect the uptake and metabolism of the chemotherapeutic agent 5-FU in liver metastases from colorectal cancer.200 In preclinical studies, we recently reported on image-guided delivery of a prodrug enzyme, bacterial cytosine deaminase (bCD), that converts nontoxic [5-19F]-fluorocytosine (5-FC, for chemical structure see Table 3) to 5-FU.201 Visualization of the prodrug enzyme delivery was possible by conjugating it to poly-L-lysine functionalized with biotin, rhodamine, and Gd3+-1,4,7,10-tetraazacyclododecane-1,4,7,10-tetraacetic acid (DOTA) for optical and MR imaging.201 Image-guided timing of 5-FC prodrug administration to coincide with the maximum concentration of the enzyme in the tumor and the minimum concentration in normal tissue, minimized damage from the active drug 5-FU in normal tissue while maximizing damage to cancer cells.201 The conversion of the prodrug 5-FC to the active drug 5-FU was detected by 19F MRS as shown in Figure 2.
For drugs lacking 19F atoms, chemical 19F-labeling may alter the physicochemical and pharmacological properties of the drug.202,203 The feasibility of 13C and 1H MRS methods to detect drug uptake and distribution are therefore being explored.204 Such approaches depend upon the labeled drug having at least one well-resolved, isolated peak and being delivered at doses high enough to be within the detection sensitivity of MRS.205 Kato et al.204 were able to image the intratumoral distribution of the 13C-labeled anticancer agent temozolomide (see Table 3 for chemical structure) by 1H/13C MRS. This 13C MRSI study demonstrated that temozolomide was heterogenously delivered to the tumor.204 Temozolomide is used in the clinic for chemotherapy treatment of glioblastomas and anaplastic astrocytomas,206 and the preclinical studies with brain cancer models demonstrate the potential use of 13C MRS in detecting temozolomide delivery in human cancers.198
4. Conclusions
Since the initial in vivo studies in the 1980's, multi-nuclear MRS has evolved into a highly versatile, noninvasive technique that is finding multiple applications in medical diagnosis, monitoring therapy, and research. Traditionally, MRS has provided biochemical characterization of pathological states. The increasing interface of chemistry with the fields of MRSI and molecular biology, and the resulting advances in theranostic contrast agent design, are providing new advances in the applications of MRS for molecular characterization and molecular-targeted medicine, especially in cancer. While sensitivity and spectral resolution continue to be limiting factors with this technique, the use of higher field strengths and the application of techniques such as hyperpolarization are providing advances that minimize these limitations.
The heterogeneity of tumors and the resulting heterogeneity of tumor response to treatment frequently result in cancer being an intractable disease, and make it imperative that each cancer is viewed individually in terms of the treatment selected and monitoring its response to treatment. The bench-to-bedside span of MRS, its ease of incorporation with MRI, and the multi-parametric information that can be obtained, make MRS a cornerstone technique for personalized medicine in cancer, in terms of predicting as well as detecting response to treatment.
Acknowledgements
Support from NIH P50 CA103175, P50 CA88843, P30 CA006973, U01 CA070095, U01 CA140204, R01 CA73850, R01 CA136576, R01 CA138515, R01 CA82337, R01 CA100184, R01 CA134695, R21 CA133288, and MD Stem Cells TEDCO 104026 is gratefully acknowledged.
Biographies

Dr. Kristine Glunde is Associate Professor of Radiology and Oncology at the Johns Hopkins University School of Medicine. She received her Ph.D. from the University of Bremen in Germany in 2000. She was a Postdoctoral Fellow in the Molecular Cancer Imaging Program in the Department of Radiology at the Johns Hopkins University (JHU) School of Medicine. Since 2003, she has been a faculty member in the JHU In Vivo Cellular and Molecular Imaging Center (JHU ICMIC Program). Dr. Glunde's research focusses on developing novel optical imaging agents and techniques to study the role of lysosomal trafficking in breast and prostate cancer invasion and metastasis. She also studies mechanisms underlying the aberrant choline phospholipid metabolism in breast and prostate cancer using magnetic resonance spectroscopy and imaging mass spectrometry.

Dr. Dmitri Artemov is Associate Professor of Radiology and Oncology at the Johns Hopkins University (JHU) School of Medicine. He received his Ph.D. from the Russian Academy of Sciences, Moscow. Before joining the JHU faculty, Dr. Artemov completed his postdoctoral training at the University of Wuerzburg and the Department of Radiology at the JHU School of Medicine. Dr. Artemov's research interests focus on developing novel molecular MR imaging methods to study tumors, and on the role of stem cells in tumor progression and therapy.

Dr. Marie-France Penet is an Instructor in the Molecular Cancer Imaging Program in the Department of Radiology at the Johns Hopkins University (JHU) School of Medicine. She received her Ph.D. degree from the University of Aix-Marseille in France in 2005. Dr. Penet's research focuses on using magnetic resonance imaging and spectroscopy together with histological and molecular analyses to understand the role of hypoxia and tumor vascularization and metabolism in prostate cancer invasion and metastasis.

Dr. Michael A. Jacobs is Associate Professor of Radiology and Oncology at the Johns Hopkins University (JHU) School of Medicine. His current research interests include developing radiological methods for detection, monitoring, and treatment of different pathologies. For example, using advanced MR methods for identification and classification of breast, prostate, and metastatic cancer, stroke, and uterine fibroids. He has pioneered the development of multi-parametric analysis of different pathologies that can combine different modalities to derive diagnostic biomarkers, as well as investigating the use of thermotherapy for treatment of tumors. Dr. Jacobs is on the National Board of the American College of Radiology Imaging Network (ACRIN) Breast Imaging committee and is the member of the subcommittee of molecular and functional imaging of the ACRIN. In addition, he is the Co-director of the Imaging Radiological Assessment Team (IRAT) at Johns Hopkins.

Dr. Zaver M. Bhujwalla is Professor in the Departments of Radiology and Oncology at the Johns Hopkins University (JHU) School of Medicine. She is the Director of the JHU In Vivo Cellular and Molecular Imaging Center. Dr. Bhujwalla joined the Department of Radiology at the Johns Hopkins University School of Medicine in 1989, just after completing her Ph.D. from the University of London. Dr. Bhujwalla's work has focused on the applications of MR imaging and spectroscopy and more recently multi-modality imaging to understand and treat cancer. Dr. Bhujwalla is an elected Fellow of the International Society of Magnetic Resonance in Medicine, and the American Institute of Biomedical Engineers. Dr. Bhujwalla is associated with the editorial boards of Molecular Imaging, NMR in Biomedicine, Cancer Biology and Therapy, and Contrast Media and Molecular Imaging.
5. References
- (1).Brown TR, Kincaid BM, Ugurbil K. Proc Natl Acad Sci U S A. 1982;79:3523–6. doi: 10.1073/pnas.79.11.3523. [DOI] [PMC free article] [PubMed] [Google Scholar]
- (2).Haselgrove JC, Subramanian VH, Leigh JS, Jr., Gyulai L, Chance B. Science. 1983;220:1170–3. doi: 10.1126/science.6857240. [DOI] [PubMed] [Google Scholar]
- (3).Maudsley AA, Hilal SK, Perman WH, Simon HE. Journal of Magnetic Resonance. 1983;51:147–152. [Google Scholar]
- (4).Kurhanewicz J, Vigneron DB, Males RG, Swanson MG, Yu KK, Hricak H. Radiol Clin North Am. 2000;38:115–38. viii–ix. doi: 10.1016/s0033-8389(05)70152-4. [DOI] [PubMed] [Google Scholar]
- (5).Meisamy S, Bolan PJ, Baker EH, Bliss RL, Gulbahce E, Everson LI, Nelson MT, Emory TH, Tuttle TM, Yee D, Garwood M. Radiology. 2004;233:424–31. doi: 10.1148/radiol.2332031285. [DOI] [PubMed] [Google Scholar]
- (6).Baek HM, Chen JH, Nie K, Yu HJ, Bahri S, Mehta RS, Nalcioglu O, Su MY. Radiology. 2009;251:653–62. doi: 10.1148/radiol.2512080553. [DOI] [PMC free article] [PubMed] [Google Scholar]
- (7).Kumar V, Jagannathan NR, Kumar R, Das SC, Jindal L, Thulkar S, Gupta SD, Dwivedi SN, Roell S, Hemal AK, Gupta NP. Magn Reson Imaging. 2006;24:541–548. doi: 10.1016/j.mri.2006.01.001. [DOI] [PubMed] [Google Scholar]
- (8).Glunde K, Jie C, Bhujwalla ZM. Cancer Res. 2004;64:4270–6. doi: 10.1158/0008-5472.CAN-03-3829. [DOI] [PubMed] [Google Scholar]
- (9).Glunde K, Raman V, Mori N, Bhujwalla ZM. Cancer Res. 2005;65:11034–43. doi: 10.1158/0008-5472.CAN-05-1807. [DOI] [PubMed] [Google Scholar]
- (10).Zhao D, Ran S, Constantinescu A, Hahn EW, Mason RP. Neoplasia. 2003;5:308–18. doi: 10.1016/S1476-5586(03)80024-6. [DOI] [PMC free article] [PubMed] [Google Scholar]
- (11).Kodibagkar VD, Cui W, Merritt ME, Mason RP. Magn Reson Med. 2006;55:743–8. doi: 10.1002/mrm.20826. [DOI] [PubMed] [Google Scholar]
- (12).Raman V, Artemov D, Pathak AP, Winnard PT, Jr., McNutt S, Yudina A, Bogdanov A, Jr., Bhujwalla ZM. Cancer Res. 2006;66:9929–36. doi: 10.1158/0008-5472.CAN-06-0886. [DOI] [PubMed] [Google Scholar]
- (13).Glunde K, Shah T, Winnard PTJ, Raman V, Takagi T, Vesuna F, Artemov D, Bhujwalla ZM. Cancer Res. 2008;68:172–80. doi: 10.1158/0008-5472.CAN-07-2678. [DOI] [PMC free article] [PubMed] [Google Scholar]
- (14).Penet MF, Pathak AP, Raman V, Ballesteros P, Artemov D, Bhujwalla ZM. Cancer Res. 2009;69:8822–9. doi: 10.1158/0008-5472.CAN-09-1782. [DOI] [PMC free article] [PubMed] [Google Scholar]
- (15).Griffin JL, Shockcor JP. Nat Rev Cancer. 2004;4:551–61. doi: 10.1038/nrc1390. [DOI] [PubMed] [Google Scholar]
- (16).Griffin JL, Kauppinen RA. J Proteome Res. 2007;6:498–505. doi: 10.1021/pr060464h. [DOI] [PubMed] [Google Scholar]
- (17).Glunde K, Serkova NJ. Pharmacogenomics. 2006;7:1109–23. doi: 10.2217/14622416.7.7.1109. [DOI] [PubMed] [Google Scholar]
- (18).Costello LC, Franklin RB. Mol Cell Biochem. 2005;280:1–8. doi: 10.1007/s11010-005-8841-8. [DOI] [PMC free article] [PubMed] [Google Scholar]
- (19).Griffin JL, Kauppinen RA. Febs J. 2007;274:1132–9. doi: 10.1111/j.1742-4658.2007.05676.x. [DOI] [PubMed] [Google Scholar]
- (20).Millis K, Weybright P, Campbell N, Fletcher JA, Fletcher CD, Cory DG, Singer S. Magn Reson Med. 1999;41:257–67. doi: 10.1002/(sici)1522-2594(199902)41:2<257::aid-mrm8>3.0.co;2-n. [DOI] [PubMed] [Google Scholar]
- (21).Swanson MG, Vigneron DB, Tabatabai ZL, Males RG, Schmitt L, Carroll PR, James JK, Hurd RE, Kurhanewicz J. Magn Reson Med. 2003;50:944–54. doi: 10.1002/mrm.10614. [DOI] [PubMed] [Google Scholar]
- (22).Swanson MG, Zektzer AS, Tabatabai ZL, Simko J, Jarso S, Keshari KR, Schmitt L, Carroll PR, Shinohara K, Vigneron DB, Kurhanewicz J. Magn Reson Med. 2006;55:1257–64. doi: 10.1002/mrm.20909. [DOI] [PubMed] [Google Scholar]
- (23).Barker PB, Glickson JD, Bryan RN. Top Magn Reson Imaging. 1993;5:32–45. [PubMed] [Google Scholar]
- (24).Pouwels PJ, Frahm J. Magn Reson Med. 1998;39:53–60. doi: 10.1002/mrm.1910390110. [DOI] [PubMed] [Google Scholar]
- (25).Ross B, Michaelis T. Magn Reson Q. 1994;10:191–247. [PubMed] [Google Scholar]
- (26).Chang L, McBride D, Miller BL, Cornford M, Booth RA, Buchthal SD, Ernst TM, Jenden D. J Neuroimaging. 1995;5:157–63. doi: 10.1111/jon199553157. [DOI] [PubMed] [Google Scholar]
- (27).Tzika AA, Cheng LL, Goumnerova L, Madsen JR, Zurakowski D, Astrakas LG, Zarifi MK, Scott RM, Anthony DC, Gonzalez RG, Black PM. J Neurosurg. 2002;96:1023–31. doi: 10.3171/jns.2002.96.6.1023. [DOI] [PubMed] [Google Scholar]
- (28).Nelson SJ. Magn Reson Med. 2001;46:228–39. doi: 10.1002/mrm.1183. [DOI] [PubMed] [Google Scholar]
- (29).Howe FA, Barton SJ, Cudlip SA, Stubbs M, Saunders DE, Murphy M, Wilkins P, Opstad KS, Doyle VL, McLean MA, Bell BA, Griffiths JR. Magn Reson Med. 2003;49:223–32. doi: 10.1002/mrm.10367. [DOI] [PubMed] [Google Scholar]
- (30).Murphy M, Loosemore A, Clifton AG, Howe FA, Tate AR, Cudlip SA, Wilkins PR, Griffiths JR, Bell BA. Br J Neurosurg. 2002;16:329–34. doi: 10.1080/0268869021000007687. [DOI] [PubMed] [Google Scholar]
- (31).Lindskog M, Spenger C, Klason T, Jarvet J, Graslund A, Johnsen JI, Ponthan F, Douglas L, Nordell B, Kogner P. Cancer Lett. 2005;228:247–55. doi: 10.1016/j.canlet.2004.12.055. [DOI] [PubMed] [Google Scholar]
- (32).Jenkinson MD, Smith TS, Joyce K, Fildes D, du Plessis DG, Warnke PC, Walker C. Neurology. 2005;64:2085–9. doi: 10.1212/01.WNL.0000165998.73779.D9. [DOI] [PubMed] [Google Scholar]
- (33).Jeun SS, Kim MC, Kim BS, Lee JM, Chung ST, Oh CH, Lee SY, Choe BY. Clin Imaging. 2005;29:10–5. doi: 10.1016/j.clinimag.2004.03.004. [DOI] [PubMed] [Google Scholar]
- (34).McKnight TR. Semin Oncol. 2004;31:605–17. doi: 10.1053/j.seminoncol.2004.07.003. [DOI] [PubMed] [Google Scholar]
- (35).Narayan P, Kurhanewicz J. Prostate Suppl. 1992;4:43–50. doi: 10.1002/pros.2990210507. [DOI] [PubMed] [Google Scholar]
- (36).Schick F, Bongers H, Kurz S, Jung WI, Pfeffer M, Lutz O. Magn Reson Med. 1993;29:38–43. doi: 10.1002/mrm.1910290109. [DOI] [PubMed] [Google Scholar]
- (37).Kurhanewicz J, Vigneron DB, Hricak H, Narayan P, Carroll P, Nelson SJ. Radiology. 1996;198:795–805. doi: 10.1148/radiology.198.3.8628874. [DOI] [PubMed] [Google Scholar]
- (38).Menard C, Smith IC, Somorjai RL, Leboldus L, Patel R, Littman C, Robertson SJ, Bezabeh T. Int J Radiat Oncol Biol Phys. 2001;50:317–23. doi: 10.1016/s0360-3016(01)01480-8. [DOI] [PubMed] [Google Scholar]
- (39).Jagannathan NR, Singh M, Govindaraju V, Raghunathan P, Coshic O, Julka PK, Rath GK. NMR Biomed. 1998;11:414–22. doi: 10.1002/(sici)1099-1492(199812)11:8<414::aid-nbm537>3.0.co;2-w. [DOI] [PubMed] [Google Scholar]
- (40).Roebuck JR, Cecil KM, Schnall MD, Lenkinski RE. Radiology. 1998;209:269–275. doi: 10.1148/radiology.209.1.9769842. [DOI] [PubMed] [Google Scholar]
- (41).Yeung DK, Cheung HS, Tse GM. Radiology. 2001;220:40–6. doi: 10.1148/radiology.220.1.r01jl0240. [DOI] [PubMed] [Google Scholar]
- (42).Jacobs MA, Barker PB, Bottomley PA, Bhujwalla Z, Bluemke DA. J Magn Reson Imaging. 2004;19:68–75. doi: 10.1002/jmri.10427. [DOI] [PubMed] [Google Scholar]
- (43).Bolan PJ, Meisamy S, Baker EH, Lin J, Emory T, Nelson M, Everson LI, Yee D, Garwood M. Magn Reson Med. 2003;50:1134–43. doi: 10.1002/mrm.10654. [DOI] [PubMed] [Google Scholar]
- (44).Meisamy S, Bolan PJ, Baker EH, Pollema MG, Le CT, Kelcz F, Lechner MC, Luikens BA, Carlson RA, Brandt KR, Amrami KK, Nelson MT, Everson LI, Emory TH, Tuttle TM, Yee D, Garwood M. Radiology. 2005;236:465–75. doi: 10.1148/radiol.2362040836. [DOI] [PubMed] [Google Scholar]
- (45).Stanwell P, Gluch L, Clark D, Tomanek B, Baker L, Giuffre B, Lean C, Malycha P, Mountford C. Eur Radiol. 2005;15:1037–43. doi: 10.1007/s00330-004-2475-1. [DOI] [PubMed] [Google Scholar]
- (46).Baik HM, Su MY, Yu H, Nalcioglu O, Mehta R. Magma. 2006;19:96–104. doi: 10.1007/s10334-006-0032-4. [DOI] [PubMed] [Google Scholar]
- (47).Ramirez de Molina A, Gallego-Ortega D, Sarmentero J, Banez-Coronel M, Martin-Cantalejo Y, Lacal JC. Cancer Res. 2005;65:5647–53. doi: 10.1158/0008-5472.CAN-04-4416. [DOI] [PubMed] [Google Scholar]
- (48).Ramirez de Molina A, Gutierrez R, Ramos MA, Silva JM, Silva J, Bonilla F, Sanchez JJ, Lacal JC. Oncogene. 2002;21:4317–22. doi: 10.1038/sj.onc.1205556. [DOI] [PubMed] [Google Scholar]
- (49).Ramirez de Molina A, Penalva V, Lucas L, Lacal JC. Oncogene. 2002;21:937–46. doi: 10.1038/sj.onc.1205144. [DOI] [PubMed] [Google Scholar]
- (50).Ramirez de Molina A, Rodriguez-Gonzalez A, Gutierrez R, Martinez-Pineiro L, Sanchez J, Bonilla F, Rosell R, Lacal J. Biochem Biophys Res Commun. 2002;296:580–3. doi: 10.1016/s0006-291x(02)00920-8. [DOI] [PubMed] [Google Scholar]
- (51).Rodriguez-Gonzalez A, Ramirez de Molina A, Fernandez F, Lacal JC. Oncogene. 2004;23:8247–59. doi: 10.1038/sj.onc.1208045. [DOI] [PubMed] [Google Scholar]
- (52).Artemov D, Bhujwalla ZM, Glickson JD. Magn Reson Med. 1995;33:151–5. doi: 10.1002/mrm.1910330202. [DOI] [PubMed] [Google Scholar]
- (53).van Zijl PC, Chesnick AS, DesPres D, Moonen CT, Ruiz-Cabello J, van Gelderen P. Magn Reson Med. 1993;30:544–51. doi: 10.1002/mrm.1910300504. [DOI] [PubMed] [Google Scholar]
- (54).Vander Heiden MG, Cantley LC, Thompson CB. Science. 2009;324:1029–33. doi: 10.1126/science.1160809. [DOI] [PMC free article] [PubMed] [Google Scholar]
- (55).Kim JW, Dang CV. Cancer Res. 2006;66:8927–30. doi: 10.1158/0008-5472.CAN-06-1501. [DOI] [PubMed] [Google Scholar]
- (56).Semenza GL. Biochem J. 2007;405:1–9. doi: 10.1042/BJ20070389. [DOI] [PubMed] [Google Scholar]
- (57).Vaupel P, Kallinowski F, Okunieff P. Cancer Res. 1989;49:6449–65. [PubMed] [Google Scholar]
- (58).Vaupel P, Okunieff P, Kallinowski F, Neuringer LJ. Radiat Res. 1989;120:477–93. [PubMed] [Google Scholar]
- (59).Medina RA, Owen GI. Biol Res. 2002;35:9–26. doi: 10.4067/s0716-97602002000100004. [DOI] [PubMed] [Google Scholar]
- (60).Macheda ML, Rogers S, Best JD. J Cell Physiol. 2005;202:654–62. doi: 10.1002/jcp.20166. [DOI] [PubMed] [Google Scholar]
- (61).Rivenzon-Segal D, Margalit R, Degani H. Am J Physiol Endocrinol Metab. 2002;283:E623–30. doi: 10.1152/ajpendo.00050.2002. [DOI] [PubMed] [Google Scholar]
- (62).Terpstra M, High WB, Luo Y, de Graaf RA, Merkle H, Garwood M. NMR Biomed. 1996;9:185–94. doi: 10.1002/(SICI)1099-1492(199608)9:5<185::AID-NBM414>3.0.CO;2-X. [DOI] [PubMed] [Google Scholar]
- (63).Nielsen FU, Daugaard P, Bentzen L, Stodkilde-Jorgensen H, Overgaard J, Horsman MR, Maxwell RJ. Cancer Res. 2001;61:5318–25. [PubMed] [Google Scholar]
- (64).Constantinidis I, Chatham JC, Wehrle JP, Glickson JD. Magn Reson Med. 1991;20:17–26. doi: 10.1002/mrm.1910200103. [DOI] [PubMed] [Google Scholar]
- (65).Bhujwalla ZM, Constantinidis I, Chatham JC, Wehrle JP, Glickson JD. Int J Radiat Oncol Biol Phys. 1992;22:95–101. doi: 10.1016/0360-3016(92)90987-s. [DOI] [PubMed] [Google Scholar]
- (66).Schupp DG, Merkle H, Ellermann JM, Ke Y, Garwood M. Magn Reson Med. 1993;30:18–27. doi: 10.1002/mrm.1910300105. [DOI] [PubMed] [Google Scholar]
- (67).Artemov D, Bhujwalla ZM, Pilatus U, Glickson JD. NMR Biomed. 1998;11:395–404. doi: 10.1002/(sici)1099-1492(199812)11:8<395::aid-nbm536>3.0.co;2-r. [DOI] [PubMed] [Google Scholar]
- (68).Bouzier AK, Quesson B, Valeins H, Canioni P, Merle M. J Neurochem. 1999;72:2445–55. doi: 10.1046/j.1471-4159.1999.0722445.x. [DOI] [PubMed] [Google Scholar]
- (69).Ardenkjaer-Larsen JH, Fridlund B, Gram A, Hansson G, Hansson L, Lerche MH, Servin R, Thaning M, Golman K. Proc Natl Acad Sci U S A. 2003;100:10158–63. doi: 10.1073/pnas.1733835100. [DOI] [PMC free article] [PubMed] [Google Scholar]
- (70).Day SE, Kettunen MI, Gallagher FA, Hu DE, Lerche M, Wolber J, Golman K, Ardenkjaer-Larsen JH, Brindle KM. Nat Med. 2007;13:1382–7. doi: 10.1038/nm1650. [DOI] [PubMed] [Google Scholar]
- (71).Albers MJ, Bok R, Chen AP, Cunningham CH, Zierhut ML, Zhang VY, Kohler SJ, Tropp J, Hurd RE, Yen YF, Nelson SJ, Vigneron DB, Kurhanewicz J. Cancer Res. 2008;68:8607–15. doi: 10.1158/0008-5472.CAN-08-0749. [DOI] [PMC free article] [PubMed] [Google Scholar]
- (72).Abragam AA, Proctor WG. Phys Rev. 1958;109 [Google Scholar]
- (73).Goldman M, Johannesson H, Axelsson O, Karlsson M. Magn Reson Imaging. 2005;23:153–7. doi: 10.1016/j.mri.2004.11.031. [DOI] [PubMed] [Google Scholar]
- (74).Johansson E, Olsson LE, Mansson S, Petersson JS, Golman K, Stahlberg F, Wirestam R. Magn Reson Med. 2004;52:1043–51. doi: 10.1002/mrm.20247. [DOI] [PubMed] [Google Scholar]
- (75).Negendank W. NMR Biomed. 1992;5:303–24. doi: 10.1002/nbm.1940050518. [DOI] [PubMed] [Google Scholar]
- (76).Podo F. NMR Biomed. 1999;12:413–39. doi: 10.1002/(sici)1099-1492(199911)12:7<413::aid-nbm587>3.0.co;2-u. [DOI] [PubMed] [Google Scholar]
- (77).Ronen SM, Leach MO. Breast Cancer Res. 2001;3:36–40. doi: 10.1186/bcr268. [DOI] [PMC free article] [PubMed] [Google Scholar]
- (78).Ackerstaff E, Glunde K, Bhujwalla ZM. J Cell Biochem. 2003;90:525–33. doi: 10.1002/jcb.10659. [DOI] [PubMed] [Google Scholar]
- (79).Franks SE, Smith MR, Arias-Mendoza F, Shaller C, Padavic-Shaller K, Kappler F, Zhang Y, Negendank WG, Brown TR. Leuk Res. 2002;26:919–26. doi: 10.1016/s0145-2126(02)00035-8. [DOI] [PubMed] [Google Scholar]
- (80).Aboagye EO, Bhujwalla ZM. Cancer Res. 1999;59:80–4. [PubMed] [Google Scholar]
- (81).Iorio E, Mezzanzanica D, Alberti P, Spadaro F, Ramoni C, D'Ascenzo S, Millimaggi D, Pavan A, Dolo V, Canevari S, Podo F. Cancer Res. 2005;65:9369–76. doi: 10.1158/0008-5472.CAN-05-1146. [DOI] [PubMed] [Google Scholar]
- (82).Arias-Mendoza F, Payne GS, Zakian KL, Schwarz AJ, Stubbs M, Stoyanova R, Ballon D, Howe FA, Koutcher JA, Leach MO, Griffiths JR, Heerschap A, Glickson JD, Nelson SJ, Evelhoch JL, Charles HC, Brown TR. NMR Biomed. 2006;19:504–12. doi: 10.1002/nbm.1057. [DOI] [PubMed] [Google Scholar]
- (83).Albers MJ, Krieger MD, Gonzalez-Gomez I, Gilles FH, McComb JG, Nelson MD, Jr., Bluml S. Magn Reson Med. 2005;53:22–9. doi: 10.1002/mrm.20312. [DOI] [PubMed] [Google Scholar]
- (84).Klomp DW, Wijnen JP, Scheenen TW, Heerschap A. Magn Reson Med. 2008;60:1298–305. doi: 10.1002/mrm.21733. [DOI] [PubMed] [Google Scholar]
- (85).Katz-Brull R, Degani H. Anticancer Res. 1996;16:1375–80. [PubMed] [Google Scholar]
- (86).Eliyahu G, Kreizman T, Degani H. Int J Cancer. 2007;120:1721–30. doi: 10.1002/ijc.22293. [DOI] [PubMed] [Google Scholar]
- (87).Noh DY, Ahn SJ, Lee RA, Park IA, Kim JH, Suh PG, Ryu SH, Lee KH, Han JS. Cancer Lett. 2000;161:207–14. doi: 10.1016/s0304-3835(00)00612-1. [DOI] [PubMed] [Google Scholar]
- (88).Foster DA, Xu L. Mol Cancer Res. 2003;1:789–800. [PubMed] [Google Scholar]
- (89).Gillies RJ, Morse DL. Annu Rev Biomed Eng. 2005;7:287–326. doi: 10.1146/annurev.bioeng.7.060804.100411. [DOI] [PubMed] [Google Scholar]
- (90).Hakumaki JM, Poptani H, Sandmair AM, Yla-Herttuala S, Kauppinen RA. Nat Med. 1999;5:1323–7. doi: 10.1038/15279. [DOI] [PubMed] [Google Scholar]
- (91).Engelmann J, Henke J, Willker W, Kutscher B, Nossner G, Engel J, Leibfritz D. Anticancer Res. 1996;16:1429–39. [PubMed] [Google Scholar]
- (92).Al-Saffar NM, Titley JC, Robertson D, Clarke PA, Jackson LE, Leach MO, Ronen SM. Br J Cancer. 2002;86:963–70. doi: 10.1038/sj.bjc.6600188. [DOI] [PMC free article] [PubMed] [Google Scholar]
- (93).Barba I, Cabanas ME, Arus C. Cancer Res. 1999;59:1861–8. [PubMed] [Google Scholar]
- (94).Callies R, Sri-Pathmanathan RM, Ferguson DY, Brindle KM. Magn Reson Med. 1993;29:546–50. doi: 10.1002/mrm.1910290418. [DOI] [PubMed] [Google Scholar]
- (95).Schmitz JE, Kettunen MI, Hu DE, Brindle KM. Magn Reson Med. 2005;54:43–50. doi: 10.1002/mrm.20529. [DOI] [PubMed] [Google Scholar]
- (96).Ackerman JJ, Grove TH, Wong GG, Gadian DG, Radda GK. Nature. 1980;283:167–70. doi: 10.1038/283167a0. [DOI] [PubMed] [Google Scholar]
- (97).Griffiths JR, Cady E, Edwards RH, McCready VR, Wilkie DR, Wiltshaw E. Lancet. 1983;1:1435–6. doi: 10.1016/s0140-6736(83)92375-9. [DOI] [PubMed] [Google Scholar]
- (98).Bottomley PA, Charles HC, Roemer PB, Flamig D, Engeseth H, Edelstein WA, Mueller OM. Magn Reson Med. 1988;7:319–36. doi: 10.1002/mrm.1910070309. [DOI] [PubMed] [Google Scholar]
- (99).Hardy CJ, Bottomley PA, Roemer PB, Redington RW. Magn Reson Med. 1988;8:104–9. doi: 10.1002/mrm.1910080113. [DOI] [PubMed] [Google Scholar]
- (100).Okunieff PG, Koutcher JA, Gerweck L, McFarland E, Hitzig B, Urano M, Brady T, Neuringer L, Suit HD. Int J Radiat Oncol Biol Phys. 1986;12:793–9. doi: 10.1016/0360-3016(86)90038-6. [DOI] [PubMed] [Google Scholar]
- (101).Li SJ, Wehrle JP, Rajan SS, Steen RG, Glickson JD, Hilton J. Cancer Res. 1988;48:4736–42. [PubMed] [Google Scholar]
- (102).Kallman RF. Radiology. 1972;105:135–42. doi: 10.1148/105.1.135. [DOI] [PubMed] [Google Scholar]
- (103).Tozer GM, Griffiths JR. NMR Biomed. 1992;5:279–89. doi: 10.1002/nbm.1940050515. [DOI] [PubMed] [Google Scholar]
- (104).Cheng LL, Chang IW, Louis DN, Gonzalez RG. Cancer Res. 1998;58:1825–32. [PubMed] [Google Scholar]
- (105).Cheng LL, Chang IW, Smith BL, Gonzalez RG. J Magn Reson. 1998;135:194–202. doi: 10.1006/jmre.1998.1578. [DOI] [PubMed] [Google Scholar]
- (106).Cheng LL, Burns MA, Taylor JL, He W, Halpern EF, McDougal WS, Wu CL. Cancer Res. 2005;65:3030–4. doi: 10.1158/0008-5472.CAN-04-4106. [DOI] [PubMed] [Google Scholar]
- (107).Sitter B, Lundgren S, Bathen TF, Halgunset J, Fjosne HE, Gribbestad IS. NMR Biomed. 2006;19:30–40. doi: 10.1002/nbm.992. [DOI] [PubMed] [Google Scholar]
- (108).Sitter B, Sonnewald U, Spraul M, Fjosne HE, Gribbestad IS. NMR Biomed. 2002;15:327–37. doi: 10.1002/nbm.775. [DOI] [PubMed] [Google Scholar]
- (109).Martinez-Bisbal MC, Marti-Bonmati L, Piquer J, Revert A, Ferrer P, Llacer JL, Piotto M, Assemat O, Celda B. NMR Biomed. 2004;17:191–205. doi: 10.1002/nbm.888. [DOI] [PubMed] [Google Scholar]
- (110).Payne GS, Troy H, Vaidya SJ, Griffiths JR, Leach MO, Chung YL. NMR Biomed. 2006 doi: 10.1002/nbm.1040. [DOI] [PubMed] [Google Scholar]
- (111).Alger JR, Shulman RG. Q Rev Biophys. 1984;17:83–124. doi: 10.1017/s0033583500005266. [DOI] [PubMed] [Google Scholar]
- (112).Ward KM, Aletras AH, Balaban RS. J Magn Reson. 2000;143:79–87. doi: 10.1006/jmre.1999.1956. [DOI] [PubMed] [Google Scholar]
- (113).Zhou J, Payen JF, Wilson DA, Traystman RJ, van Zijl PC. Nat Med. 2003;9:1085–90. doi: 10.1038/nm907. [DOI] [PubMed] [Google Scholar]
- (114).Gilad AA, McMahon MT, Walczak P, Winnard PT, Jr., Raman V, van Laarhoven HW, Skoglund CM, Bulte JW, van Zijl PC. Nat Biotechnol. 2007;25:217–9. doi: 10.1038/nbt1277. [DOI] [PubMed] [Google Scholar]
- (115).McMahon MT, Gilad AA, DeLiso MA, Berman SM, Bulte JW, van Zijl PC. Magn Reson Med. 2008;60:803–12. doi: 10.1002/mrm.21683. [DOI] [PMC free article] [PubMed] [Google Scholar]
- (116).Jain RK. Cancer Res. 1988;48:2641–58. [PubMed] [Google Scholar]
- (117).Gatenby RA, Gillies RJ. Nat Rev Cancer. 2004;4:891–9. doi: 10.1038/nrc1478. [DOI] [PubMed] [Google Scholar]
- (118).Lunt SJ, Chaudary N, Hill RP. Clin Exp Metastasis. 2009;26:19–34. doi: 10.1007/s10585-008-9182-2. [DOI] [PubMed] [Google Scholar]
- (119).Rockwell S, Dobrucki IT, Kim EY, Marrison ST, Vu VT. Curr Mol Med. 2009;9:442–58. doi: 10.2174/156652409788167087. [DOI] [PMC free article] [PubMed] [Google Scholar]
- (120).Parhami P, Fung BM. Journal of Physical Chemistry. 1983;87:1928–1931. [Google Scholar]
- (121).Zhao D, Jiang L, Mason RP. Methods Enzymol. 2004;386:378–418. doi: 10.1016/S0076-6879(04)86018-X. [DOI] [PubMed] [Google Scholar]
- (122).Dardzinski BJ, Sotak CH. Magn Reson Med. 1994;32:88–97. doi: 10.1002/mrm.1910320112. [DOI] [PubMed] [Google Scholar]
- (123).Jordan BF, Cron GO, Gallez B. Magn Reson Med. 2009;61:634–8. doi: 10.1002/mrm.21594. [DOI] [PubMed] [Google Scholar]
- (124).Baldwin NJ, Ng TC. Magn Reson Imaging. 1996;14:541–51. doi: 10.1016/0730-725x(96)00049-5. [DOI] [PubMed] [Google Scholar]
- (125).Mason RP, Antich PP, Babcock EE, Constantinescu A, Peschke P, Hahn EW. Int J Radiat Oncol Biol Phys. 1994;29:95–103. doi: 10.1016/0360-3016(94)90231-3. [DOI] [PubMed] [Google Scholar]
- (126).Kodibagkar VD, Wang X, Mason RP. Front Biosci. 2008;13:1371–84. doi: 10.2741/2768. [DOI] [PubMed] [Google Scholar]
- (127).Kodibagkar VD, Wang X, Pacheco-Torres J, Gulaka P, Mason RP. NMR Biomed. 2008;21:899–907. doi: 10.1002/nbm.1279. [DOI] [PMC free article] [PubMed] [Google Scholar]
- (128).Aboagye EO, Kelson AB, Tracy M, Workman P. Anticancer Drug Des. 1998;13:703–30. [PubMed] [Google Scholar]
- (129).Procissi D, Claus F, Burgman P, Koziorowski J, Chapman JD, Thakur SB, Matei C, Ling CC, Koutcher JA. Clin Cancer Res. 2007;13:3738–47. doi: 10.1158/1078-0432.CCR-06-1563. [DOI] [PubMed] [Google Scholar]
- (130).Varghese AJ, Gulyas S, Mohindra JK. Cancer Res. 1976;36:3761–5. [PubMed] [Google Scholar]
- (131).Kizaka-Kondoh S, Konse-Nagasawa H. Cancer Sci. 2009;100:1366–73. doi: 10.1111/j.1349-7006.2009.01195.x. [DOI] [PMC free article] [PubMed] [Google Scholar]
- (132).Laughlin KM, Evans SM, Jenkins WT, Tracy M, Chan CY, Lord EM, Koch CJ. J Pharmacol Exp Ther. 1996;277:1049–57. [PubMed] [Google Scholar]
- (133).Moon RB, Richards JH. J Biol Chem. 1973;248:7276–8. [PubMed] [Google Scholar]
- (134).Stubbs M, Bhujwalla ZM, Tozer GM, Rodrigues LM, Maxwell RJ, Morgan R, Howe FA, Griffiths JR. NMR Biomed. 1992;5:351–9. doi: 10.1002/nbm.1940050606. [DOI] [PubMed] [Google Scholar]
- (135).Griffiths JR. Br J Cancer. 1991;64:425–7. doi: 10.1038/bjc.1991.326. [DOI] [PMC free article] [PubMed] [Google Scholar]
- (136).Gillies RJ, Liu Z, Bhujwalla ZM. Am J Physiol. 1994;267:C195–C203. doi: 10.1152/ajpcell.1994.267.1.C195. [DOI] [PubMed] [Google Scholar]
- (137).van Sluis R, Bhujwalla ZM, Raghunand N, Ballesteros P, Alvarez J, Cerdan S, Galons JP, Gillies RJ. Magn Reson Med. 1999;41:743–50. doi: 10.1002/(sici)1522-2594(199904)41:4<743::aid-mrm13>3.0.co;2-z. [DOI] [PubMed] [Google Scholar]
- (138).Martinez-Zaguilan R, Seftor EA, Seftor RE, Chu YW, Gillies RJ, Hendrix MJ. Clin Exp Metastasis. 1996;14:176–86. doi: 10.1007/BF00121214. [DOI] [PubMed] [Google Scholar]
- (139).Raghunand N, Mahoney B, van Sluis R, Baggett B, Gillies RJ. Neoplasia. 2001;3:227–35. doi: 10.1038/sj.neo.7900151. [DOI] [PMC free article] [PubMed] [Google Scholar]
- (140).Robey IF, Baggett BK, Kirkpatrick ND, Roe DJ, Dosescu J, Sloane BF, Hashim AI, Morse DL, Raghunand N, Gatenby RA, Gillies RJ. Cancer Res. 2009;69:2260–8. doi: 10.1158/0008-5472.CAN-07-5575. [DOI] [PMC free article] [PubMed] [Google Scholar]
- (141).Gil S, Zaderenzo P, Cruz F, Cerdan S, Ballesteros P. Bioorg Med Chem. 1994;2:305–14. doi: 10.1016/s0968-0896(00)82186-0. [DOI] [PubMed] [Google Scholar]
- (142).Bhujwalla ZM, Artemov D, Ballesteros P, Cerdan S, Gillies RJ, Solaiyappan M. NMR Biomed. 2002;15:114–9. doi: 10.1002/nbm.743. [DOI] [PubMed] [Google Scholar]
- (143).Ojugo AS, McSheehy PM, McIntyre DJ, McCoy C, Stubbs M, Leach MO, Judson IR, Griffiths JR. NMR Biomed. 1999;12:495–504. doi: 10.1002/(sici)1099-1492(199912)12:8<495::aid-nbm594>3.0.co;2-k. [DOI] [PubMed] [Google Scholar]
- (144).Mason RP. Curr Med Chem. 1999;6:481–99. [PubMed] [Google Scholar]
- (145).Garcia-Martin ML, Martinez GV, Raghunand N, Sherry AD, Zhang S, Gillies RJ. Magn Reson Med. 2006;55:309–315. doi: 10.1002/mrm.20773. [DOI] [PubMed] [Google Scholar]
- (146).Provent P, Benito M, Hiba B, Farion R, Lopez-Larrubia P, Ballesteros P, Remy C, Segebarth C, Cerdan S, Coles JA, Garcia-Martin ML. Cancer Res. 2007;67:7638–45. doi: 10.1158/0008-5472.CAN-06-3459. [DOI] [PubMed] [Google Scholar]
- (147).Gil MS, Cruz F, Cerdan S, Ballesteros P. Bioorganic & Medicinal Chemistry Letters. 1992;2:1717–1722. doi: 10.1016/s0968-0896(00)82186-0. [DOI] [PubMed] [Google Scholar]
- (148).Garcia-Martin ML, Herigault G, Remy C, Farion R, Ballesteros P, Coles JA, Cerdan S, Ziegler A. Cancer Res. 2001;61:6524–31. [PubMed] [Google Scholar]
- (149).Ward KM, Balaban RS. Magn Reson Med. 2000;44:799–802. doi: 10.1002/1522-2594(200011)44:5<799::aid-mrm18>3.0.co;2-s. [DOI] [PubMed] [Google Scholar]
- (150).Aime S, Barge A, Delli Castelli D, Fedeli F, Mortillaro A, Nielsen FU, Terreno E. Magn Reson Med. 2002;47:639–48. doi: 10.1002/mrm.10106. [DOI] [PubMed] [Google Scholar]
- (151).Woods M, Woessner DE, Sherry AD. Chem Soc Rev. 2006;35:500–11. doi: 10.1039/b509907m. [DOI] [PMC free article] [PubMed] [Google Scholar]
- (152).Cai S, Seu C, Kovacs Z, Sherry AD, Chen Y. J Am Chem Soc. 2006;128:13474–8. doi: 10.1021/ja0634526. [DOI] [PubMed] [Google Scholar]
- (153).Yoo B, Pagel MD. Front Biosci. 2008;13:1733–52. doi: 10.2741/2796. [DOI] [PubMed] [Google Scholar]
- (154).Gianolio E, Napolitano R, Fedeli F, Arena F, Aime S. Chem Commun (Camb) 2009:6044–6. doi: 10.1039/b914540k. [DOI] [PubMed] [Google Scholar]
- (155).Gallagher FA, Kettunen MI, Day SE, Hu DE, Ardenkjaer-Larsen JH, Zandt R, Jensen PR, Karlsson M, Golman K, Lerche MH, Brindle KM. Nature. 2008;453:940–3. doi: 10.1038/nature07017. [DOI] [PubMed] [Google Scholar]
- (156).Gill SS, Thomas DG, Van Bruggen N, Gadian DG, Peden CJ, Bell JD, Cox IJ, Menon DK, Iles RA, Bryant DJ, et al. J Comput Assist Tomogr. 1990;14:497–504. doi: 10.1097/00004728-199007000-00001. [DOI] [PubMed] [Google Scholar]
- (157).Weiner MW, Hetherington H, Hubesch B, Karczmar G, Massie B, Maudsley A, Meyerhoff DJ, Sappey-Marinier D, Schaefer S, Twieg DB, et al. NMR Biomed. 1989;2:290–7. doi: 10.1002/nbm.1940020519. [DOI] [PubMed] [Google Scholar]
- (158).Kurhanewicz J, Vigneron DB, Nelson SJ. Neoplasia. 2000;2:166–89. doi: 10.1038/sj.neo.7900081. [DOI] [PMC free article] [PubMed] [Google Scholar]
- (159).Mueller-Lisse UG, Swanson MG, Vigneron DB, Hricak H, Bessette A, Males RG, Wood PJ, Noworolski S, Nelson SJ, Barken I, Carroll PR, Kurhanewicz J. Magn Reson Med. 2001;46:49–57. doi: 10.1002/mrm.1159. [DOI] [PubMed] [Google Scholar]
- (160).Jacobs MA, Barker PB, Argani P, Ouwerkerk R, Bhujwalla ZM, Bluemke DB. J Magn Reson Imaging. 2005;21:23–28. doi: 10.1002/jmri.20239. [DOI] [PubMed] [Google Scholar]
- (161).Lehnhardt FG, Bock C, Rohn G, Ernestus RI, Hoehn M. NMR Biomed. 2005;18:371–82. doi: 10.1002/nbm.968. [DOI] [PubMed] [Google Scholar]
- (162).Mountford CE, Somorjai RL, Malycha P, Gluch L, Lean C, Russell P, Barraclough B, Gillett D, Himmelreich U, Dolenko B, Nikulin AE, Smith IC. Br J Surg. 2001;88:1234–40. doi: 10.1046/j.0007-1323.2001.01864.x. [DOI] [PubMed] [Google Scholar]
- (163).Li X, Lu Y, Pirzkall A, McKnight T, Nelson SJ. J Magn Reson Imaging. 2002;16:229–37. doi: 10.1002/jmri.10147. [DOI] [PubMed] [Google Scholar]
- (164).Manton DJ, Chaturvedi A, Hubbard A, Lind MJ, Lowry M, Maraveyas A, Pickles MD, Tozer DJ, Turnbull LW. Br J Cancer. 2006;94:427–35. doi: 10.1038/sj.bjc.6602948. [DOI] [PMC free article] [PubMed] [Google Scholar]
- (165).Hu J, Vartanian SA, Xuan Y, Latif Z, Soulen RL. Magn Reson Imaging. 2005;23:571–6. doi: 10.1016/j.mri.2005.02.011. [DOI] [PubMed] [Google Scholar]
- (166).Laprie A, Pirzkall A, Haas-Kogan DA, Cha S, Banerjee A, Le TP, Lu Y, Nelson S, McKnight TR. Int J Radiat Oncol Biol Phys. 2005;62:20–31. doi: 10.1016/j.ijrobp.2004.09.027. [DOI] [PubMed] [Google Scholar]
- (167).Taylor JS, Langston JW, Reddick WE, Kingsley PB, Ogg RJ, Pui MH, Kun LE, Jenkins JJ, 3rd, Chen G, Ochs JJ, Sanford RA, Heideman RL. Int J Radiat Oncol Biol Phys. 1996;36:1251–61. doi: 10.1016/s0360-3016(96)00376-8. [DOI] [PubMed] [Google Scholar]
- (168).Wald LL, Nelson SJ, Day MR, Noworolski SE, Henry RG, Huhn SL, Chang S, Prados MD, Sneed PK, Larson DA, Wara WM, McDermott M, Dillon WP, Gutin PH, Vigneron DB. J Neurosurg. 1997;87:525–34. doi: 10.3171/jns.1997.87.4.0525. [DOI] [PubMed] [Google Scholar]
- (169).Kurhanewicz J, Swanson MG, Nelson SJ, Vigneron DB. J Magn Reson Imaging. 2002;16:451–63. doi: 10.1002/jmri.10172. [DOI] [PMC free article] [PubMed] [Google Scholar]
- (170).Carroll PR, Coakley FV, Kurhanewicz J. Rev Urol. 2006;8(Suppl 1):S4–S10. [PMC free article] [PubMed] [Google Scholar]
- (171).Hricak H, Williams RD, Spring DB, Moon KL, Jr., Hedgcock MW, Watson RA, Crooks LE. AJR Am J Roentgenol. 1983;141:1101–10. doi: 10.2214/ajr.141.6.1101. [DOI] [PubMed] [Google Scholar]
- (172).Jacobs MA, Ouwerkerk R, Petrowski K, Macura KJ. Top Magn Reson Imaging. 2008;19:261–72. doi: 10.1097/RMR.0b013e3181aa6b50. [DOI] [PMC free article] [PubMed] [Google Scholar]
- (173).Loening NM, Chamberlin AM, Zepeda AG, Gonzalez RG, Cheng LL. NMR Biomed. 2005;18:413–20. doi: 10.1002/nbm.973. [DOI] [PubMed] [Google Scholar]
- (174).Nelson SJ, Graves E, Pirzkall A, Li X, Antiniw Chan A, Vigneron DB, McKnight TR. J Magn Reson Imaging. 2002;16:464–76. doi: 10.1002/jmri.10183. [DOI] [PubMed] [Google Scholar]
- (175).Zaider M, Zelefsky MJ, Lee EK, Zakian KL, Amols HI, Dyke J, Cohen G, Hu Y, Endi AK, Chui C, Koutcher JA. Int J Radiat Oncol Biol Phys. 2000;47:1085–96. doi: 10.1016/s0360-3016(00)00557-5. [DOI] [PubMed] [Google Scholar]
- (176).Sawyers CL. Nature. 2008;452:548–52. doi: 10.1038/nature06913. [DOI] [PubMed] [Google Scholar]
- (177).Weissleder R, Pittet MJ. Nature. 2008;452:580–9. doi: 10.1038/nature06917. [DOI] [PMC free article] [PubMed] [Google Scholar]
- (178).Medarova Z, Pham W, Farrar C, Petkova V, Moore A. Nat Med. 2007;13:372–7. doi: 10.1038/nm1486. [DOI] [PubMed] [Google Scholar]
- (179).Law M, Cha S, Knopp EA, Johnson G, Arnett J, Litt AW. Radiology. 2002;222:715–21. doi: 10.1148/radiol.2223010558. [DOI] [PubMed] [Google Scholar]
- (180).Haddadin IS, McIntosh A, Meisamy S, Corum C, Styczynski Snyder AL, Powell NJ, Nelson MT, Yee D, Garwood M, Bolan PJ. NMR Biomed. 2009;22:65–76. doi: 10.1002/nbm.1217. [DOI] [PMC free article] [PubMed] [Google Scholar]
- (181).Kurhanewicz J, Vigneron DB, Hricak H, Parivar F, Nelson SJ, Shinohara K, Carroll PR. Radiology. 1996;200:489–96. doi: 10.1148/radiology.200.2.8685346. [DOI] [PubMed] [Google Scholar]
- (182).Gillies RJ, Bhujwalla ZM, Evelhoch J, Garwood M, Neeman M, Robinson SP, Sotak CH, Van Der Sanden B. Neoplasia. 2000;2:139–51. doi: 10.1038/sj.neo.7900076. [DOI] [PMC free article] [PubMed] [Google Scholar]
- (183).Evelhoch JL, Gillies RJ, Karczmar GS, Koutcher JA, Maxwell RJ, Nalcioglu O, Raghunand N, Ronen SM, Ross BD, Swartz HM. Neoplasia. 2000;2:152–65. doi: 10.1038/sj.neo.7900078. [DOI] [PMC free article] [PubMed] [Google Scholar]
- (184).Schwarz AJ, Maisey NR, Collins DJ, Cunningham D, Huddart R, Leach MO. Br J Radiol. 2002;75:959–66. doi: 10.1259/bjr.75.900.750959. [DOI] [PubMed] [Google Scholar]
- (185).deSouza NM, Soutter WP, Rustin G, Mahon MM, Jones B, Dina R, McIndoe GA. Br J Cancer. 2004;90:2326–31. doi: 10.1038/sj.bjc.6601870. [DOI] [PMC free article] [PubMed] [Google Scholar]
- (186).Beloueche-Babari M, Jackson LE, Al-Saffar NM, Workman P, Leach MO, Ronen SM. Cancer Res. 2005;65:3356–63. doi: 10.1158/10.1158/0008-5472.CAN-03-2981. [DOI] [PubMed] [Google Scholar]
- (187).Ross J, Najjar AM, Sankaranarayanapillai M, Tong WP, Kaluarachchi K, Ronen SM. Mol Cancer Ther. 2008;7:2556–65. doi: 10.1158/1535-7163.MCT-08-0015. [DOI] [PMC free article] [PubMed] [Google Scholar]
- (188).Klawitter J, Anderson N, Klawitter J, Christians U, Leibfritz D, Eckhardt SG, Serkova NJ. Br J Cancer. 2009;100:923–31. doi: 10.1038/sj.bjc.6604946. [DOI] [PMC free article] [PubMed] [Google Scholar]
- (189).Sankaranarayanapillai M, Tong WP, Yuan Q, Bankson JA, Dafni H, Bornmann WG, Soghomonyan S, Pal A, Ramirez MS, Webb D, Kaluarachchi K, Gelovani JG, Ronen SM. Mol Imaging. 2008;7:92–100. [PubMed] [Google Scholar]
- (190).Al-Saffar NM, Troy H, Ramirez de Molina A, Jackson LE, Madhu B, Griffiths JR, Leach MO, Workman P, Lacal JC, Judson IR, Chung YL. Cancer Res. 2006;66:427–34. doi: 10.1158/0008-5472.CAN-05-1338. [DOI] [PubMed] [Google Scholar]
- (191).Krishnamachary B, Glunde K, Wildes F, Mori N, Takagi T, Raman V, Bhujwalla ZM. Cancer Res. 2009;69:3464–71. doi: 10.1158/0008-5472.CAN-08-4120. [DOI] [PMC free article] [PubMed] [Google Scholar]
- (192).Campos JM, Nunez MC, Sanchez RM, Gomez-Vidal JA, Rodriguez-Gonzalez A, Banez M, Gallo MA, Lacal JC, Espinosa A. Bioorg Med Chem. 2002;10:2215–31. doi: 10.1016/s0968-0896(02)00054-8. [DOI] [PubMed] [Google Scholar]
- (193).Lacal JC. IDrugs. 2001;4:419–26. [PubMed] [Google Scholar]
- (194).Meister G, Tuschl T. Nature. 2004;431:343–9. doi: 10.1038/nature02873. [DOI] [PubMed] [Google Scholar]
- (195).Fire A, Xu S, Montgomery MK, Kostas SA, Driver SE, Mello CC. Nature. 1998;391:806–11. doi: 10.1038/35888. [DOI] [PubMed] [Google Scholar]
- (196).Gallagher FA, Kettunen MI, Hu DE, Jensen PR, Zandt RI, Karlsson M, Gisselsson A, Nelson SK, Witney TH, Bohndiek SE, Hansson G, Peitersen T, Lerche MH, Brindle KM. Proc Natl Acad Sci U S A. 2009;106:19801–6. doi: 10.1073/pnas.0911447106. [DOI] [PMC free article] [PubMed] [Google Scholar]
- (197).Artemov D, Solaiyappan M, Bhujwalla ZM. Cancer Res. 2001;61:3039–44. [PubMed] [Google Scholar]
- (198).Kato Y, Holm DA, Okollie B, Artemov D. Neuro Oncol. 2010;12:71–9. doi: 10.1093/neuonc/nop006. [DOI] [PMC free article] [PubMed] [Google Scholar]
- (199).Wolf W, Presant CA, Waluch V. Adv Drug Deliv Rev. 2000;41:55–74. doi: 10.1016/s0169-409x(99)00056-3. [DOI] [PubMed] [Google Scholar]
- (200).van Laarhoven HW, Klomp DW, Rijpkema M, Kamm YL, Wagener DJ, Barentsz JO, Punt CJ, Heerschap A. NMR Biomed. 2007;20:128–40. doi: 10.1002/nbm.1098. [DOI] [PubMed] [Google Scholar]
- (201).Li C, Penet MF, Winnard P, Jr., Artemov D, Bhujwalla ZM. Clin Cancer Res. 2008;14:515–22. doi: 10.1158/1078-0432.CCR-07-1837. [DOI] [PubMed] [Google Scholar]
- (202).Reid DG, Murphy PS. Drug Discov Today. 2008;13:473–80. doi: 10.1016/j.drudis.2007.12.011. [DOI] [PubMed] [Google Scholar]
- (203).Yu J-X, Cui W, Zhao D, Mason RP. In: Fluorine and Health. Tressaud A, Haufe G, editors. Elsevier B.V.; Amsterdam: 2008. [Google Scholar]
- (204).Kato Y, Okollie B, Artemov D. Magn Reson Med. 2006;55:755–61. doi: 10.1002/mrm.20831. [DOI] [PubMed] [Google Scholar]
- (205).Griffiths JR, Glickson JD. Adv Drug Deliv Rev. 2000;41:75–89. doi: 10.1016/s0169-409x(99)00057-5. [DOI] [PubMed] [Google Scholar]
- (206).O'Reilly SM, Newlands ES, Glaser MG, Brampton M, Rice-Edwards JM, Illingworth RD, Richards PG, Kennard C, Colquhoun IR, Lewis P, et al. Eur J Cancer. 1993;29A:940–2. doi: 10.1016/s0959-8049(05)80198-4. [DOI] [PubMed] [Google Scholar]
- (207).Gillies RJ, Raghunand N, Garcia-Martin ML, Gatenby RA. IEEE Eng Med Biol Mag. 2004;23:57–64. doi: 10.1109/memb.2004.1360409. [DOI] [PubMed] [Google Scholar]


