Abstract
To date the molecular signals regulating activation, proliferation, and differentiation of hepatic oval cells are not fully understood. The Wnt family is essential in hepatic embryogenesis and implicated in hepatic carcinogenesis. This study elucidates novel findings implicating Wnt1 in directing oval cell differentiation during the rat 2-acetylaminofluorene (2AAF) and ⅔ partial hepatectomy (PHx) liver regeneration model. Proteins of Wnt family members were predominantly localized in pericentral hepatocytes during liver injury, oval cell activation, and hepatocyte regeneration. In addition, Wnt message increased coinciding with the rise in oval cell number, whereas protein levels peaked immediately after the height of oval cell proliferation. Immunohistochemical analysis demonstrated nuclear translocation of β-catenin within oval cells throughout the 2AAF/PHx protocol. Furthermore, RNA interference was used in vivo to confirm the physiological requirement of Wnt1 during the oval cell induction. Ultimately, inhibition of Wnt1 resulted in failure of oval cells to differentiate into hepatocytes and alternatively induced atypical ductular hyperplasia. Taken together, these data indicate that in vivo exposure to Wnt1 shRNA inhibited rat oval cell liver regeneration. In the absence of Wnt1 signaling, oval cells failed to differentiate into hepatocytes and underwent atypical ductular hyperplasia, exhibiting epithelial metaplasia and mucin production. Furthermore, changes in Wnt1 levels are required for the efficient regeneration of the liver by oval cells during massive hepatic injury.
In 1956 E. Farber recognized that the same cell type appeared in the liver after several different chemical injury models.1 He classified these small cells with high nuclear to cytoplasmic ratios as oval cells.2,3 Although debate continues as to the site of origin of these cells, they are universally considered to be the resident hepatic stem cell.4,5,6,7 Some suggest that oval cells arise in the Canal of Hering, whereas others believe they arise from an extra hepatic source.8,9,10 In situ oval cells are bipotential in nature11,12 and when present in the liver they differentiate toward both hepatic and bile ductular epithelial lineages.13 Molecular characterization of the oval cell population has been fruitful, but these cells have still not been completely classified. Oval cells have been manipulated both in vitro and in vivo toward numerous different cell types of various germ layers, thereby demonstrating their pluripotentiality.14,15 Although this is significant for future therapeutics, until the natural functions of oval cells within the liver are understood, the true potential of the oval cell will remain hidden.
This study elucidates the signals that guide an oval cell’s differentiation toward a hepatic lineage. Previous works had demonstrated the requirement of Wnt in normal liver development, as well as the role of β-catenin in regulation of liver growth and regeneration.16 The Wnt family is a known regulator of stem cells that guides self renewal and differentiation, and, therefore, Wnt could possess some control over oval cell fate during stem cell–based liver regeneration.
The Wnt family of secreted proteins controls various differentiation pathways during numerous stages of embryogenesis, including hepatic development.17,18,19,20,21 Wnts have been shown to maintain stem cells in an undifferentiated state while increasing self renewal, and they have been shown to direct progenitor differentiation.22,23,24,25,26 They have also been implicated in hepatocyte-based liver regeneration after partial hepatectomy.16,20 With known Wnt involvement in hepatic organogenesis and regeneration, investigating the role of this family during stem cell directed liver regeneration seemed logical.
This study outlines the requirement of Wnt signaling for the differentiation of oval cells toward a hepatic lineage. Without exposure to Wnt, oval cells defaulted to a ductular epithelial state and failed to aid in the regenerative process. This study only begins to elucidate a better understanding of the role of certain signaling proteins in oval cell-based regeneration. In addition, the current studies open the door to several other avenues for the classification of the liver stem cell’s functions.
Materials and Methods
Animals
Male F344 rats (8 to 10 weeks of age and 150 to 180 g weight) were purchased from Charles River Laboratories (Wilmington, MA) and maintained on standard laboratory chow and daily cycles of alternating 12 hours of light and dark. All animal work was conduced under protocols approved by the IACUC at the University of Florida.
Oval Cell Induction in the Rat
2-AAF pellets (70 mg/28-day release, 2.5 mg/d) from Innovative Research Inc. (Sarasota, FL) were implanted 7 days before partial hepatectomy (PHx) as previously described.27,28,29 Rats were hepatectomized under anesthesia according to the methods described by Higgins and Anderson.30
Density-Based Separation of the Liver Parenchymal Cells
The liver was harvested at 9 days post-PHx during oval cell induction, and cells were isolated via standard two-step collagenase perfusion. The suspension was filtered through a 125 μm nylon mesh and centrifuged at 50 × g to pellet the majority of hepatocytes. The nonparenchymal cell fraction was then pelleted by centrifugation at 1000 rpm. As previously described two Nycodenz stock solutions at 30% (wt./vol.) were prepared, one with cyanol FF, one without.31 The stock solutions were subsequently serially diluted to 26, 19 (blue), 15, and 13% (blue) in 1× PBS and 1.5 ml sequentially layered. The nonparenchymal cell fraction was resuspended in 11% Nycodenz solution and loaded on the top of the gradient and centrifuged at 6000 × g for 30 minutes. Cells from the interphases were collected and washed in 1× PBS and then used for protein or RNA isolation. The resulting four fractions contained immune cells and stellate cells (F1), oval cells (F2), small hepatocytes and Kupffer cells (F3) and hepatocytes (F4).
The shRNA Vector
A shRNA hairpin to the rat Wnt1 gene was constructed with shRNA Wizard (InvivoGen, San Diego, CA). A custom-made psiTNA-H1gz-Wnt1 plasmid was then created by InvivoGen. As a control, a vector containing a scrambled (SCR) shRNA construct that is not complimentary to any known gene was used. The vector contained a 21nt sequence incorporated into a hairpin with a 7nt spacer region. Supplemental Figure 1A and 1B represent the hairpins for the Wnt1 and SCR vectors, respectively, and Supplemental Figures 2 and 3 for plasmid construct and analysis (available at http://ajp.amjpathol.org). The vector was grown in Gt116 cells with Zeocin (Invitrogen, Carlsbad, CA) selective media. The plasmid was isolated with the Qiagen Maxi kit (Qiagen Inc., Chatsworth, CA).
In Vivo Administration of shRNA to Wnt1
Animals underwent 2-AAF implantation and ⅔ PHx as previously described. 250 μg of shRNA vector was complexed with 20 μl of in vivo JetPEI (Polyplus Transfection, New York, NY). 400 μl were injected via the femoral vein to each animal in a solution with a final concentration of 5% glucose on days 3 and 6 post-PHx. Three animals per time point received the SCRsh vector, and five per time point received the Wnt1sh vector. Animals were sacrificed at days 9, 11, 13, 15, and 21 days post-PHx. See Supplemental Figure 1C for a diagrammatic representation of the shRNA model in the rat (available at http://ajp.amjpathol.org).
Microscopy and Immunostaining
To detect protein expression, liver tissues were formalin fixed and embedded in paraffin and sectioned to 5 μm. Immunostaining for proteins was detected using ABC-HRP and DAB kits or ABC-AP and Vector Blue kits (Vector Laboratories, Burlingame, CA) as per manufacturer’s instructions. Fluorescent secondary antibodies used were conjugated to Alexa Fluor-488 and 594 (Invitrogen). Antigen retrieval was performed using citrate for β-catenin or GFP, and Trilogy (Cell Marque, Hot Springs, AK) for AFP for 25 minutes at 95°C. All staining of primary antibodies were performed overnight at 4°C. Antibodies used were as follows: β-catenin 1:800 (BD Biosciences # 610153); OV6 at 1:150 (Gift from S. Sell Albany, NY); CD45 at 1:100 (BD Biosciences #554875); Wnt1 at 1:50 (Santa Cruz Biotechnology, Santa Cruz, CA #sc-6280); Frizzled 2 (Santa Cruz #sc-7429); AFP at 1:800 (Dako #A0008); and GFP at 1 μg/ml (Abcam # ab6556). The microscope, camera, and software used to assess Immunohistochemistry (IHC) were a BX51 Olympus Fluorescent microscope fitted with cubes for FITC, Texas Red, DAPI and dual pass FITC/Texas Red, an Optromic Digital Camera with Image Pro 3.1 Software, and Magnafire 3.1. All confocal microscopy was performed by Doug Smith at the University of Florida Stem Cell program on the Leica TCS SP2 AOBS Spectral Confocal Microscope with the LCS (Leica Confocal Software) Version 2.61, Build 1537 software.
Western Blotting
Equivalent concentrations of liver lysates from 3 replicate animals were pooled to create each protein sample to increase statistical significance. The protein was separated by SDS-PAGE and transferred to Immun-Blot PVDF membrane (Bio-Rad, Hercules, CA) using standard techniques. Antibodies used for immunoblotting were as follows: Wnt1 at 1:1000 (Santa Cruz #sc-6280); β-catenin at 1:2000 (BD Biosciences #6101530); Phospho-β-catenin at 1:1000 (Cell Signaling #9561); β-Actin at 1:5000 (Abcam #3280); and horseradish peroxidase (HRP)-conjugated IgG antibodies (Santa Cruz Biotechnology) secondary antibodies. ECL plus Western blotting detection kit (Amersham Biosciences, Piscataway, NJ) was used for development of the membrane.
Real-Time PCR of Wnt1
RNA isolation was performed with RNABee Reagent (Tel-Test, Inc., Friendswood, TX) as per manufacturer’s instructions with 5 μg of pooled RNA from 3 replicate animals. Equivalent concentrations of RNA were pooled to create each sample to increase statistical significance. Samples were also analyzed in triplicate. First strand cDNA was synthesized using SuperScript First-Strand Synthesis System (Invitrogen) as per manufacturer’s instructions. For the analysis of Wnt1 message levels, 2 μl of cDNA and 1.25 μl each of forward and reverse Wnt1 primer were added to 25 μl of Power SYBR Green PCR Master Mix (Applied Biosystems, Foster City, CA). The sequences of the Wnt1 primers are as follows: Forward: 5′-TTCTGCTACGTTGCTACTGGCACT-3′ and Reverse: 5′-CATTTGCACTCTTGGCGCATCTCA-3′. The reaction was performed on an ABI Prism 7700 Sequence Detection System. The thermocycle sequence consisted of 10 minutes at 95°C and then 40 cycles of 95°C for 30 seconds, 51°C for 30 seconds, and 60°C for 30 seconds. QuantumRNA 18S Internal Standards (Ambion, Austin, TX) were used to amplify 18S message as an internal control. The ratio of 18S primer:competimer was 3:7.
Densitometric Analysis
All densitometric analysis was performed on with BioRad Quantity One 1-D Analysis Software Version 4.6.1 Build 055 as per manufacturer’s instructions.
Statistical Analysis
All results are expressed as the means ± SD. Statistical differences were determined by Student t test. P values <0.05 were considered to be statistically significant.
Confirmation of Wnt1 Knockdown in PC12/Wnt1 Cells
Wnt1 stably transfected rat pheochromocytoma cells (PC12/Wnt1) were graciously donated by G.M. Shackleford (Division of Hematology-Oncology, The Saban Research Institute, Children’s Hospital Los Angeles, CA). PC12/Wnt1 cells were grown in Ham’s F12K medium with 2 mmol/L l-glutamine adjusted to contain 1.5 g/L sodium bicarbonate, 15% horse serum, 2.5% bovine calf serum, 10 I.U. penicillin/ml, and 10 μg/ml streptomycin in a 37°C humidified incubator containing 5% CO2 and 95% air, and passaged using 0.25% trypsin plus 0.02% EDTA treatment. PC12/Wnt1 cells were grown to 80% confluency in a 6-well dish and transfected with 4.0 μg of DNA using Lipofectamine 2000 (Invitrogen) as per manufacturer’s instructions. After 48 hours Wnt1 mRNA and protein levels were analyzed by rtPCR and Western blot.
Confirmation of shRNA Plasmids
The plasmid was resuspended and amplified as per manufacturer’s instructions. Plasmid purity was analyzed by restriction enzyme digestion with AseI (New England Biolabs, Ipswich, MA) as per manufacturers’ recommendations. AseI yielded a linearized 3448-bp plasmid when the shRNA hairpin is present. When absent, AseI digestion of shRNA yields two bands of 1801 bp and 1647 bp. Also DpnI (NEB) digestion was used to distinguish between the SCRsh vector and the Wnt1sh vector. DpnI digestion of Wnt1sh vector resulted in 8 bands of the following sizes: 1747 bp, 593 bp, 536 bp, 277 bp, 202 bp, 75 bp, 11 bp, and 8 bp, whereas the DpnI digestion of the SCRsh vector yielded 8 bands of the following sizes: 1747 bp, 795 bp, 536 bp, 277 bp, 202 bp, 75 bp, 11 bp, and 8 bp.
Results
Wnt1 Expression during Oval Cell Induction
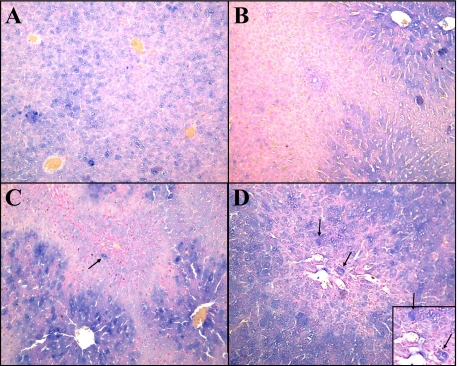
During oval cell activation, various members of the Wnt family, including Wnt3, Wnt5a, and Wnt7, were up-regulated (Data not shown). Levels of Wnt1 increase during peak oval cell production within the cytoplasm of pericentral and interzonal hepatocytes (Figure 1, A–D).
Figure 1.
Staining of Wnt1 during 2AAF/PHx. A: Day 0. B: Day 3. C: Day nine. D: Day 13. Wnt1 is produced by hepatocytes within hours of PHx, as seen in liver obtained at the time of PHx. Pericentral hepatocytes production of Wnt1 can be seen as early as Day three, and levels increase throughout oval cell induction. Hepatocytes engulfed by the migrating oval cells express high levels of Wnt 1 (black arrow). Magnification, ×20.
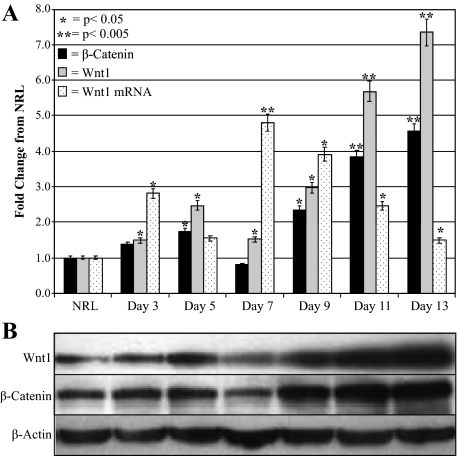
Real-time PCR of Wnt1 mRNA levels throughout 2AAF/PHx quantitatively demonstrated a statistically relevant increase in Wnt1 message levels before and during the peak in oval cell production (Figure 2A).
Figure 2.
Changes in Wnt1 and β-catenin levels during oval cell induction. A: Densitometric analysis of β-catenin and Wnt1 Western Blots and real-time PCR analysis of Wnt1 mRNA levels during oval cell induction. B: Western blots of β-catenin and Wnt1 during oval cell activation. All densitometric data were normalized to β-actin levels and compared with NRL. Wnt1 mRNA expression increases before the peak in oval cell production (Day nine). Significant message level differences occur during oval cell induction as compared with NRL. Western blots of oval cell induction demonstrate β-catenin and Wnt1 levels increase dramatically after seven days, which is the peak in Wnt1 message expression.
Western blot analysis of protein pooled from three individual animals collected from various time points of the oval cell induction protocol further confirmed the Wnt1 expression profile visualized by IHC (Figure 2B). Both Wnt1 and β-catenin protein levels rapidly increase during the initial stages of oval cell induction and past the peak of oval cell proliferation with levels dropping as liver regeneration is completed around day 21. The Wnt1 mRNA data correlated with the Wnt1 protein analysis indicates a strong relationship between Wnt1 expression and the oval cell induction protocol.
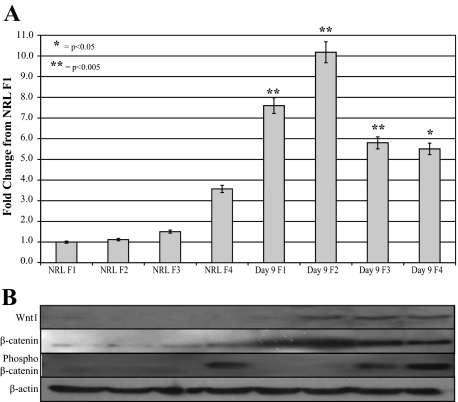
Western blot analysis of protein from the four fractions obtained by Nycodenz gradient centrifugation of nonparenchymal cell fraction further confirmed the up-regulation of Wnt1 and β-catenin levels in cells from 2AAF/PHx Day 9 as compared with normal rat liver (NRL) (Figure 3, A and B). More specifically, phosphorylation of β-catenin, an indicator of β-catenin degradation and a lack of Wnt signaling is localized to hepatocyte fractions alone in NRL, whereas during oval cell induction hepatocytes have an increased levels of both phosphorylated and nonphosphorylated β-catenin in conjunction with expressing Wnt1. This suggests production of Wnt1 without initiating canonical Wnt signaling within this cell fraction. Low levels of phosphorylation are found in the oval cell fraction, but the dramatic 9.08-fold increase in β-catenin levels in F2 as compared with the NRL F2 signifies a major decrease in the ubiquitination and destruction of β-catenin in oval cells attributable to canonical Wnt signaling in these oval cells.
Figure 3.
β-catenin levels of liver cell fractions. Cells isolated from liver by Nycodenze density-based gradient were analyzed by Western blot for Wnt1, β-catenin, and phosphorylated (inactive) β-catenin. A: Densitometric analysis of β-catenin Western blot. All data were normalized to β-actin levels and compared with NRL F1. B: Western blot of cells isolated by perfusion from normal liver or Day 9 of the oval cell induction model. NRL cells fail to express Wnt1; however, after oval cell induction, cells within fractions two through four express Wnt1. β-catenin is considerably increased in cells isolated from Day nine liver, whereas inactive phosphorylated β-catenin levels are the same in the hepatocyte fraction, increase in the small hepatocyte fraction, and are almost absent from oval cells during oval cell induction.
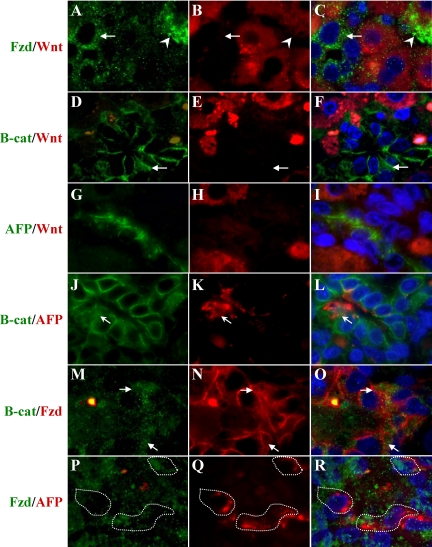
As oval cells begin to infiltrate the liver an increase in Fzd2 expression on oval cells appears as early as Day 5 (Data not shown). Hepatocytes surrounded by streaming oval cells migrating toward the central vein activate high levels of Wnt1 expression as visualized by IHC (Figure 1). The oval cells in close approximation to these Wnt1 expressing hepatocytes upregulate Fzd2 (Arrows) expression (Figure 4, A–C). This indicates an active paracrine Wnt1 signaling as the oval cells express the receptor but fail to upregulate the ligand. There are also infrequent hepatocytes that express Fzd2 (arrowheads) signifying autoregulation of Wnt signaling in hepatocytes in contrast to the more abundant paracrine signaling between hepatocytes and oval cells. As demonstrated by IHC Fzd2 expression can be seen in oval cells throughout oval cell induction and differentiation, especially within oval cells in close proximity to pericentral hepatocytes expressing Wnt1.
Figure 4.
Dual Staining of Wnt1, β-catenin, AFP, and Fzd2 in 2AAF/PHx Day nine Livers. A–C: Fzd2 (green) and Wnt1 (red). The arrow indicates Fzd+/Wnt1− oval cell, and the arrowhead represents a Fzd+/Wnt1+ hepatocyte. The majority of hepatocytes are Fzd−/Wnt1+. Whereas no oval cell express Wnt1, all express Fzd2. D–F: β-catenin (green) and Wnt1 (red). Pericentral hepatocytes express Wnt1within their cytoplasm, and oval cells translocate β-catenin to the nucleus in response to Wnt signaling (arrow). G–I: AFP (green) and Wnt1 (red). No AFP+ oval cell expresses Wnt1, which is confined to hepatocytes. K–L: β-catenin (green) and AFP (red). Although all oval cells are not AFP+, β-catenin nuclear translocation can only be identified in dual AFP+/β-catenin+ stained cells. M–O: Fzd2 (green) and β-catenin (red). Colocalization of β-catenin nuclear translocation and Fzd2 can be seen in these oval cells (arrows). P–Q: Fzd2 (green) and AFP (red). Dual AFP+/Fzd2+ cells are outlined. Fzd2 staining was much weaker in the presence of Trilogy retrieval required for the AFP antibody. Magnification, ×100.
Wnt1 signaling does not induce β-catenin nuclear translocation except in adjacent oval cells (Figure 4, D–F, arrowheads). β-catenin expression is not confined to adherens junctions within the oval cells as it is in adjacent hepatocytes. Cytoplasmic and nuclear localization of β-catenin is indicative of active canonical Wnt signaling pathway. Also, Wnt1 is not expressed in any oval cells as demonstrated by the lack of Wnt1 expression in AFP positive oval cells (Figure 4, G–I). However, AFP-positive oval cells do display nuclear translocation of β-catenin as seen in Figure 4, J–L (arrows). Translocation of β-catenin to the nucleus in the presence of the Fzd2 receptor indicates activation of the canonical Wnt pathway as seen by dual-stained β-catenin and Fzd2 cells (Figure 4, M–O, arrows). Lastly, AFP-positive oval cells express Fzd2 (Figure 4, P–R, outlined cells). Note the staining for Fzd2 was much weaker in the presence of the Trilogy retrieval needed for the AFP antibody.
All data previously collected revealed a correlation between Wnt1 levels and oval cell activation. Although phosphorylation status of β-catenin and imaging of β-catenin nuclear translocation confirm the theory that oval cells respond to Wnt1 signaling through the Fzd2 receptor, none of these data actually demonstrate a direct oval cell response to Wnt signaling.
Inhibition of Wnt1 in Vivo with shRNA during Oval Cell Induction
To determine the effectiveness of the designed Wnt1 shRNA vector, PC12 cells previously reported to constitutively express murine Wnt1 were transfected with the shRNA in complex with Lipofectamine 2000 (Invitrogen). Although PC12/Wnt1 cells were highly resistant to the transfection (approximately 60% transfection efficiency) after 48 hours cells exposed to the shRNA exhibited a 41.8% decrease in cytoplasmic Wnt1 expression (Supplemental Figure 3 available at http://ajp.amjpathol.org).
Analysis of GFP expression through IHC allowed for determination of efficient shRNA vector delivery to target tissues (Supplemental Figure 4 available at http://ajp.amjpathol.org). Although expression levels were not uniform across all tissues, GFP expression and therefore Wnt1 shRNA expression was found in all tissues analyzed, and expression was not limited to vascular endothelium.
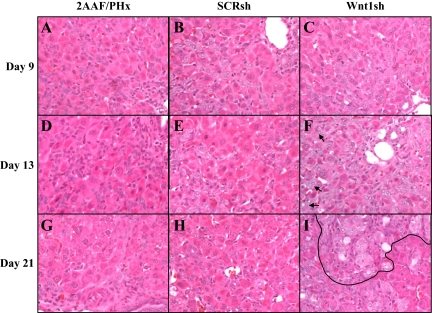
Histological analysis of Wnt1 shRNA-treated animals revealed morphological changes in oval cell–based liver regeneration after Wnt1 shRNA treatment (Figure 5, A–L). Oval cell morphology appeared unremarkable on Day 9. However, atypical ductular hyperplasia (ADH) was present as early as 13 days after PHx. Oval cells also appeared to be more numerous than in SCRsh-treated animals. Also, no basophilic hepatocytes emerged in Wnt1sh-treated animals. The remaining Wnt1 shRNA–treated animals exhibited ADH within 15 days of PHx. As of 21 days after PHx, ADH appears throughout the liver (Figure 5I, area outlined in black), and oval cells persist in streams extending from portal triads toward other portal triads.
Figure 5.
H&E of livers from shRNA-treated animals. 2AAF/PHx: A, D, and G; SCR shRNA–treated: B, E, and H; Wnt1 shRNA–treated: C, F, and I. Day 9: A–C; Day 13: D–F; Day 21: G–I. Histologically livers in Wnt shRNA–treated animals are similar to nontreated or SCR-treated individuals at Day nine. However, as early as 13 to 15 days after PHx ADH appears in Wnt shRNA–treated animals (arrow). Ultimately, 21 days after PHx, Wnt shRNA–treated animals exhibited large regions of ADH (outline) as early as Day 15 and persistent oval cell streaming from portal triads to other portal triads (arrow). SCR shRNA–treated animals were unremarkable. Magnification, ×40.
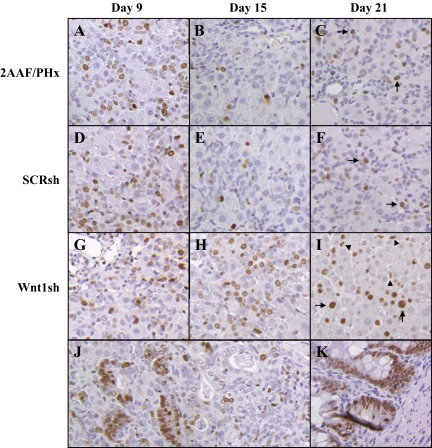
Oval cells appear in the liver during the 2AAF/PHx model as early as Day 3 but increase in number through further recruitment and proliferation until maximum numbers appear between Days 9 and 11. Then these cells begin to differentiate toward a hepatic lineage. Ki-67 staining of 2AAF/PHx and SCR shRNA–treated animals confirms this with high levels of proliferation seen on Day 9 (Figure 6, A and D) Approximately a 47% decrease in the proliferation rate of oval cells can be seen Wnt shRNA–treated animas at Day 9, but by day 13 the proliferation rate of oval cells has surpassed it SCRsh counterparts (data not shown). Wnt1sh RNA–treated animals continue to have numerous small cells dividing throughout the oval cell induction model even as late as day 21 (Figure 6, G–I), whereas in the 2AAF protocol and SCRsh-treated animals by Day 15 proliferation has disappeared in the oval cell fraction and a scant number of hepatocytes no longer under the influence of 2AAF begin to divide (Figure 6, B and E) On Day 21 in SCR shRNA–treated and untreated animals as well as in Wnt1 shRNA–treated animals a few hepatocytes can be identified as dividing, but the few remaining oval cells are virtually quiescent in the SCRsh or untreated animals. (Figure 6, C, F, and I, arrows). On Day 21 within sites of ADH and non ADH areas of Wnt1 shRNA–treated animals numerous small oval cells can be seen dividing (Figure 6, I–K, arrowheads).
Figure 6.
Ki-67 comparison of 2AAF/Phx versus shRNA-treated animals. A: 2AAF/PHx Day nine. B: 2AAF/PHx Day 15. C: 2AAF/PHx Day 21. D: SCR shRNA Day nine. E: SCR shRNA Day 15. F: SCR shRNA Day 21. G: Wnt1 shRNA Day nine. H: Wnt1 shRNA Day 15. I: Wnt1 shRNA Day 21. J: Wnt1 shRNA Day 21 area of ADH. K: Intestine (positive control); proliferation of oval cells nine days after PHx in shRNA-treated animals mimics that observed in 2AAF/PHx alone. In 2AAF/PHx alone and SCR shRNA–treated animals by day 15 proliferation has subsided as oval cells begin differentiating. Upon recovering from the influence of 2AAF, hepatocytes can be seen to divide 21 days after PHx in SCR and control animals (arrows). On the contrary, oval cells in Wnt1 shRNA–treated animals have an approximately 47% decrease in proliferation on Day nine but increase their proliferation rate by Day 13 (data not shown) and continue to proliferate 15 days after PHx (arrow heads). Also, in Wnt1 shRNA–treated animals hepatocytes that have begun to recover from the influence of 2AAF exhibit a very high proliferative rate 21 days after PHx (arrows), whereas under normal conditions the liver has completely recovered and division is unnecessary 21 days after PHx. It can also be observed that the cells within sites of atypical ductular hyperplasia are also rapidly dividing 21 days after PHx. Magnification, ×20.
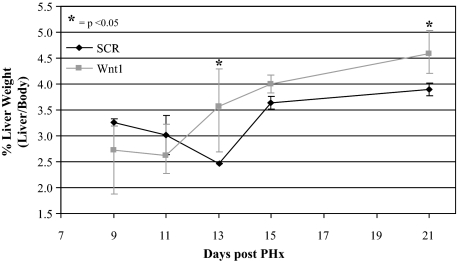
Animals and their livers at the time of sacrifice after exposure to shRNA were weighed and the percentage of liver weight calculated as liver weight/body weight × 100 (Figure 7). Wnt1 shRNA–treated animals initially demonstrated no significant difference in their percent liver weights; however, by day 9 Wnt1 shRNA–treated animal percent liver weights were on average 0.8% higher than those treated with SCR shRNA (P < 0.05). After histological examination and Ki-67 staining, it was possible to conclude this change in percent liver weight was attributable to increased oval cell recruitment, oval cell division, and development of ADH.
Figure 7.
Percent liver weights of shRNA-treated animals. % liver weight (liver weight/body weight) was calculated and averaged for all animals treated with shRNA. The livers of animals treated with shRNA to Wnt1 initially were no larger than those treated with SCR shRNA. However, as time progressed their livers actually surpassed the size of their scrambled counterparts. This coincides with the Ki-67 analysis of these samples. The livers of rats exposed to Wnt1si RNA have an increased percentage of Ki-67–positive livers indicating continued cell proliferation through out the oval cell induction model, whereas SCR-treated animal livers undergo little division after the peak in oval cell numbers.
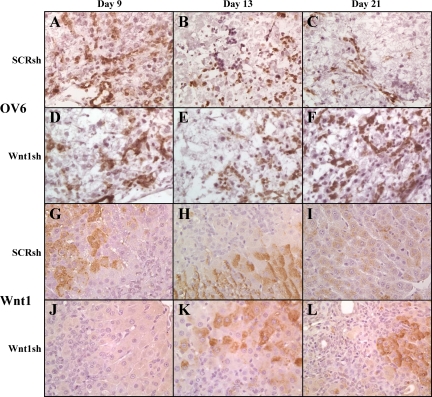
Confirmation that the infiltrating cells seen as late as Day 21 in Wnt1sh-treated animals were oval cells was achieved by staining frozen sections for OV6 (Figure 8, A–F). Oval cell numbers in Wnt1 shRNA–treated animals approximated those in SCR shRNA–treated and nontreated (data not shown) animals 9 days post PH, though by Day 13 the numbers of OV6-positive cells decrease and by 21 days post PHx oval cells are virtually nonexistent in SCR shRNA–treated and untreated animals (Figure 8C and data not shown). On Day 21, the cells within the sites of ADH and the persistent streaming cells continue to exhibit OV6 staining (Figure 8F). Minimal CD45 staining in both nontreated and treated animals signifies the cells infiltrating the livers are not of an inflammatory origin at any point during the oval cell induction model or shRNA treatment (data not shown).
Figure 8.
OV6 and Wnt1 staining of the livers of shRNA-treated animals. A–F: OV6 staining of fresh frozen sections. G–L: Wnt1 staining of paraffin sections. A–C and G–I: Wnt1 shRNA–treated animals. D–F and J–L: SCR shRNA–treated animals; A, D, G, and J: Day nine. B, E, H, and K: Day 13. C, F, I, and L: Day 21. Oval cells from 2AAF/PHx and SCR shRNA–treated animals express OV6 in high levels early in oval cell induction before their differentiation, and pericentral hepatocytes express Wnt1 (2AAF/PHx data not shown). In vivo treatment of animals with Wnt1 shRNA on Days three and six post PHx, inhibits Wnt1 expression until at least Day 13. After 21 days, Wnt1 expression returns to interzonal and pericentral hepatocytes. OV6 levels stay fairly constant during Wnt1 shRNA treatment whereas in SCR shRNA–treated animals the numbers of OV6-positive cells diminish after 13 days, and the cells are practically nonexistent as of Day 21. SCR shRNA staining is indistinguishable from 2AAF/PHx staining (data not shown) Magnification, ×40.
Wnt1 levels were also assessed by IHC (Figure 8, G–L). Although in the standard oval cell induction protocol Wnt1 protein levels are high on Day 9, they were nonexistent by IHC in Wnt1 shRNA–treated animals until Day 13, seven days after the last injection of the shRNA. Intense expression of Wnt1 appeared in virtually all hepatocytes at this time. On Day 21 hepatocytes of Wnt1 shRNA–treated animals were still expressing Wnt1, whereas in the SCR shRNA–treated or nontreated animals Wnt1 expression had subsided (Figure 8I and data not shown).
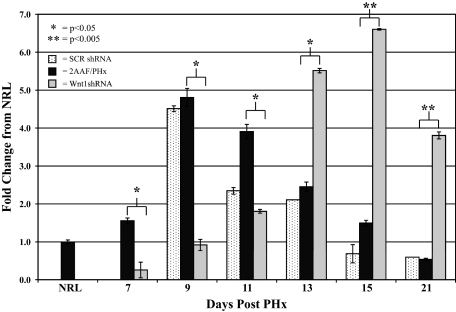
Real-time PCR analysis of Wnt1 levels confirmed IHC analysis of Wnt1 levels in shRNA-treated animals (Figure 9). Animals treated with the scrambled vector demonstrated no appreciable variation in Wnt1 message as compared with 2AAF/PHx control. Wnt1 shRNA–treated animals, however, displayed a delayed expression of Wnt1. Wnt1 message was virtually absent from the animals one day after the last injection with a rapid increase in expression levels 11 days after PHx. This correlates with the Wnt1 IHC previously shown.
Figure 9.
Real-time PCR analysis of Wnt1 expression in shRNA-treated animals. Comparison of Wnt1 levels of 2AAF/PHx, Wnt1 shRNA–treated, and SCR shRNA–treated animals on Days 7, 9, 11, 13, 15, and 21 after PHx and normalized to normal rat liver. Wnt1 shRNA–treated animals exhibited virtually no Wnt1 message until 13 days after PHx, whereas SCR-treated animals demonstrated no significant difference as compared with 2AAF/PHx animals.
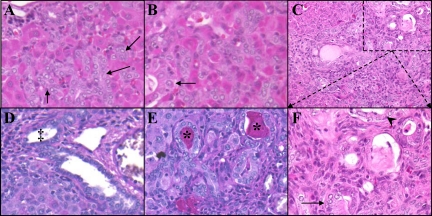
Further examination of the morphology of the ADH present in Wnt1 shRNA–treated animals revealed a potentially preneoplastic state (Figure 10). The hyperplastic ducts began appearing on Day 9 (Figure 10A. Arrows), only three days after the last Wnt1 shRNA injection. Initially the morphology of the ducts was identical to that of a standard bile duct, small cuboidal cells with a basilar nucleus, but by Day 15 the cytology had began to change (Figure 10B, arrow). Not only were the sites of hyperplasia present in nearly all liver lobules, but the cells in some ducts had undergone metaplasia. Ducts could be visualized with both columnar (arrow) and squamous (arrowhead) metaplasia (Figure 10C, and inset 10F). Also these hyperplastic ducts were producing mucin (Figure 10E, asterisk), which is absent in normal liver or livers from any time during 2AAF/PHx oval cell induction (Figure 10D, ‡).
Figure 10.
Atypical ductular hyperplasia within Wnt1 shRNA–treated animals. A: H & E Day nine. B: H & E Day 13. C and F: H & E Day 21. D: Periodic acid-Schiff staining of 2AAF/PHx Day nine. E: Periodic acid-Schiff staining of Wnt1 shRNA–treated animal day 21. F: Magnification of outlined area of C allowing for closer examination of ADH. Treatment with shRNA to Wnt1 in the 2AAF/PHx model induces oval cells to undergo differentiation toward a ductular lineage. Ducts that remain retain a fairly normal cuboidal morphology (A and B, arrows) until 15 to 21 days post PHx. At this point, ADH ensues. As seen in D, some ducts undergo transformation into columnar (arrow) and even squamous (arrowhead) phenotypes. The atypical ducts are mucin positive (asterisks), whereas, ducts found in the standard 2AAF/PHx protocol are mucin negative (‡). This indicates the atypical ducts are no longer of a biliary lineage. Magnification in A, B, D, E, and F: ×40; in C: ×20.
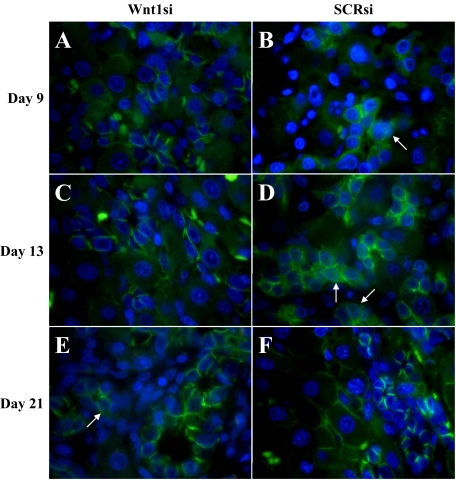
To determine whether the areas of ADH present in the Wnt1 shRNA–treated animals were attributable to a lack of early exposure to Wnt1 or instead attributable to latent exposure to Wnt1 after the effects of the shRNA waned, β-catenin staining was performed. Although not shown, localization of β-catenin in SCR shRNA was equivalent to β-catenin staining in the standard 2AA/PHx model. β-catenin was translocated to the nucleus in oval cells from SCR shRNA–treated animals during the Day 9 to 13 peak in Wnt1 protein levels (Figure 11, B and D, arrows), whereas the oval cells of Wnt1 shRNA–treated animals fail to translocate β-catenin to the nucleus until Day 21 (Figure 11, A and C, Day 15 data not shown). Conversely, by Day 21 occasional oval cells of Wnt1 shRNA–treated animals do translocate β-catenin, but this phenomenon is not present in the control group (Figure 11, E [arrow] and F).
Figure 11.
β-catenin staining of shRNA-treated animals. A, C, and E: Wnt shRNA–treated animals; B, D, and F: SCR shRNA–treated animals; A and B: Day nine. C and D: Day 13. E and F: Day 21. β-catenin activation and nuclear translocation (arrows) is present in numerous oval cells at the peak of oval cell numbers (Day 9) in the 2AAF/PHx model (data not shown) and SCR shRNA–treated animals and are very prevalent during the initiation of oval cell differentiation (Day 13). Oval cells of Wnt1 shRNA–treated animals do not translocate β-catenin at the peak of oval cell numbers, but instead a few rare cells can be identified in areas of ADH on Day 21.
Discussion
The data presented in this study demonstrate a clear link between Wnt1 signaling and oval cell–based liver regeneration. Although this link has previously been shown in murine and rat models, our study follows the expression of Wnt1 throughout the entire process of oval cell activation and differentiation allowing for a greater understanding of the role of Wnt1 within oval cell–based liver regeneration.32,33 Furthermore, in contrast with Apte et al, our data indicate an increase in Wnt1 levels during oval cell activation (2AAF and PHx) as seen by real-time PCR, whereas they only demonstrated an increase induced by 2AAF alone. The increase and decrease seen with message levels of Wnt1 correspond directly to the delayed increase and subsequent decrease seen in Wnt1 protein levels by Western blot analysis in the oval cell induction protocol.
The data in this article also confirm Apte et al’s reasoning that hepatocytes express and secrete Wnt1 in response to massive hepatic injury (2AAF/PHx). Apte et al then went on to show Fzd2 expression in oval cells from the 2AAF/PHx protocol.33 This article confirms that discovery (demonstrated in Figures 1–4) and further outlines the requirement of this canonical Wnt pathway for oval cell differentiation. Oval cells invade the liver and respond to Wnt1 signaling through Fzd2 by decreasing phosphorylation of β-catenin and translocating it to their nucleus to activate Wnt responsive genes. The message levels of Wnt1 rise during and at the point of peak oval cell production (approximately Day 9 of the 2AAF/PHx protocol), but protein levels are delayed in reaching their maximum. Fzd2 expression also appears after Wnt1 induction in oval cells in close approximation to pericentral hepatocytes expressing Wnt1. This clearly indicates that Wnt1 is not responsible for recruiting oval cells to the liver as the oval cells do appear in the liver as demonstrated by OV6 staining, however the approximate 47% decrease in oval cell proliferation at Day 9 does confirm the suspicion that Wnt1 is involved in oval cell proliferation, but the oval cells also proliferate more rapidly on Days 11 and 13 as shown by Ki-67 staining when compared with controls indicating Wnt1 is not completely responsible for oval cell proliferation and another mechanism directs this rapid proliferation. This does not exclude the ability for the other Wnt family members to assume this responsibility and/or other Wnt family members could be compensating for the loss of Wnt1 signal initiating oval cell proliferation as see by Hu et al in the murine 3,5-diethoxycarbonyl-1,4-dihydrocollidine (DDC) oval cell model.32 Conversely, the continued proliferation and presence of these OV6-positive cells in the absence of early exposure to Wnt1 protein indicates that Wnt1 signaling through the Fzd2 receptor is essential in guiding oval cells down a hepatic differentiation path through a paracrine signaling mechanism.
To provide evidence that Wnt1 is required for oval cell differentiation, a shRNA designed to Wnt1 is used in vivo during oval cell–based liver regeneration. In shRNA-treated animals Wnt1 message as well as protein expression are effectively suppressed during peak oval cell induction. The shRNA knockdown of Wnt1 message lasts at least beyond 9 days post PHx but less than 13 days post PHx. As expected the effect of the shRNA is transient as there is a drastic upregulation of Wnt1 mRNA levels as well as IHC evidence of protein 13 days after PHx, which is seven days after the second and last injection of Wnt1 shRNA. The resurgence of Wnt1 expression is merely attributable to loss of effect of shRNA, which typically last 2 to 3 days in vivo although this study is fortunate to have demonstrated an effect for approximately 1 week.
Inhibition of Wnt1 in vivo did not delay oval cell migration into the liver, further indicating Wnt1 is not required for recruitment of oval cells but instead is involved in oval cell differentiation. Nevertheless, without Wnt1 signaling, oval cells were forced toward a biliary lineage and underwent ADH. In compensation, as the effects of 2AAF faded, hepatocytes began rapidly dividing to reform the functional liver that the oval cells were unable to generate. Also as the Wnt1 signaling was absent, the newly recruited oval cells failed to translocate β-catenin to their nucleus. Occasional cells do demonstrate translocation of β-catenin to the nucleus, which is never present in SCR shRNA–treated animals, but this response could not compensate for the previous lack of Wnt1 expression. As the effects of the Wnt1 shRNA faded and the Wnt1 signal returned, these aberrant oval cells fail to respond to this signal. Essentially, Wnt1 through the canonical pathway directs oval cells to differentiate into hepatocytes and oval cells are unable to differentiate and function normally in the presence of the Wnt1 shRNA. Also importantly, ADH is in fact not attributable to untimely Wnt-1 resurgence that impacts altered oval cells and induces untimely β-catenin activation.
As an alternative, these data could further be confirmed with the use of specific small molecule antagonists of the Wnt canonical pathway; however, the complete loss of Wnt1 message in the presence of our shRNA is convincing evidence that Wnt1 alone is responsible for these effects.
Instead of oval cells simply creating numerous bile ducts, there is morphological evidence that these cells are potentially going through a preneoplastic process. Within the foci of proliferating ducts, epithelial metaplasia occurred. At the end of the study, every animal that was treated with shRNA toward Wnt1 had large areas of ADH, and in about 5 to 10% of ducts either columnar or squamous metaplasia was present. Chromatin within the metaplastic ducts appeared irregular, but no definitive signs of dysplasia were present. The epithelial metaplasia in conjunction with mucin production is indicative of a preneoplastic process, but no further claims can be made.
Wnt/β-catenin signaling has been previously linked to atypical ductular proliferation (ADP) in the mouse DDC model.32 The cells found within areas of ADP in the DDC murine model express Wnt/β-catenin signaling, whereas in our model β-catenin signaling is very rare in the areas of ADH. However, in the mouse DDC oval cell induction model, once DDC is removed the ADP regresses and the oval cells disappear. There has never been a direct link between the oval cells that appear during DDC exposure and their differentiation toward a hepatic lineage within the same animal. Once removed these cells can be placed in another liver and develop into hepatocytes, but within the DDC exposed liver they do not further transition toward a hepatic lineage. For this reason, we feel that the DDC model does induce a transient amplifying group of cells potentially similar but not identical to the oval cells found in the Solt-Farber model. The fact that these cells upregulate the Wnt canonical pathway implicates that they are attempting to differentiate as seen in the 2AAF/PHx model but are unable to facilitate the transition. Perhaps these cells need another signal that rat oval cells do not need to facilitate this transition. Also Wnt1 is the only signal preventing the severe atypical ductular hyperplastic phenotype in rats, but in the murine model the overproliferation of the transient amplifying cells is sufficient to induce ADP. Also if one removes DDC the ADP will regress, however in our model the return of Wnt1 expression does not cause regression of the ADH. In fact, reexpression of Wnt1 seems to show no effect on the ADH, as the areas of ADH expand dramatically even in the presence of Wnt1 and the cells with the areas of ADH only intermittently translocated β-catenin indicating rare activation of the canonical pathway. These very few cells are not sufficient in number to determine the cell fate of the areas of ADH. This suggests that tight control of Wnt1 over the initial growth and differentiation of rat oval cells is required, and without this early tight control there are drastic consequences.
Although this study definitively demonstrates a role of Wnt1 in oval cell–based liver regeneration and indicates a potentially prenoeplastic state when Wnt1 is absent, it must be repeated and time points collected later than 21 days after PHx. The presence of these atypical ducts is encouraging with regard to indicating an oval cell origin of cholangiocarcinoma, but at this stage no comments can be elicited as to their true purpose. These atypical ducts have two potential paths: they could turn neoplastic or they could regress. Only a longer study could differentiate between these two possible outcomes.
Wnt Signaling Is Required During Oval Cell–Based Liver Regeneration
No previous study has shown the requirement of any member of the Wnt family in the direction and facilitation of oval cell differentiation. Wnts have been implicated in this process, but no definitive correlation has been established until now. Also, the mechanism by which Wnt signals are sent and received has only recently been postulated by Apte et al. This research clearly confirms a hepatic origin of the Wnt1 signal and an oval cell response to this signal through Fzd2 expression and β-catenin translocation. When compared with the levels of phosphorylation of β-catenin, the dramatic increase in protein levels of β-catenin without a subsequent increase in β-catenin message can only be explained by Wnt signaling inhibiting the ubiquitination and subsequent degradation of β-catenin. Also, when Wnt1 signaling is absent, oval cells behave distinctly different from when in the presence of Wnt1.
Knowledge of the signals necessary to induce oval cells to differentiate into hepatocytes is currently very limited. In culture, the cytokine milieu needed for inducing hepatocyte differentiation is mixed and fairly nonspecific. Also the results are not consistent: not all cytokine mixtures force all oval cells in culture to differentiate. This indicates that either not all of the cells are being triggered or there is a heterogeneous population being evaluated. Including Wnt1 in this differentiation media could induce more rapid and more complete differentiation in vitro.
Increasing the understanding of the regulation of stem cells can only aid in our understanding of the things that can potentially go wrong during initiation and promotion of tumors. It may be that Wnt1 is the only signal preventing oval cells from becoming cancerous during stem cell–based liver regeneration. This is possibly a reason why oval cells are rarely seen in human livers. The need for oval cells must be so great as to risk the potential damage they could inflict if tight control on them is not maintained. This risk need not be taken in normal situations as hepatocytes have the immense capacity for proliferation necessary to resolve most hepatic injuries. Perhaps oval cells are only seen in humans when hepatocyte function is beyond repair and the need outweighs the potential for damage induced by dysregulation of the hepatic stem cell.
Footnotes
Address reprint requests to Bryon E. Petersen, Ph.D., University of Florida College of Medicine, Department of Pathology, PO Box 100275, 1600 SW Archer Rd., Rm. M641 MSB, Gainesville, FL 32610. E-mail: petersen@pathology.ufl.edu.
Supported by National Institute of Health grants DK60015 and DK58614 (to B.E.P.).
Supplemental material for this article can be found on http://ajp.amjpathol.org.
References
- Farber E. Similarities in the sequence of early histologic changes induced in the liver of the rat by ethionine, 2-acetylaminoflouorene, and 3′-methyl-4-dimethylaminoazbenzene. Cancer Res. 1956;16:142–148. [PubMed] [Google Scholar]
- Fausto N. Liver stem cells: the liver biology and pathobiology. Arias IM, Boyer JL, editors. New York: Raven Press,; 1994:pp. 1501–1518. [Google Scholar]
- Petersen BE, Zajac VF, Michalopoulos GK. Hepatic oval cell activation in response to injury following chemically induced periportal or pericentral damage in rats. Hepatology. 1998;27:1030–1038. doi: 10.1002/hep.510270419. [DOI] [PubMed] [Google Scholar]
- Petersen BE, Goff JP, Greenberger JS, Michalopoulos GK. Hepatic oval cells express the hematopoietic stem cell marker Thy-1 in the rat. Hepatology. 1998;27:433–445. doi: 10.1002/hep.510270218. [DOI] [PubMed] [Google Scholar]
- Petersen BE. Hepatic “stem” cells: coming full circle. Blood Cells Mol Dis. 2001;27:590–600. doi: 10.1006/bcmd.2001.0422. [DOI] [PubMed] [Google Scholar]
- Petersen BE, Hatch HM. Stem cell culture: liver stem cells. Atala A, Lanza RP, editors. San Diego, CA: Academic Press,; Methods of tissue engineering. 2001:pp. 429–437. [Google Scholar]
- Petersen BE, Grossbard B, Hatch H, Pi L, Deng J, Scott EW. Mouse A6-positive hepatic oval cells also express several hematopoietic stem cell markers. Hepatology. 2003;37:632–640. doi: 10.1053/jhep.2003.50104. [DOI] [PubMed] [Google Scholar]
- Petersen BE, Bowen WC, Patrene KD, Mars WM, Sullivan AK, Murase N, Boggs SS, Greenberger JS, Goff JP. Bone marrow as a potential source of hepatic oval cells. Science. 1999;284:1168–1170. doi: 10.1126/science.284.5417.1168. [DOI] [PubMed] [Google Scholar]
- Lemire JM, Fausto N. Multiple alpha-fetoprotein RNAs in adult rat liver: cell type-specific expression and differential regulation. Cancer Res. 1991;51:4656–4664. [PubMed] [Google Scholar]
- Petersen BE, Zajac VF, Michalopoulos GK. Bile ductular damage induced by methylene dianiline inhibits oval cell activation. Am J Pathol. 1997;151:905–909. [PMC free article] [PubMed] [Google Scholar]
- Theise ND, Nimmakayalu M, Gardner R, Illei PB, Morgan G, Teperman L, Henegariu O, Krause DS. Liver from bone marrow in humans. Hepatology. 2000;32:11–16. doi: 10.1053/jhep.2000.9124. [DOI] [PubMed] [Google Scholar]
- Lagasse E, Connors H, Al Dhalimy M, Reitsma M, Dohse M, Osborne L, Wang X, Finegold M, Weissman IL, Grompe M. Purified hematopoietic stem cells can differentiate into hepatocytes in vivo. Nat Med. 2000;6:1229–1234. doi: 10.1038/81326. [DOI] [PubMed] [Google Scholar]
- Kinosita R. Studies on the cancerogenic chemical substances. Trans Japanese Pathol Soc. 1937:665–727. [Google Scholar]
- Deng J, Steindler DA, Laywell ED, Petersen BE. Neural trans-differentiation potential of hepatic oval cells in the neonatal mouse brain. Exp Neurol. 2003;182:373–382. doi: 10.1016/s0014-4886(03)00058-x. [DOI] [PubMed] [Google Scholar]
- Lowes KN, Croager EJ, Olynyk JK, Abraham LJ, Yeoh GC. Oval cell-mediated liver regeneration: role of cytokines and growth factors. J Gastroenterol Hepatol. 2003;18:4–12. doi: 10.1046/j.1440-1746.2003.02906.x. [DOI] [PubMed] [Google Scholar]
- Monga SP, Pediaditakis P, Mule K, Stolz DB, Michalopoulos GK. Changes in WNT/beta-catenin pathway during regulated growth in rat liver regeneration. Hepatology. 2001;33:1098–1109. doi: 10.1053/jhep.2001.23786. [DOI] [PMC free article] [PubMed] [Google Scholar]
- Gordon MD, Nusse R. Wnt signaling: multiple pathways, multiple receptors, and multiple transcription factors. J Biol Chem. 2006;281:22429–22433. doi: 10.1074/jbc.R600015200. [DOI] [PubMed] [Google Scholar]
- Smalley MJ, Dale TC. Wnt signalling in mammalian development and cancer. Cancer Metastasis Rev. 1999;18:215–230. doi: 10.1023/a:1006369223282. [DOI] [PubMed] [Google Scholar]
- Wodarz A, Nusse R. Mechanisms of Wnt signaling in development. Annu Rev Cell Dev Biol. 1998;14:59–88. doi: 10.1146/annurev.cellbio.14.1.59. [DOI] [PubMed] [Google Scholar]
- Thompson MD, Monga SP. WNT/beta-catenin signaling in liver health and disease. Hepatology. 2007;45:1298–1305. doi: 10.1002/hep.21651. [DOI] [PubMed] [Google Scholar]
- Cadoret A, Ovejero C, Saadi-Kheddouci S, Souil E, Fabre M, Romagnolo B, Kahn A, Perret C. Hepatomegaly in transgenic mice expressing an oncogenic form of beta-catenin. Cancer Res. 2001;61:3245–3249. [PubMed] [Google Scholar]
- Kostakopoulou K, Vogel A, Brickell P, Tickle C. ‘Regeneration’ of wing bud stumps of chick embryos and reactivation of Msx-1 and Shh expression in response to FGF-4 and ridge signals. Mech Dev. 1996;55:119–131. doi: 10.1016/0925-4773(95)00492-0. [DOI] [PubMed] [Google Scholar]
- Reya T, Duncan AW, Ailles L, Domen J, Scherer DC, Willert K, Hintz L, Nusse R, Weissman IL. A role for Wnt signalling in self-renewal of haematopoietic stem cells. Nature. 2003;423:409–414. doi: 10.1038/nature01593. [DOI] [PubMed] [Google Scholar]
- Willert K, Brown JD, Danenberg E, Duncan AW, Weissman IL, Reya T, Yates JR, III, Nusse R. Wnt proteins are lipid-modified and can act as stem cell growth factors. Nature. 2003;423:448–452. doi: 10.1038/nature01611. [DOI] [PubMed] [Google Scholar]
- Bienz M, Clevers H. Linking colorectal cancer to Wnt signaling. Cell. 2000;103:311–320. doi: 10.1016/s0092-8674(00)00122-7. [DOI] [PubMed] [Google Scholar]
- Lee SM, Tole S, Grove E, McMahon AP. A local Wnt-3a signal is required for development of the mammalian hippocampus. Development. 2000;127:457–467. doi: 10.1242/dev.127.3.457. [DOI] [PubMed] [Google Scholar]
- Evarts RP, Nagy P, Nakatsukasa H, Marsden E, Thorgeirsson SS. In vivo differentiation of rat liver oval cells into hepatocytes. Cancer Res. 1989;49:1541–1547. [PubMed] [Google Scholar]
- Hixson DC, Faris RA, Thompson NL. An antigenic portrait of the liver during carcinogenesis. Pathobiology. 1990;58:65–77. doi: 10.1159/000163565. [DOI] [PubMed] [Google Scholar]
- Novikoff PM, Yam A, Oikawa I. Blast-like cell compartment in carcinogen-induced proliferating bile ductules. Am J Pathol. 1996;148:1473–1492. [PMC free article] [PubMed] [Google Scholar]
- Higgins GM, Anderson RM. Experimental pathology of the liver: restoration of the liver of the white rat following partial surgical removal. Arch Pathol. 1931;12:186–202. [Google Scholar]
- Dabeva MD, Petkov PM, Sandhu J, Oren R, Laconi E, Hurston E, Shafritz DA. Proliferation and differentiation of fetal liver epithelial progenitor cells after transplantation into adult rat liver. Am J Pathol. 2000;156:2017–2031. doi: 10.1016/S0002-9440(10)65074-2. [DOI] [PMC free article] [PubMed] [Google Scholar]
- Hu M, Kurobe M, Jeong YJ, Fuerer C, Ghole S, Nusse R, Sylvester KG. Wnt/beta-catenin signaling in murine hepatic transit amplifying progenitor cells. Gastroenterology. 2007;133:1579–1591. doi: 10.1053/j.gastro.2007.08.036. [DOI] [PubMed] [Google Scholar]
- Apte U, Thompson MD, Cui S, Liu B, Cieply B, Monga SP. Wnt/beta-catenin signaling mediates oval cell response in rodents. Hepatology. 2008;47:288–295. doi: 10.1002/hep.21973. [DOI] [PubMed] [Google Scholar]


