Abstract
Ammonia absorption by the medullary thick ascending limb of Henle’s loop (MTALH) is thought to be a critical step in renal ammonia handling and excretion in urine, in which it is the main acid component. Basolateral Na+/H+ exchangers have been proposed to play a role in ammonia efflux out of MTALH cells, which express 2 exchanger isoforms: Na+/H+ exchanger 1 (NHE1) and NHE4. Here, we investigated the role of NHE4 in urinary acid excretion and found that NHE4–/– mice exhibited compensated hyperchloremic metabolic acidosis, together with inappropriate urinary net acid excretion. When challenged with a 7-day HCl load, NHE4–/– mice were unable to increase their urinary ammonium and net acid excretion and displayed reduced ammonium medulla content compared with wild-type littermates. Both pharmacologic inhibition and genetic disruption of NHE4 caused a marked decrease in ammonia absorption by the MTALH. Finally, dietary induction of metabolic acidosis increased NHE4 mRNA expression in mouse MTALH cells and enhanced renal NHE4 activity in rats, as measured by in vitro microperfusion of MTALH. We therefore conclude that ammonia absorption by the MTALH requires the presence of NHE4 and that lack of NHE4 reduces the ability of MTALH epithelial cells to create the cortico-papillary gradient of NH3/NH4+ needed to excrete an acid load, contributing to systemic metabolic acidosis.
Introduction
Ammonium is the main component of urinary H+ excretion. In addition, its renal production and excretion rise in response to an acid load, thereby allowing the kidney to appropriately increase net acid excretion. Ammonia is produced in proximal tubule cells, mainly by glutamine metabolism, and added to the luminal fluid. Then, the medullary thick ascending limb of Henle’s loop (MTALH) is thought to play a critical role in creating the medullary interstitial ammonia concentration gradient necessary for net NH4+ secretion by the adjacent collecting duct (for review see ref. 1). Accordingly, chronic metabolic acidosis (CMA) induces an adaptive increase in the capacity of the MTALH to absorb ammonium (2) and is associated with a rise in medullary interstitial ammonia content (3). However, urinary ammonium excretion can be maintained in the absence of medullary ammonia accumulation, at least under some conditions, such as with acute furosemide administration, probably because this condition is associated with polyuria (3). In addition, severe dysfunctions of the TAL, such as in Bartter’s syndrome, are associated with metabolic alkalosis rather than acidosis. Therefore, the conditions under which medullary ammonia accumulation is required to allow for sufficient acid excretion in final urine remain uncertain.
Mechanisms involved in the apical entry of ammonia into MTALH cells are now quite well settled. NH4+ enters the cell via the NKCC2 cotransporter (BSC1), which is present on the apical membrane (4, 5), and cotransports this ion with Cl– and Na+ by substituting for K+. In contrast, mechanisms involved in the basolateral exit of NH4+ have not been fully determined. Among the various transporters that are present on the basolateral membrane of MTALH cells, at least 2 have been proposed to play a role in basolateral NH4+ exit. First, the rat MTALH functionally expresses the basolateral DIDS-insensitive NBCn1 cotransporter (6, 7), and recent reports suggest that it could indirectly play a significant role in basolateral NH3 efflux (8, 9). Second, basolateral Na+/H+ exchange may be involved in the NH4+ efflux out of MTALH cells. Indeed, using highly purified basolateral membrane vesicles isolated from rat MTALH cells, Blanchard et al. have shown that Na+/H+ exchangers can operate as Na+/NH4+ exchangers (10). Two distinct Na+/H+ exchanger isoforms, Na+/H+ exchanger 1 (NHE1) and NHE4 (11), are present in the basolateral membrane of MTALH cells. NHE1, the ubiquitous isoform, is likely involved in housekeeping functions (12), such as regulation of cell pH and volume. In contrast, the role of NHE4 and its physiological function in intact MTALH cells remain unsettled.
The purpose of the present study was to investigate the functional role of NHE4 in MTALH cells. The specific aims were to determine whether NHE4 is involved in NH4+ absorption by the MTALH and to elucidate its role in vivo, regarding acid-base balance regulation. We provide the first evidence to our knowledge that NHE4 is important for ammonia transport in the thick ascending limb of Henle’s loop, interstitial ammonia accumulation, and maintenance of a normal systemic acid-base status.
Results
In in vivo studies, mice lacking NHE4 have a defect in renal adaptation to metabolic acidosis.
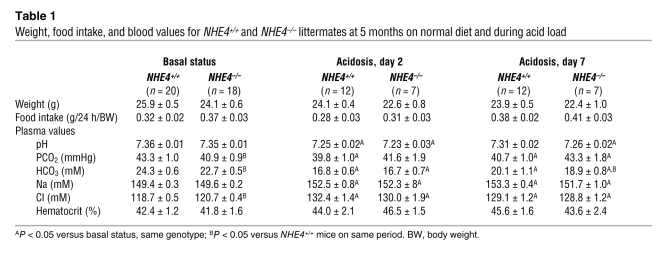
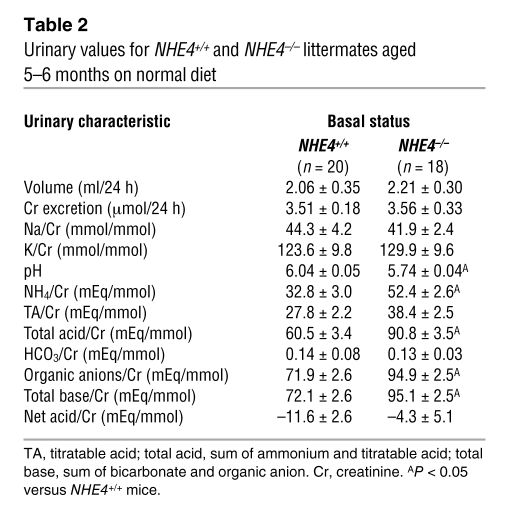
The experiments were carried out using 5- to 6-month-old mice. Throughout the study, body weight and food intake were similar in NHE4–/– and NHE4+/+ littermate mice. Under baseline conditions, NHE4–/– mice exhibited significantly lower plasma bicarbonate and higher plasma chloride concentrations than NHE4+/+ mice; lower levels of blood PCO2 in NHE4–/– mice were responsible for a normal blood pH value (Table 1). Altogether, a compensated hyperchloremic metabolic acidosis was present in NHE4–/– mice. At the same time, despite the fact that NHE4–/– mice had a lower urinary pH, their net acid excretion was the same as that in NHE4+/+ mice, showing the lack of renal adaptation to metabolic acidosis (Table 2).
Table 1 .
Weight, food intake, and blood values for NHE4+/+ and NHE4–/– littermates at 5 months on normal diet and during acid load
Table 2 .
Urinary values for NHE4+/+ and NHE4–/– littermates aged 5–6 months on normal diet
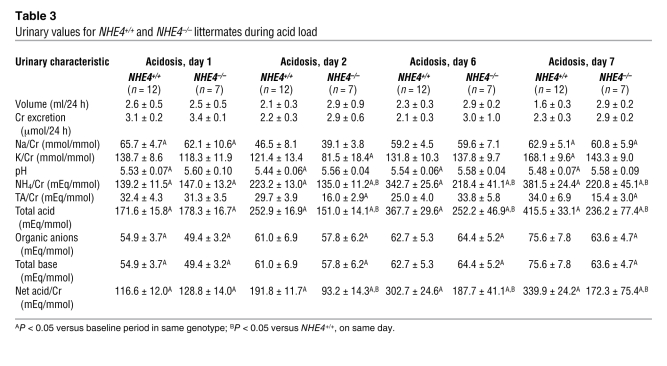
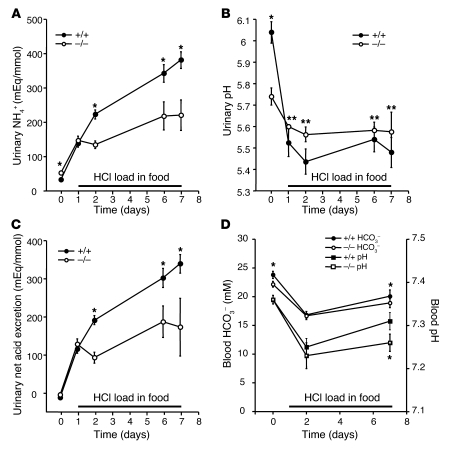
We next investigated the extent to which the lack NHE4 could limit the ability to excrete ammonium during an oral acid load. The effects of both short-term (2 days) and long-term (7 days) acid load were studied (Tables 1 and 3 and Figure 1). In both genotypes, the oral acid load induced a quick, sustained, and quantitatively similar decrease in plasma pH and HCO3– concentrations at day 2 (Table 1 and Figure 1D). Urinary titratable acid excretion did not change significantly as compared with baseline conditions. The urinary ammonia excretion rate increased significantly by the first day of acid loading in NHE4+/+ and NHE4–/– mice; however, with the exception of the first day of acid loading, urinary ammonium excretion remained significantly lower in NHE4–/– mice than in NHE4+/+ mice. Excretion of organic anions decreased significantly in both genotypes during acid loading. As a consequence, net acid excretion also remained lower in NHE4–/– mice than in NHE4+/+ littermates throughout the acid loading period (Table 3 and Figure 1C). Finally, urinary pH levels decreased in NHE4+/+ mice during acid loading, as compared with baseline values (Tables 2 and 3 and Figure 1), but did not decrease in NHE4–/– mice.
Table 3 .
Urinary values for NHE4+/+ and NHE4–/– littermates during acid load
Figure 1. Urinary pH, ammonia and net acid excretions, and blood bicarbonate and pH levels in normal and NHE4–/– littermate mice on a normal diet and during HCl loading.
In response to HCl-induced metabolic acidosis, both NHE4+/+ (filled circles) and NHE4–/– mice (open circles) exhibit a rapid increase in (A) urinary ammonium and (C) net acid excretions. (B) A rapid decrease in urinary pH was also seen in NHE4+/+ mice but not NHE4–/– mice. (D) Blood pH and bicarbonate were significantly lower after 7 days HCl load in NHE4–/– mice. During acid loading, urinary ammonium and net acid excretions were significantly lower in NHE4–/– mice than in NHE4+/+ mice. Values are mean ± SEM (n = 20 and n = 18 at baseline and n = 12 and n = 7 during HCl loading in NHE4+/+ and NHE4–/– mice, respectively). The x axis labels indicate the day of treatment. *P < 0.01; **P < 0.05.
The lack of NHE4 prevents the normal medullary ammonia accumulation during metabolic acidosis.
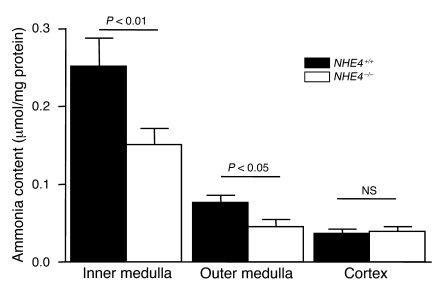
At the end of the acid-loading period, the mice were sacrificed, and the cortical, outer medullary, and inner medullary ammonia contents were measured, as described in the Methods section; the inner and outer medulla ammonia contents were lower by 40% and 30%, respectively, in NHE4–/– mice compared with NHE4+/+ mice, whereas no difference was found in cortical content. This indicates that NHE4 is required for ammonia accumulation in the medulla, at least during metabolic acidosis (Figure 2).
Figure 2. Tissue ammonia content in kidneys from NHE4+/+ and NHE4–/– mice.
Both pharmacological inhibition and genetic disruption of NHE4 decrease NH4+ absorption in MTALH.
Both NHE1 and NHE4 proteins have been identified in the basolateral membrane of MTALH cells (11, 13). NHE1 has been shown to be sensitive to EIPA, whereas NHE4 is much more resistant (11, 14). In this part of the study, this property was used to establish the functionality and the relative contribution to overall Na+/H+ exchange activity of the 2 NHE isoforms in intact MTALH cells.
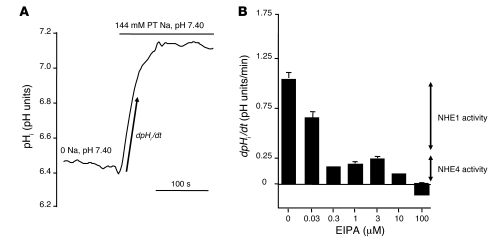
Basolateral Na+/H+ exchange activity was assessed by measuring the rate of change in intracellular pH (pHi) after peritubular Na+ addition in CO2/HCO3–-free solutions. NHE activity decreased with the increase in peritubular EIPA concentration (Figure 3). An initial inhibition plateau was obtained, with peritubular EIPA concentrations ranging from 0.3 to 3 μM. Then, EIPA concentrations above 3 μM elicited a further inhibition, and finally, 100 μM EIPA totally inhibited basolateral Na+/H+ exchange activity. The calculated relative parts of the first (EIPA-sensitive) and second (EIPA-resistant) components of basolateral Na+/H+ exchange activity were 81% and 19%, respectively.
Figure 3. Measurement of basolateral Na+/H+ exchange activity in rat MTALH cells.
Tubules were initially perfused and bathed with a Na+-free, CO2/HCO3–-free, HEPES-buffered solution (solution A). Luminal fluid also contained 0.1 mM furosemide and 1 mM amiloride to prevent apical Na+ entry and proton efflux. After a 2-minute recording, the peritubular (PT) solution was changed to a 144 mM Na+, CO2/HCO3–-free, HEPES-buffered solution (solution B), containing EIPA at various concentrations. The initial rate of pHi recovery (dpHi/dt) was calculated on the linear part of the curve after peritubular Na+ addition. (A) The effect on pHi of peritubular Na+ addition under control conditions. The figure shows an example of the pHi time course, before and after Na+ addition. The arrow shows the initial, linear change in pHi, allowing the calculation of dpHi/dt. In the absence of external Na+, pHi was close to 6.4 and was identical in all experiments regardless to the EIPA concentration. (B) The effect of various peritubular concentrations of EIPA on Na+/H+ exchange activity in the rat MTALH. The inhibition elicited by the various concentrations of EIPA was consistent with the presence of 2 components of Na+/H+ exchange activity with distinct EIPA sensitivities: 0.3 to 3 μM EIPA inhibited approximately 80% of the initial rate of pHi recovery, corresponding to NHE1 activity; 100 μM EIPA was required to completely inhibit pHi recovery (NHE1 and NHE4 activities, shown by arrows).
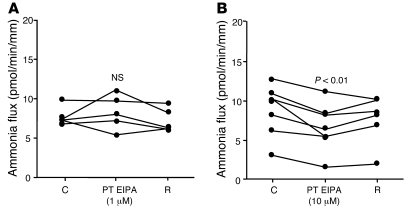
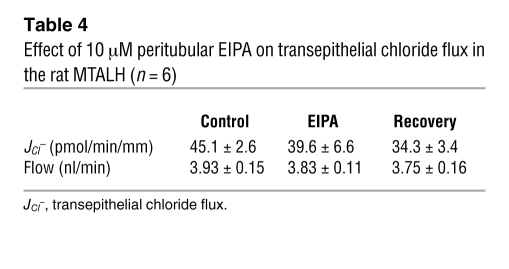
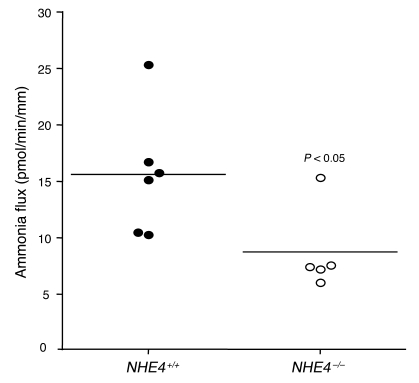
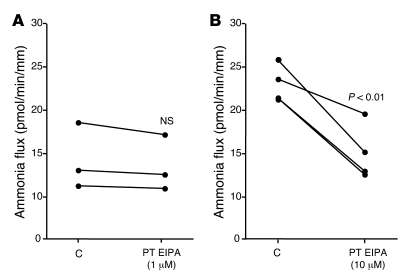
To determine whether at least 1 of the 2 Na+/H+ exchangers was involved in transepithelial ammonia flux, we tested the effects of 1 and 10 μM peritubular EIPA on transepithelial ammonia flux and then measured ammonia absorption in the MTALH from NHE4–/– and NHE4+/+ mice. The effect of 1 and 10 μM peritubular EIPA on transepithelial ammonia flux is summarized in Figure 4. One micromolar of peritubular EIPA had no effect on transepithelial ammonia flux. By contrast, a reversible and significant 30% inhibition of ammonia flux was observed when 10 μM peritubular EIPA was added, with no change in transepithelial voltage (Vte). This result supported an involvement of NHE4 in the process of transepithelial ammonia absorption. To ensure that 10 μM EIPA had no primary effect on the apical step of ammonia transport, Cl– absorption was investigated in the presence of 10 μM EIPA. Transepithelial Cl– absorption did not significantly change in the presence of peritubular EIPA (Table 4). The levels of ammonia absorption by the MTALH harvested from NHE4+/+ and NHE4–/– littermate mice on a normal laboratory diet are shown in Figure 5. Mean values were 15.6 ± 2.2 pmol/min/mm in NHE4+/+ mice and 8.7 ± 1.7 pmol/min/mm in NHE4–/– mice (P < 0.05), showing a 45% decrease in mice lacking NHE4. The fact that both pharmacologic inhibition and genetic disruption of NHE4 decrease NH4+ absorption in the MTALH, supports our hypothesis that NHE4 plays a significant role in total ammonia absorption in the MTALH.
Figure 4. Effect of peritubular EIPA on transepithelial ammonia absorption in the rat MTALH.
(A) The effect of 1 μM peritubular EIPA. Tubules were perfused and bathed with a standard solution, containing 139 mM Na+ and 4 mM NH4+ (solution C). The addition of 1 μM EIPA to the peritubular solution had no effect on Vte (Vte: control [C], 12.1 ± 1.6 mV; 1 μM EIPA, 12.7 ± 1.3 mV; recovery [R], 11.8 ± 1.9 mV; NS; flow rate: control, 3.2 ± 0.4 nl/min; 1 μM EIPA, 3.1 ± 0.3 nl/min; recovery, 3.1 ± 0.3 nl/min; NS) or transepithelial ammonia flux. Individual results obtained with 5 independent tubules are displayed. (B) The effect of 10 μM peritubular EIPA. Addition of 10 μM EIPA to the peritubular solution elicited a decrease in transepithelial ammonia flux. Vte and flow rate were not affected by EIPA (Vte: control, 7.9 ± 1.4 mV; 10 μM EIPA, 9.2 ± 1.4 mV; recovery, 8.7 ± 1.2 mV; NS; flow rate: control, 3.0 ± 0.2 nl/min; 10 μM EIPA, 3.1 ± 0.2 nl/min; recovery, 3.8 ± 0.3 nl/min; NS). Individual results obtained with 7 independent tubules are displayed.
Table 4 .
Effect of 10 μM peritubular EIPA on transepithelial chloride flux in the rat MTALH (n = 6)
Figure 5. Transepithelial ammonia absorption in the MTALH harvested from NHE4+/+ and NHE4–/– littermate mice on a normal diet.
Tubules were perfused and bathed with a standard solution, containing 139 mM Na+ and 4 mM NH4+ (solution C). Transepithelial ammonia fluxes were 15.6 ± 2.2 pmol/min/mm in NHE4+/+ mice and 8.7 ± 1.7 pmol/min/mm in NHE4–/– littermates (P < 0.05) (flow rate: NHE4+/+, 4.7 ± 0.4 nl/min; NHE4–/–, 4.0 ± 0.5 nl/min [NS]). Horizontal lines indicate the mean level of flux, and individual symbols each represent an individual animal.
CMA increases NHE4 mRNA abundance and protein activity.
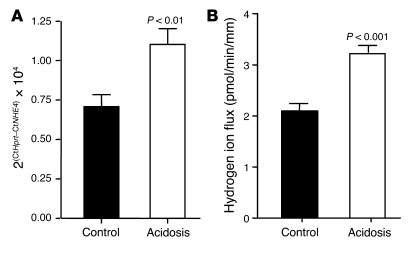
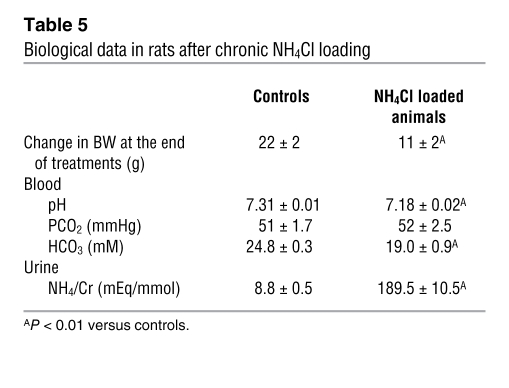
To further support that NHE4 could play a role in the adaptive increase of MTALH cells to absorb ammonia during CMA, we studied NHE4 expression and activity during chronic acid load. We first assessed NHE4 mRNA expression, using real-time quantitative RT-PCR performed for NHE4 and the housekeeping gene Hprt. Induction of CMA with a 7-day HCl treatment in wild-type mice resulted in a 55% increase in renal NHE4 mRNA abundance (P < 0.01) (Figure 6A). We then investigated the effect of metabolic acidosis on NHE4 activity, in in vitro microperfused MTALH obtained from control and acidotic rats. Rats receiving 0.28 M NH4Cl in the drinking water developed a significant metabolic acidosis as compared with controls (Table 5). Basolateral Na+/H+ exchange activity resistant to 1 μM EIPA was measured in in vitro microperfused MTALH obtained from control and acidotic rats as described above. The initial rate of intracellular alkalinization after the peritubular addition of 144 mM Na+ was 0.13 ± 0.01 and 0.17 ± 0.01 pH unit/min in the MTALH of control and acidotic rats, respectively (P < 0.05). The intrinsic buffering capacity (βi) was measured as described in the Methods section. In the range of initial pHi, βi was 48.2 ± 1.1 mM/pH unit and 61.2 ± 0.6 mM/pH unit in the MTALH of control and acidotic rats, respectively (P < 0.001). Cell volume in MTALH was 0.33 ± 0.08 and 0.30 ± 0.04 nl/mm in control and acidotic rats, respectively. Finally, the rate of basolateral proton efflux ascribable to NHE4 was 2.08 ± 0.19 and 3.20 ± 0.20 pmol/min/mm in the MTALH of control and acidotic rats, respectively (P < 0.001) (Figure 6B). Finally, we performed transepithelial ammonia flux measurements in acidotic rats. The effect of 1 μM peritubular EIPA on transepithelial ammonia flux (JAmm) was summarized in Figure 7A. As under control condition, this concentration did not change transepithelial ammonia flux (ΔJAmm = 0.75 ± 0.35 pmol/min/mm) or Vte (ΔVte = 3.28 ± 4.31 mV). The effect of 10 μM EIPA on transepithelial ammonia flux obtained with 4 tubules was summarized in Figure 7B. A 35% inhibition of ammonia flux was observed when 10 μM peritubular EIPA were added: the decrease in ammonia flux was 7.94 ± 1.39 pmol/min/mm (P < 0.01) and was significantly higher than that under basal conditions (2.90 ± 0.90 pmol/min/mm; P < 0.01). No change in Vte was observed.
Figure 6. Effect of CMA on NHE4 activity and NHE4 mRNA expression.
(A) NHE4 and Hprt mRNAs were quantified using a Real-Time RT-PCR experiment (see the Methods section). The average results obtained with 10 kidneys homogenates per group are displayed. (B) Basolateral membrane hydrogen ion flux was calculated from the MTALH of control and acidotic rats, in the presence of 1 μM peritubular EIPA to inhibit NHE1 activity (see the Methods section). The average results obtained with 7 independent tubules for the control group and 8 for the acidosis group are displayed.
Table 5 .
Biological data in rats after chronic NH4Cl loading
Figure 7. Effect of CMA on ammonia transport.
(A) The effect of 1 μM peritubular EIPA on transepithelial ammonia absorption in the rat MTALH. Addition of 1 μM EIPA to the peritubular solution did not change transepithelial ammonia flux, flow rate (flow rate: control, 3.8 ± 0.2 nl/min; 1 μM EIPA, 3.8 ± 0.2 nl/min; NS) or Vte (Vte: control, 5.4 ± 2.2 mV; 1 μM EIPA, 2.1 ± 2.1 mV; NS). The individual results obtained with 3 independent tubules are displayed. (B) The effect of 10 μM peritubular EIPA on transepithelial ammonia absorption in the acidotic rat MTALH. Addition of 10 μM EIPA to the peritubular solution elicited a decrease in transepithelial ammonia flux. Vte and flow rate were not affected by EIPA (Vte: control, 4.5 ± 1.3 mV; 10 μM EIPA, 4.2 ± 1.0 mV; NS; flow rate: control, 3.7 ± 0.1 nl/min; 10 μM EIPA, 3.8 ± 0.3 nl/min; NS). The individual results obtained with 4 independent tubules are displayed.
Discussion
We demonstrated that NHE4 is required for normal TALH ammonia absorption, normal medullary ammonia accumulation, and maximum urinary acidification. Appropriate ammonia excretion in urine is the result of several processes occurring in the proximal tubule, the thick ascending limb of the loop of Henle, and the collecting duct. Defects in urinary ammonia excretion are a hallmark of metabolic acidosis of renal origin. Ammonia absorption in the TALH is thought to be an important step in renal tubular ammonia handling. In fact, this step is the single effect for medullary ammonia accumulation that, eventually, allows ammonia secretion by the collecting duct. However, generalized defects in TALH cell function (e.g., during furosemide administration or Bartter’s syndrome) are usually not characterized by the development of metabolic acidosis, probably because they are associated with polyuria (3). Indeed, rapid flow through the distal tubule and the cortical collecting duct would minimize contact time of the tubular fluid with the tubular epithelium and thus limit back diffusion of NH3 from lumen to blood. Therefore, no model is available to support the assumption that a selective defect in ammonia absorption in the TAL impairs the ability to acidify urine. Here, we provide the first model to our knowledge of a selective decrease in ammonia absorption by the MTALH cells that leads to a decrease in ammonia accumulation in the medullary interstitium and eventually results in hyperchloremic metabolic acidosis.
Adult mice lacking NHE4 spontaneously display a compensated (because of appropriate decrease in PCO2) hyperchloremic metabolic acidosis, together with inadequate (i.e., not increased) urinary net acid excretion, suggesting that, under control conditions, the inability to absorb ammonia sufficiently in the thick ascending limb impairs systemic acid-base status and is responsible for a form of renal distal tubular acidosis. Furthermore, when challenged with an acid load for 1 week, NHE4–/– mice are unable to increase their urinary ammonium and, hence, net acid excretions as much as their NHE4+/+ littermates. Very likely, this is due to their inability to normally absorb ammonia in the TALH and accumulate it in the medullary interstitium. However, at baseline, the magnitude of the decrease in plasma bicarbonate concentration is small, perhaps because the laboratory chow is not enriched in animal proteins. It is conceivable that the decrease in plasma bicarbonate should be larger in humans lacking NHE4 and eating a diet with a higher animal protein content.
One unusual feature is present in mice lacking NHE4. Their urinary pH is spontaneously lower than that of NHE4+/+ mice on a regular chow. A possible explanation for this is that, at baseline, NHE4–/– mice compensate in part for the defect in medullary ammonia accumulation by increasing the diffusion gradient for NH3 across the epithelium of the collecting duct. In fact, at baseline, NHE4–/– mice do not have a lower ammonia excretion than NHE4+/+ mice. However, during an oral acid challenge, NHE4–/– mice were unable to decrease their urinary pH any further and were unable to increase their ammonia excretion as much as the control mice. This could readily be explained by the defect in ammonia storage in the medullary interstitium.
Transcellular ammonia absorption in the MTALH is the main component of total ammonia transport in this segment. However, the basolateral step of this process remains incompletely understood. The basolateral membrane of the MTALH cell is much more permeable to NH3 than the apical membrane (15); therefore, nonionic diffusion of NH3 across the basolateral membrane may participate in the process of active ammonia absorption. The associated proton must then be buffered by a base loader, and NBCn1 has been proposed to play a significant role in this process (8). Alternatively, but not exclusively, ammonia could exit the cell as ammonium, provided a pathway for transport of this ion exists in the basolateral membrane of the MTALH cell. The data reported herein demonstrate the presence of basolateral Na+/H+ exchange activities mediated by 2 distinct Na+/H+ exchangers. A previous study from our laboratory showed that both the NHE1 and NHE4 Na+/H+ exchanger isoforms are expressed in the basolateral membrane of MTALH cells (11) and, using purified basolateral membrane vesicles, that Na+/H+ exchange activity results from the addition of 2 components, distinguished by their sensitivity to EIPA. The first component is very sensitive to EIPA (IC50, 11 nM), whereas the second one is much more resistant (IC50, 2.5 μM), in agreement with the known properties of NHE1 and NHE4, respectively (11, 14). Our data in intact cells are in close agreement with these previous results; as shown in Figure 3, about 50% of NHE1 activity is inhibited by 30 nM peritubular EIPA, and 10 μM peritubular EIPA inhibits about 50% of NHE4 activity. Therefore, our data provide strong evidence that both NHE1 and NHE4 are functional under baseline conditions in intact MTALH cells; NHE1 accounts for roughly 80% and NHE4 for 20% of the total Na+/H+ exchange activity in the rat microperfused MTALH.
Because of its unique sensitivity to pHi, we hypothesized that NHE4 could be specifically involved in ammonia absorption. In fact, NHE4 has a much lower sensitivity than NHE1 to intracellular H+ (11). In basolateral membrane vesicles, NHE4 appears to be almost inactive at intravesicular pH of 7.0 or above and is progressively activated when intravesicular pH decreases. If these data are extrapolated to intact cells, it could be assumed that NHE4 is inactive when the MTALH cell is not actively absorbing ammonium (16). Conversely, active ammonium absorption elicits a decrease in pHi that would be expected to activate NHE4. Accordingly, 1 μM EIPA does not affect ammonia absorption, which argues against a significant role for NHE1 in this process. In contrast, inhibition of ammonia transport by either 10 μM EIPA or genetic disruption of NHE4 provides strong evidence that NHE4 is involved in transcellular ammonia transport. Importantly, this EIPA concentration does not alter transepithelial chloride absorption (which could be the case, in transepithelial flux measurement experiments that last several hours, with higher EIPA concentrations), indicating that EIPA does not affect ammonia transport through an indirect effect on apical NKCC2 activity. This also suggests that, in MTALH cells, ammonium absorption can be regulated independently of NaCl absorption.
Further, our data provide evidence that NHE4 is physiologically involved in the adaptive increase in ammonia absorption during metabolic acidosis. Under long-term metabolic acidosis, Good et al. demonstrated, using in vitro microperfusion, that net ammonia absorption by the rat MTALH increases by about 40% (2). Under the same conditions and using the same experimental approach, we observed a 55% increase in NHE4 mRNA expression, a 50% increase in NHE4 activity, and a significant increase in the EIPA-sensitive part of transepithelial ammonia absorption. This indicates that a large part of the acidosis-elicited increase in ammonia transport can be accounted for by the increase in NHE4 activity. Using the same approach, Odgaard et al. did not observe any increase in overall NHE activity or any change in NHE1 protein expression in the MTALH dissected from acidotic rats (8). The absence of change in NHE activity can be explained by the fact that NHE4 accounts for only a minor part of total Na+/H+ exchange in the basolateral membrane; therefore, a 50% increase in NHE4 activity can be easily missed. It should be noted that the lack of change in NHE1 activity in acidotic rats is in agreement with the fact that NHE1 expression does not increase in the MTALH under this condition (17). Kwon et al. and Odggard et al. focused on NBCn1 protein and found that NBCn1 expression and activity are also increased by CMA (8, 18). Consistent with the hypothesis that NBCn1 could be responsible for the part of active ammonia efflux that is not accounted for by NHE4, metabolic acidosis induced a significant increase in NBCn1-dependent base flux.
Finally, our data suggest that NHE4 might also play a role in extrarenal acid production. At baseline, both urinary ammonium and organic anions excretions are slightly, but significantly, higher in NHE4–/– mice than in their NHE4+/+ littermates (Table 2). This is consistent with a slight increase in extrarenal production of organic acid in NHE4–/– mice. NHE4 is expressed in the gastric parietal cells, in which its disruption leads to achlorhydria (19), and in muscles cells, in which its role remains unknown. Whether the lack of expression in one of these organs is able to increase extrarenal acid production is presently unknown. However, an increase in organic acid production is expected to induce a high anion gap metabolic acidosis and not a hyperchloremic acidosis, as observed in the NHE4–/– mice. It is unlikely that a defect in gastric hydrochloric acid secretion is responsible for the hyperchloremic metabolic acidosis in NHE4–/– mice. First, gastric acid secretion by the stomach is not considered to be a mechanism regulating acid-base balance. Second, an increase in extrarenal retention of acid should, if anything, induce an increase in urinary net acid excretion. Third, since the gastric parietal cells produce hydrogen ions from the dissociation of carbonic acid, a decreased HCl production and secretion by the gastric parietal cells should be associated with a similarly decreased production of bicarbonate, with no net change in acid and base production. Finally, extrarenal mechanisms cannot explain the defect in renal ammonia and acid excretions observed in NHE4–/– mice.
By highlighting the role of NHE4 in renal ammonia handling and urinary acidification, we believe our results bring new insight into the regulation of systemic acid-base status and the pathophysiology of distal renal tubular acidosis. Hence, NHE4 could be a good candidate to investigate adult renal tubular acidosis in humans.
Methods
Animals
Pathogen-free male Sprague-Dawley rats (Iffa-Credo), weighing 60–75 g and mice (5 to 6 months old) were used for this study. Except in CMA experiments, all animals had free access to deionized water and were fed ad libitum with standard laboratory chow (M20; Dietex).
Oral acid load experiments in rats
In CMA experiments, control and treated groups were handled in parallel over a 5- or 6-day period. Rats were provided with a standard rat chow and either distilled water alone or distilled water containing 0.28 M NH4Cl (NH4Cl-loaded). Experiments were carried out using rats housed in metabolic cages, after a 5-day acclimatization period. Urine that was spontaneously voided during each 24-hour period was collected, with light mineral oil in the urine collector, to determine daily urinary ammonium and creatinine excretions. At the end of the experimental period (5 or 6 days), blood was collected by aortic exsanguination from animals under anesthesia. Blood pH, PCO2, and HCO3– concentrations were determined using a gas analyzer (Compact1, AVL; Roche Diagnostics). Urinary creatinine concentration was measured using a modified kinetic Jaffé colorimetric method (Konelab 20; Thermo Scientific). Urinary ammonium concentration was determined by titration (20, 21).
In vivo experiments in NHE4 knockout and NHE4+/+ littermate mice
All experiments were performed using age- and sex-matched NHE4+/+ and NHE4 knockout (NHE4–/–) littermate mice (5 to 6 months old), housed in metabolic cages (Techniplast) (19). Mice were given deionized water ad libitum and fed with standard powder laboratory chow (M20; Dietex). Mice were first allowed to adapt to these cages for 7 days. Then, two 24-hour urine samples were collected, with light mineral oil in the urine collector, to determine daily urinary electrolyte excretion. The same procedure was used for acid-loading experiments, except that mice were given 0.2 M HCl in agar food. Urine collection was performed on the first and second day and then on the sixth and seventh day after initiation of the acid loading. Blood pH and PCO2 concentrations were measured with a pH/blood-gas analyzer (ABL77; Radiometer). Urinary Na+ and K+ concentrations were measured using flame photometry (IL943; Instruments Laboratory), and creatinine concentrations were measured using a modified kinetic Jaffé colorimetric method (Konelab 20). Urinary pH and bicarbonate concentrations were measured with a pH/blood-gas analyzer (ABL725; Radiometer). Urinary NH4+, titratable acid and organic anions (20, 21, 22) were measured by titration with a DL55 Titrator (Mettler Toledo).
All animals were treated in compliance with French and European Union animal care guidelines. All animal protocols were conducted in accordance with the European and French Research Council Guide for the Care and Use of Laboratory Animals and were approved by the review board of the Centre de Recherche des Cordeliers.
Measurement of renal ammonia content
The renal tissue ammonia content was measured by an enzymatic technique (Ammonia Assay Kit; Sigma-Aldrich), as previously described (3). Mice were anesthetized with sodium pentobarbital (2.5 mg/50 g), and the kidneys were removed and immediately frozen in liquid nitrogen. They were then sliced while frozen to yield a column of tissue, which extended from the cortex to the tip of the papilla. Sections were cut along the corticomedullary axis to yield 3 slices: cortex, outer medulla, and inner medulla. Two kidneys were pooled for each sample. Tissue slices were then homogenized in 300 μl ice cold 7% trichloroacetic acid, and the solution was centrifuged. The supernatant was drawn off, and the pH of a 250 μl sample was adjusted to near neutral by the addition of 12 μl of 10 mM Na2HPO4 in 9 N NaOH. A 200-μl sample of buffered supernatant was then analyzed for ammonium. The pellet was resuspended in 1 N NaOH, shaken overnight, and analyzed for total protein by Bio-Rad protein assay.
RNA extraction and reverse transcription
Snap-frozen kidneys from C57BL6 mice (10 kidneys for each control and 10 for the acidotic condition) were homogenized in RLT-Buffer (Qiagen), supplemented with β-mercaptoethanol to a final concentration of 1%. Total RNA was extracted from 200-μl aliquots of each homogenized sample using the RNeasy Mini Kit (Qiagen), according to the manufacturer’s instructions. Quality and concentration of the isolated RNA preparations were analyzed by the ND-1000 spectrophotometer (NanoDrop Technologies). Total RNA samples were stored at –80°C. Each RNA sample was diluted to 100 ng/μl, and 3 μl was used as a template for reverse transcription using the TaqMan Reverse Transcription Kit (Applied Biosystems). For reverse transcription, 300 ng of RNA template were diluted in a 40-μl reaction mix that contained (final concentrations) RT buffer (1×), MgCl2 (5.5 mM), random hexamers (2.5 μM), RNase inhibitor (0.4 U/μl), the multiscribe reverse transcriptase enzyme (1.25 U/μl), dNTP mix (500 μM each), and RNase-free water.
Real-time quantitative PCR
Quantitative real-time PCR was performed on the ABI PRISM 7700 Sequence Detection System (Applied Biosystems). Primers for all genes of interest were designed using Primer3. Primers were chosen to result in amplicons no longer than 150 bp, spanning intron-exon boundaries to exclude genomic DNA contamination. The specificity of all primers was first tested on mRNA derived from kidney and always resulted in a single product of the expected size (data not shown). Probes were labeled with the reporter dye FAM at the 5′ end and the quencher dye TAMRA at the 3′ end (Microsynth). Real-time PCR reactions were performed using TaqMan Universal PCR Master Mix (Applied Biosystems). Briefly, 3 μl cDNA, 1 μl of each primer (25 μM), 0.5 μl labeled probe (5 μM), 6.5 μl RNAse-free water, and 12.5 μl TaqMan Universal PCR Master Mix were combined to reach 25 μl of final reaction volume. Reaction conditions were denaturation at 95°C for 10 minutes, followed by 40 cycles of denaturation at 95°C for 15 seconds and annealing/elongation at 60°C for 60 seconds with auto ramp time. All reactions were run in triplicate. For analyzing the data, the threshold was set to 0.06, as this value had been determined to be in the linear range of the amplification curves for all mRNAs in all experimental runs. The expression of NHE4 gene (accession number BC12054, forward primer 5′-GCGTTTTTGCTTCCTCTGTC-3′ [1601–1621 bp], reverse primer 5′-TGCCCACACACATCTTCAAT-3′ [1821–1841 bp], probe 5′-AAACTGTTTGTTACGGCAACTTTAG-3′ [1637–1662 bp]) was calculated in relation to hypoxanthine guanine phosphoribosyl transferase (Hprt, accession number NM_013556, forward primer 5′-TTATCAGACTGAAGAGCTACTGTAAGATC-3′ [442–471 bp], reverse primer 5′-TTACCAGTGTCAATTATATCTTCAACAATC-3′ [539–568 bp], probe 5′-TGAGAGATCATCTCCACCAATAACTTTTATGTCCC-3′ [481–515 bp]). Relative expression ratios were calculated as r = 2Ct(Hprt) – Ct(test gene), where Ct represents the cycle number at the threshold 0.06.
In vitro microperfusion experiments
Tubule isolation.
Rats and mice were anesthetized with 50 mg/kg pentobarbital i.p., 10 minutes after the injection of 2 mg (or 1 mg for mice) furosemide (i.p.), in order to limit oxygen consumption of the MTALH during tubule dissection. Both kidneys were cooled in situ with control bath solution for 1 minute and then removed and cut into thin coronal slices for tubule dissection. These maneuvers have been shown to improve the viability of renal tubules in vitro (23). The MTALH were dissected from the inner stripe of the outer medulla at 4°C in the control solution of the respective experiment. The isolated tubule was transferred to the bath chamber on the stage of an inverted microscope (Axiovert 100; Carl Zeiss), mounted on concentric pipettes, and perfused in vitro. During pHi measurement experiments, the average tubule length exposed to bath fluid was limited to 300–350 μm, in order to prevent motion of the tubule.
pHi measurement.
MTALH cells were loaded with the fluorescent probe 2′,7′-bis(2-carboxyl)-5-(and-6)-carboxyfluorescein (BCECF; Molecular Probes) and prepared as a 10 mM stock in DMSO, by exposing the cells for approximately 20 minutes at room temperature to the control bath solution containing 5 μM BCECF. Loading was continued until the fluorescence intensity at 440-nm excitation wavelength was at least 1 order of magnitude higher than background fluorescence. The loading solution was then washed out by initiation of bath flow, and the tubule was equilibrated with dye-free control bath solution for 5–10 minutes. Bath solution was delivered at a rate of 20 ml/min and warmed to 37°C ± 0.5°C by a water jacket immediately upstream to the chamber. The perfusion rate was adjusted, using hydrostatic pressure, to approximately 20 nl/min to prevent axial changes in the composition of luminal fluid.
Intracellular dye was excited alternatively at 490 and 440 nm, with a 100-watt halogen lamp and a computer-controlled chopper assembly. Emitted light was collected through a dichroic mirror, passed through a 530-nm filter, and focussed onto a CCD camera (ICCD 2525F; Videoscope International) connected to a computer. The measured light intensities were digitized with 8-bit precision (256-gray level scale) for further analysis. For each tubule, a region of interest was drawn, and the mean gray level for each excitation wavelength was calculated with the Starwise Fluo software (Imstar). Background fluorescence was subtracted from fluorescence intensity at each excitation wavelength to obtain intensities of intracellular fluorescence. The 490-nm to 440-nm ratio was used as an indicator of pHi.
Intracellular dye was calibrated at the end of each experiment using the high [K+]-nigericin technique. Tubules were perfused and bathed with a HEPES-buffered, 95-mM K+ solution containing 10 μM of the K+/H+ exchanger nigericin. Four different calibration solutions, titrated to 6.5, 6.9, 7.3, or 7.5, were used.
Determination of βi.
The βi of MTALH cells was determined, as previously reported (7), using a method similar to that used by Watts and Good (24), except that a weak acid was used to change pHi instead of a weak base and that barium was omitted from the solutions. To exclude CO2/HCO3– as a buffering component and block Na+-dependent pHi regulatory mechanisms, Na+-free, HEPES-buffered solutions containing 1 mM amiloride were used in perfusate and bath. Addition of 20 mM acetate to the bath induced a decrease in pHi. The pKa of acetic acid (4.74 pH units) was used to calculate the intracellular acetate concentration when cell acidification plateaued. βi was calculated as the ratio of the change in intracellular acetate concentration to the change in pHi.
Calculation of proton flux values.
Proton flux values (JH, expressed in pmol/min/mm) were calculated using the following equation: JH = dpHi/dt × βi × V, where dpHi/dt is the initial rate of change in pHi (in pH unit/min), βi is the intrinsic buffering capacity (in mM/pH unit), and V is the cell volume per 1 mm of tubule length (in nl/mm).
Initial rates of pHi change (dpHi/dt) were determined by a computer-assisted fitting of the pHi versus time data to a linear regression line over the first 15–30 seconds. V was calculated by determining the volume of the tubule [(radius of tubule)2 × p × length] and subtracting the volume of the lumen [(radius of lumen)2 × p × length]. A positive JH value indicates a net proton efflux.
Measurement of transepithelial ammonia flux.
The tubules were equilibrated for 20–30 minutes at 37°C in the initial perfusion and bath solutions, and the luminal flow was adjusted to 2.5–4.5 nl/min. Two to three periods were successively performed on each tubule: initial, experimental, and recovery. Four samples of tubular fluid were collected during each period. The collection time (t) for each sample was recorded, and the sample volume (V) was measured using volumetric pipettes, in order to calculate the perfusion rate (V = V/t). Tubule length (L) was measured using the optical scale of the microscope. Ammonia (NH4+ + NH3) concentration was measured in 10- to 12-nl samples of perfused and collected fluid, using an ammonia diagnostic kit (Sigma-Aldrich) and the flow-through microfluorometer Nanoflo apparatus (World Precision Instruments) (25). The reagent was reconstituted in HPLC-grade water and diluted 1:6 (v/v) in 50 mM sodium phosphate buffer, pH 8. Glutamate l-dehydrogenase (12 units/ml) was added to the reagent before use.
Calibration solutions (1, 2, and 4 mM) were made using ammonium sulfate freshly prepared in HPLC-grade water. Finally, transepithelial ammonia flux was calculated using the following equation: JAmm = ([Amm]i – [Amm]o) × V/L, where [Amm]i is the concentration of ammonia in the perfusate, [Amm]o is the concentration of ammonia in the collected fluid, V is the collection rate (in nl/min), and L is the tubule length (in mm). An average net transepithelial ammonia flux was calculated for each period in a given tubule.
Measurement of transepithelial chloride absorption.
Tubule perfusion and sample collections were performed as described above. Cl– was titrated by microcoulometry (26), as previously described (27). Finally, transepithelial chloride absorption (JCl–) was calculated using the following equation: JCl– = ([Cl–]i – [Cl–]o) × V/L, where [Cl–]i is the concentration of Cl– in the perfusate, [Cl–]o is the concentration of Cl– in the collected fluid, V is the collection rate, and L is the tubule length. An averaged net transepithelial chloride flux was calculated for each period in a given tubule.
Measurement of transepithelial voltage.
Transepithelial voltage (Vte) was measured with a DP-301 differential electrometer (Warner Instrument Corporation), using a Ag/AgCl electrode connected to the perfusion pipette via a 0.15 M NaCl agar bridge; a 0.15 M NaCl agar bridge also connected the peritubular bath to an Ag/AgCl electrode. Transepithelial voltage was measured during each period at the tip of the perfusion pipette.
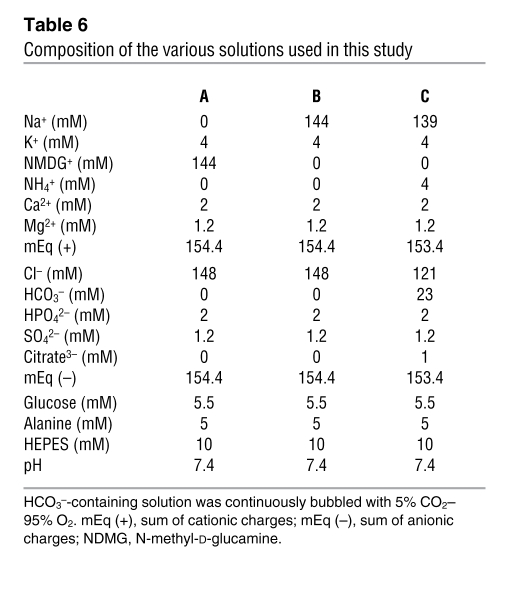
Solutions composition.
The composition of solutions used is summarized in Table 6. The solutions containing bicarbonate were continuously gassed with 95% O2–5% CO2 at 37°C, and the CO2/HCO3–-free solutions were continuously gassed with 100% O2 passed through a 3N KOH CO2 trap. Before each experiment, osmolality and pH were measured in bulk solutions. Alanine and HEPES were obtained from Research Organics; all other chemicals were from Sigma-Aldrich.
Table 6 .
Composition of the various solutions used in this study
Statistics
Values are reported as mean ± SEM. Statistical significance was assessed by ANOVA or paired or unpaired Student’s t-test, as appropriate. P values of less than 0.05 were considered significant.
Acknowledgments
This work was supported by INSERM and by the renal phenotyping facility at the Centre de Recherche des Cordeliers. The authors wish to thank S. Frische for fruitful discussions.
Footnotes
Conflict of interest: The authors have declared that no conflict of interest exists.
Citation for this article: J Clin Invest. 2010;120(6):1895–1904. doi:10.1172/JCI36581.
References
- 1.Good DW. Ammonium transport by the thick ascending limb of Henle’s loop. Annu Rev Physiol. 1994;56:623–647. doi: 10.1146/annurev.ph.56.030194.003203. [DOI] [PubMed] [Google Scholar]
- 2.Good DW. Adaptation of HCO3– and NH4+ transport in rat MTAL: effects of chronic metabolic acidosis and Na+ intake. Am J Physiol. 1990;258(5 pt 2):F1345–F1353. doi: 10.1152/ajprenal.1990.258.5.F1345. [DOI] [PubMed] [Google Scholar]
- 3.Packer RK, Desai SS, Hornbuckle K, Knepper MA. Role of countercurrent multiplication in renal ammonium handling: regulation of medullary ammonium accumulation. J Am Soc Nephrol. 1991;2(1):77–83. doi: 10.1681/ASN.V2177. [DOI] [PubMed] [Google Scholar]
- 4.Good DW, Knepper MA, Burg MB. Ammonia and bicarbonate transport by thick ascending limb of rat kidney. Am J Physiol. 1984;247(1 pt 2):F35–F44. doi: 10.1152/ajprenal.1984.247.1.F35. [DOI] [PubMed] [Google Scholar]
- 5.Kinne R, Kinne Saffran E, Schutz H, Scholermann B. Ammonium transport in medullary thick ascending limb of rabbit kidney: involvement of the Na+,K+,Cl(-)-cotransporter. J Membr Biol. 1986;94(3):279–284. doi: 10.1007/BF01869723. [DOI] [PubMed] [Google Scholar]
- 6.Vorum H, et al. Immunolocalization of electroneutral Na-HCO(3)(-) cotransporter in rat kidney. Am J Physiol Renal Physiol. 2000;279(5):F901–F909. doi: 10.1152/ajprenal.2000.279.5.F901. [DOI] [PubMed] [Google Scholar]
- 7.Bourgeois S, Masse S, Paillard M, Houillier P. Basolateral membrane Cl(-)-, Na(+)-, and K(+)-coupled base transport mechanisms in rat MTALH. Am J Physiol Renal Physiol. 2002;282(4):F655–F668. doi: 10.1152/ajprenal.00220.2000. [DOI] [PubMed] [Google Scholar]
- 8.Odgaard E, et al. Basolateral Na+-dependent HCO3- transporter NBCn1-mediated HCO3- influx in rat medullary thick ascending limb. J Physiol. 2004;555(pt 1):205–218. doi: 10.1113/jphysiol.2003.046474. [DOI] [PMC free article] [PubMed] [Google Scholar]
- 9.Jakobsen JK, et al. Functional up-regulation of basolateral Na+-dependent HCO3- transporter NBCn1 in medullary thick ascending limb of K+-depleted rats. Pflugers Arch. 2004;448(6):571–578. doi: 10.1007/s00424-004-1303-4. [DOI] [PubMed] [Google Scholar]
- 10.Blanchard A, Eladari D, Leviel F, Tsimaratos M, Paillard M, Podevin R. NH4+ as a substrate for apical and basolateral Na(+)-H+ exchangers of thick ascending limbs of rat kidney: evidence from isolated membranes. J Physiol. 1998;506(pt 3):689–698. doi: 10.1111/j.1469-7793.1998.689bv.x. [DOI] [PMC free article] [PubMed] [Google Scholar]
- 11.Chambrey R, et al. Localization and functional characterization of Na+/H+ exchanger isoform NHE4 in rat thick ascending limbs. Am J Physiol Renal Physiol. 2001;281(4):F707–F717. doi: 10.1152/ajprenal.2001.281.4.F707. [DOI] [PubMed] [Google Scholar]
- 12.Bianchini L, et al. Responsiveness of mutants of NHE1 isoform of Na+/H+ antiport to osmotic stress. Am J Physiol. 1995;269(4 pt 1):C998–C1007. doi: 10.1152/ajpcell.1995.269.4.C998. [DOI] [PubMed] [Google Scholar]
- 13.Biemesderfer D, Reilly RF, Exner M, Igarashi P, Aronson PS. Immunocytochemical characterization of Na(+)-H+ exchanger isoform NHE-1 in rabbit kidney. Am J Physiol. 1992;263(5 pt 2):F833–F840. doi: 10.1152/ajprenal.1992.263.5.F833. [DOI] [PubMed] [Google Scholar]
- 14.Orlowski J. Heterologous expression and functional properties of amiloride high affinity (NHE-1) and low affinity (NHE-3) isoforms of the rat Na/H exchanger. J Biol Chem. 1993;268(22):16369–16377. [PubMed] [Google Scholar]
- 15.Kikeri D, Sun A, Zeidel ML, Hebert SC. Cell membranes impermeable to NH3. Nature. 1989;339(6224):478–480. doi: 10.1038/339478a0. [DOI] [PubMed] [Google Scholar]
- 16.Watts BA, 3rd, Good DW. Effects of ammonium on intracellular pH in rat medullary thick ascending limb: mechanisms of apical membrane NH4+ transport. J Gen Physiol. 1994;103(5):917–936. doi: 10.1085/jgp.103.5.917. [DOI] [PMC free article] [PubMed] [Google Scholar]
- 17.Laghmani K, Richer C, Borensztein P, Paillard M, Froissart M. Expression of rat thick limb Na/H exchangers in potassium depletion and chronic metabolic acidosis. Kidney Int. 2001;60(4):1386–1396. doi: 10.1046/j.1523-1755.2001.00942.x. [DOI] [PubMed] [Google Scholar]
- 18.Kwon TH, et al. Chronic metabolic acidosis upregulates rat kidney Na-HCO cotransporters NBCn1 and NBC3 but not NBC1. Am J Physiol Renal Physiol. 2002;282(2):F341–F351. doi: 10.1152/ajprenal.00104.2001. [DOI] [PubMed] [Google Scholar]
- 19.Gawenis LR, et al. Impaired gastric acid secretion in mice with a targeted disruption of the NHE4 Na+/H+ exchanger. J Biol Chem. 2005;280(13):12781–12789. doi: 10.1074/jbc.M414118200. [DOI] [PubMed] [Google Scholar]
- 20.Jorgensen K. Titrimetric determination of the net excretion of acid/base in urine. Scand J Clin Lab Invest. 1957;9(3):287–291. doi: 10.3109/00365515709079972. [DOI] [PubMed] [Google Scholar]
- 21.Nutbourne DM. The effect of dilution on the titratable acid in urine and acidified phosphate buffer solutions, and the correction for this effect in the determination of the rate of elimination of hydrogen ions from the body by the renal tubules. Clin Sci. 1961;20:263–278. [PubMed] [Google Scholar]
- 22.Van Slyke DD, Palmer WW. Studies on acidosis. XVI. The titration of organic acids in urine. J Biol Chem. 1920;41:567–585. [Google Scholar]
- 23.Garvin JL, Burg MB, Knepper MA. Active NH4+ absorption by the thick ascending limb. Am J Physiol. 1988;255(1 pt 2):F57–F65. doi: 10.1152/ajprenal.1988.255.1.F57. [DOI] [PubMed] [Google Scholar]
- 24.Watts BA, III, Good DW. Apical membrane Na+/H+ exchange in rat medullary thick ascending limb. pH-dependence and inhibition by hyperosmolality. J Biol Chem. 1994;269(32):20250–20255. [PubMed] [Google Scholar]
- 25.Zhelyaskov VR, Liu S, Broderick MP. Analysis of nanoliter samples of electrolytes using a flow-through microfluorometer. Kidney Int. 2000;57(4):1764–1769. doi: 10.1046/j.1523-1755.2000.00022.x. [DOI] [PubMed] [Google Scholar]
- 26.Ramsay JA, Brown HJ, Croghan PC. Electrometric titration of chloride in small volumes. J Exp Biol. 1955;32:822–829. [Google Scholar]
- 27.Lerolle N, Bourgeois S, Leviel F, Lebrun G, Paillard M, Houillier P. Angiotensin II inhibits NaCl absorption in the rat medullary thick ascending limb. Am J Physiol Renal Physiol. 2004;287(3):F404–F410. doi: 10.1152/ajprenal.00265.2003. [DOI] [PubMed] [Google Scholar]


