Abstract
Mice engineered to express c-Myc in B cells (Eμ-myc mice) develop lethal lymphomas in which the gene encoding the p53 tumor suppressor is frequently mutated. Whether the p53 homolog p73 also functions as a tumor suppressor in vivo remains controversial. Here we have shown that p73 loss does not substantially affect disease onset and mortality in Eμ-myc mice. However, it does alter the phenotype of the disease. Specifically, p73 loss decreased nodal disease and increased widespread extranodal dissemination. We further found that p53 acted as the dominant tumor suppressor during the onset of Eμ-myc–driven B cell lymphomagenesis, while p73 modulated tumor dissemination and extranodal growth. Immunophenotyping and expression profiling suggested that p73 loss allowed increased maturation of malignant B cells and deregulated genes involved in lymphocyte homing and dissemination of human lymphomas. Consistent with this, p73 expression was frequently downregulated in a large cohort of human mature aggressive B cell lymphomas, and both the incidence and degree of p73 downregulation in these tumors correlated with their extranodal dissemination status. These data indicate that p73 is a modifier of Myc-driven lymphomas in mice, favoring tumor dissemination, and suggest that p73 could be a biomarker for human B cell lymphoma dissemination, a notion that can now be tested in clinicopathologic correlation studies.
Introduction
The p73 gene was identified through its structural homology with the p53 tumor suppressor (1, 2). Initial overexpression studies demonstrated that p73 can activate many p53-responsive genes and partly substitute for p53 in triggering cell-cycle arrest or apoptosis (3–5). However, p73 and p53 are not functionally equivalent. Recent analyses revealed that p73 has its own set of transcriptional target genes (6, 7). Moreover, the TP73 gene locus is complex and encodes 2 classes of isoforms with opposing activities. p73 variants that lack the N-terminal transactivation (TA) domain function to interfere with the activity of the full-length counterparts of p73, p53, and p63 (8, 9). A net upregulation of the dominant negative ΔNp73 isoforms (i.e., a high ΔN/TAp73 ratio) frequently occurs in carcinomas and is a poor prognostic marker in some solid tumors (9–11).
Although p53 and p73 share structural similarities, their differences in vivo are striking. Thus, p53-null mice are developmentally normal but show a high predisposition to spontaneous tumors, mainly T lymphomas. In contrast, in vivo evidence for a tumor-suppressor role of p73 is still scarce and contradictory. p73-knockout mice (which lack all p73 isoforms) are born with developmental neurological and immunological defects associated with early lethality, but show no tumor predisposition (12). Flores et al. (13) reported spontaneous development of mainly microscopic tumors in p73+/– and p73–/– mice, particularly when combined with p53 heterozygosity, while p73 did not contribute to p53 suppressor activity during irradiation-induced T cell lymphomagenesis (14). On the other hand, aging mice specifically lacking TAp73 develop spontaneous malignancies, mainly lung adenocarcinomas and lymphomas (15).
Unlike p53, the p73 gene is rarely mutated in human cancers (10). In fact, there is currently no compelling genetic evidence that inactivation of p73 is required for malignant transformation or progression in human tumors. The single notable exception comes from persistent reports of frequent loss of p73 expression in hematological malignancies. Specifically, inactivation of the p73 gene by epigenetic silencing or deletion is a common finding in malignant lymphoproliferative disorders. p73 is inactivated in about 35% of acute lymphoblastic leukemia (ALL) and about one-third of non-Hodgkin lymphomas (NHLs) (16–19). Of note, 95% of human lymphomas are B cell in origin (20). Also, in a study of natural killer cell lymphomas, the p73 gene was methylated in 94% of cases (21). Assessment of p73 methylation may provide important prognostic information, as shown in patients with ALL (19). In sum, these data suggest that p73 might play a pathogenetic role in human lymphomas.
To experimentally assess the role of p73 in B cell lymphomagenesis, we investigated Eμ-myc transgenic mice, the well-characterized model of human NHL. These mice overexpress c-Myc in B cell progenitors under the control of the immunoglobulin heavy chain enhancer and develop pre–B cell and/or B cell lymphomas (22, 23). The latent period prior to onset of disease reflects the ability of c-Myc to induce p53-dependent and p53-independent growth arrest and apoptotic checkpoints that protect animals against tumor formation. These checkpoints become disabled when overtly malignant cells emerge (24). Given the fact that a significant fraction of human B lymphomas exhibit deregulated c-Myc and p73 and that c-Myc activates proapoptotic functions of p73 in vitro (25), Eμ-myc mice provide a relevant in vivo model to assess the impact of p73 on tumor behavior.
Results
p73-deficient Eμ-myc mice are viable but show developmental defects.
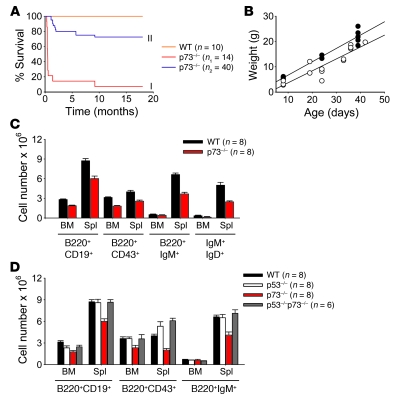
It was reported that p73–/– mice survive to birth, but most of them die within 2 months due to brain defects, chronic infections, and inflammation (12). Indeed, in mixed litter colonies generated from interbreeding heterozygous animals, survival of p73–/– mice decreased sharply to less than 20%, as previously described (Figure 1A) (12). However, we discovered that most p73–/– animals die at this young age mainly because of malnutrition caused by their inability to compete with WT and p73+/– littermates. Identifying such p73–/– pups right after birth and moving them to lactating foster mothers essentially normalized their weight gain and rescued overall long-term longevity to nearly 80% (Figure 1, A and B). As reported (12), rescued p73–/– mice developed variably penetrant congenital hydrocephalus, which killed 25% of them within 9 months due to intraventricular hemorrhage (Figure 1A). Infections, although present, were mild and did not cause death. Of note, none of the long-term p73–/– survivors developed a malignancy. Thus far, we produced more than 40 p73–/– Eμ-myc mice, of which 20% again displayed severe brain defects causing their premature death. Most of the remaining p73–/– Eμ-myc mice exhibited nonfatal brain defects and developed B cell lymphomas (see below).
Figure 1. Mice deficient in p73 have impaired B cell development.
(A) Overall survival of WT and p73–/– mice before (curve I) and after (curve II) removal of intralitter competition from WT and p73+/– siblings. The number of animals per genotype is indicated. Curve II: while a minority (25%) of p73–/– mice die prematurely due to severe hydrocephalus with intraventricular hemorrhage, the remainder survive long term and remain tumor free. (B) Postpartum body weight gain of WT (black circles) and rescued p73–/– mice (white circles) shown in Figure 1A, curve II. (C) Cells extracted from BM and spleens (Spl) of 4-week-old nontransgenic WT and p73–/– mice were costained with antibodies to B220, CD19, CD43, IgM, and IgD and analyzed by FACS. Absolute numbers of total B cells (B220+CD19+), pro–B cells (B220+CD43+), immature/mature B cells (B220+IgM+), and recirculating B cells (IgM+IgD+) are graphed. Error bars represent SEM. (D) Cells extracted from BM and spleens of 4-week-old mice of the indicated genotypes were stained and analyzed as in C. Error bars represent SEM.
To determine whether p73 loss affects normal B cell development, BM and peripheral lymphoid organs (spleen, lymph nodes) of nontransgenic p73+/+, p73+/–, and p73–/– mice were characterized by flow cytometry. At birth and through 8 weeks of age, lymphoid organs from p73+/– and p73–/– mice displayed no morphological defects and showed an overall normal proportional distribution of B cell subsets, including pro–B cells (B220+CD43+), immature/mature B cells (B220+IgM+), and recirculating B cells (IgM+IgD+) (Figure 1C and data not shown). However, the absolute cell number of each B cell subset in p73–/– mice was decreased by 30%–40% compared with WT controls (Figure 1C). This B cell hypocellularity in p73–/– mice is mediated by p53, since codeletion of p53 completely rescued B cellularity in p73–/– mice. Accordingly, p53–/–p73–/– (DKO) mice showed normal numbers of all major B cell subsets, most notably within the immature BM and mature spleen B cell compartments (Figure 1D). Moreover, B cells from spleens of p73–/– mice showed increased Puma levels compared with WT mice (Supplemental Figure 1C; supplemental material available online with this article; doi: 10.1172/JCI40331DS1). Consistent with this result, we previously showed that inactivation of p73 in primary mouse embryo fibroblasts (MEFs) impairs proliferation due to activation of p53 (26).
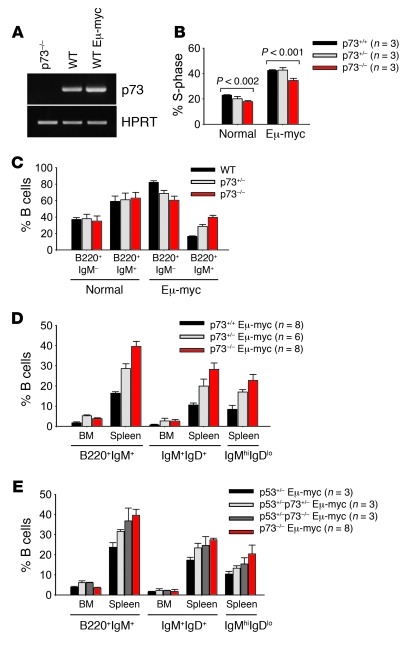
We previously showed that p73 can be a transcriptional target of ectopic Myc in cultured cells (25). In vivo levels of p73 transcripts in premalignant Eμ-myc B cells were mildly higher than those of nontransgenic WT B cells (Figure 2A). This is consistent with the observation that Myc is increased 2- to 4-fold in Eμ-myc B cells (data not shown) and that well-studied transcriptional targets of Myc are slightly increased in B cells of these mice. Overall, p73 might be a direct target of Myc regulation in this cell type. The central mechanism of Myc-induced tumorigenesis is an aberrant expansion of immature B cell population in BM, which accounts for most of the malignant growth of the transformed B cells (22, 23, 27). The absolute number of mature B cells is altered less significantly due to increase in splenic cellularity (Figure 1C). Importantly, forced Myc expression increased the percentage of total B cells in BM of premalignant Eμ-myc mice, independent of the presence or absence of p73 (Supplemental Figure 1A). Furthermore, this B cell hypercellularity was not caused by higher proliferation (Figure 2B) or lower apoptosis (Supplemental Figure 1B), which in fact showed the opposite result in p73-deficient cells, consistent with p53 activation in the absence of p73. The levels of p53 target genes p21, Bax, and Noxa were accordingly increased (Supplemental Figure 1C). However, in contrast to nontransgenic mice, in which p73 plays no apparent role in the maturation of B cells (Figure 2C), the absence of p73 in Myc transgenics shifted the ratio toward maturation. This is indicated by an IgM-negative to IgM-positive cell ratio of 5 in WT Eμ-myc mice compared with a ratio of only 1.5 in p73–/– Eμ-myc mice, revealing a 3.3-fold increase in the proportion of more mature IgM-positive B cell populations (Figure 2, C and D). Heterozygous p73+/– Eμ-myc mice showed an intermediate phenotype. Most of the excess cells in spleens of p73–/– Eμ-myc mice were B220+IgM+, IgMhiIgDlo, and IgM+IgD+ lymphocytes comprising T1 transitional, marginal zone, and memory B cell subsets (Figure 2D).
Figure 2. In the context of Myc, the absence of p73 allows increased maturation of premalignant B cells.
(A) Semiquantitative RT-PCR analysis of p73 mRNA expression in sorted B220+CD19+ B cells isolated from spleens of p73–/–, nontransgenic WT and 4 week-old premalignant Eμ-myc mice. HPRT, control for equal cDNA input. (B) Proportion of cells in S-phase from total BM of 4-week-old nontransgenic (normal) and premalignant Eμ-myc mice of the indicated genotypes. Error bars represent SEM. (C) Cells isolated from spleens of 4-week-old nontransgenic (normal, n = 8 per genotype) and premalignant Eμ-myc mice (n = 8 per genotype) were stained with antibodies to B220 and IgM and analyzed by FACS. The percentage of B cells is indicated. Error bars represent SEM. (D) Cells isolated from BM and spleens of 4-week-old premalignant Eμ-myc mice of the indicated genotypes were stained with antibodies to B220, IgM, and IgD. Proportions of mature B cells (B220+IgM+), recirculating B cells (IgM+IgD+), and T1 transitional and marginal zone B cells (IgMhi/IgDlo) are shown. Error bars represent SEM. (E) BM and splenic cells from 3-week-old Eμ-myc mice of the indicated p53 and p73 genotypes were analyzed as in D. Error bars represent SEM.
In contrast to nontransgenic p73-deficient mice, analysis of premalignant compound Eμ-myc mice heterozygous for p53 (p53-null Eμ-myc animals could not be analyzed because they die in utero) showed that the differentiation defect associated with p73 deficiency was not significantly rescued by loss of 1 p53 allele and thus is possibly p53-independent (Figure 2E). Based on these aggregate results, we conclude that p73 loss affects B cell numbers by altering their development and/or peripheral differentiation. Moreover, in the context of Myc, the absence of p73 allows increased B cell maturation in premalignant mice.
p73 loss has no discernible effect on disease onset and mortality in Myc-induced lymphomagenesis.
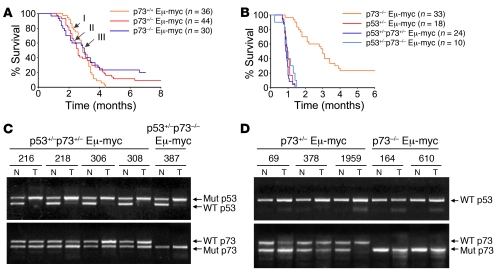
WT Eμ-myc mice develop fully penetrant, lethal B cell lymphomas starting at 2 months of age (22, 23). Most WT Eμ-myc mice in our cohort also succumbed to lymphomas within 2–4 months after birth (Figure 3A, n = 36). Of note, survival of p73+/– Eμ-myc mice (n = 44) and p73–/– Eμ-myc mice (n = 30) did not differ significantly when Kaplan-Meier survival curves were analyzed by log-rank test (P = 0.127 for WT vs. p73–/–; P = 0.313 for WT vs. p73+/–; overall P = 0.291). We conclude that p73 loss has no discernible effect on disease onset and mortality in Myc-induced lymphomagenesis.
Figure 3. p73 deficiency has no discernible effect on disease onset and mortality in Myc-driven lymphomagenesis.
(A) Kaplan-Meier survival curves of WT Eμ-myc (curve I), p73+/– Eμ-myc (curve II), and p73–/– Eμ-myc (curve III) mice. The number of animals per genotype is indicated. (B) Kaplan-Meier survival curves of Eμ-myc mice of the indicated p53 and p73 genotypes. (C and D) LOH analysis at the p53 and p73 loci by genomic PCR of matched pairs of normal (N) and tumor (T) tissues derived from Eμ-myc p53+/–p73+/– and Eμ-myc p53+/–p73–/– mice (C) or from Eμ-myc p73+/– and Eμ-myc p73–/– mice (D). Individual animals are indicated.
p53 but not p73 is the dominant tumor suppressor in Myc-induced lymphomagenesis.
We next examined lymphoma onset and latency in genetically matched Eμ-myc p53+/–, p53+/–p73+/–, and p53+/–p73–/– mice. As expected, loss of 1 p53 allele accelerated tumor onset and mortality compared with Eμ-myc p73–/– mice (Figure 3B). In contrast, loss of 1 or 2 p73 alleles on the p53+/– Myc background had no further impact on survival (Figure 3B). As reported (28, 29), tumors arising in the p53+/– Myc background lost the remaining WT p53 allele, consistent with their highly aggressive behavior (Figure 3C), while no loss of heterozygosity (LOH) occurred in the remaining WT p73 allele (Figure 3C). Likewise, single p73+/– Myc lymphomas showed no loss of the remaining WT p73 allele (Figure 3D). In sum, these results indicate that p53 but not p73 is the dominant tumor suppressor in Myc-induced lymphomagenesis.
Loss of p73 promotes dissemination of Eμ-myc lymphomas.
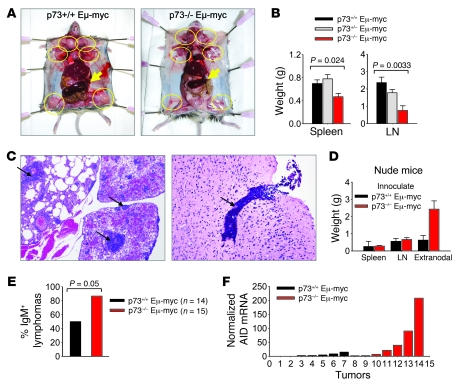
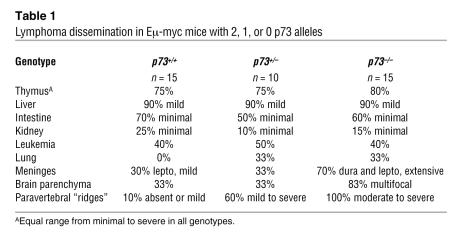
Histologically, no consistent difference was seen in the morphologic appearance of Eμ-myc p73+/+ and p73–/– lymphomas (Supplemental Figure 2). However, loss of p73 induced a marked alteration in the clinical phenotype of Eμ-myc lymphomas. Thus, p73+/+ Eμ-myc lymphomas invariably presented as bulky nodal disease with massive splenomegaly and general lymphadenopathy that was easily palpable and dominated the disease picture (representative examples shown in Figure 4, A and B, and Supplemental Figure 3). Eventually, at the advanced stage of disease, tumor dissemination to BM and some other organs occurred (Table 1) (22, 23).
Figure 4. Loss of p73 promotes dissemination of Eμ-myc lymphomas.
(A) Representative moribund p73+/+Eμ-myc and p73–/– Eμ-myc mice are shown. Arrows, spleens; circles, lymph nodes. For comparison, spleens have been placed on top of the bowel. (B) Average weight of spleen and lymph nodes (compound per animal) from moribund Eμ-myc p73+/+, p73+/–, and p73–/– mice. Error bars represent SEM derived from 20 mice of each genotype. (C) Histological examination (H&E staining) of lymphoma dissemination in p73–/– Eμ-myc mice. Arrows denote lymphomatous infiltrates in lung and brain parenchyma. Original magnification, ×4 (left); ×10 (right). (D) Weight of reconstituted lymphomas in nude mice inoculated with Eμ-myc p73+/+ and p73–/– lymphoma cells (1 × 10⁶ cells each). Error bars represent SEM from 4 independent experiments. (E) Immunophenotyping of tumors from p73+/+ and p73–/– Eμ-myc mice with B220, CD19, and IgM antibodies. Tumors were classified as either predominantly (>80%) IgM-positive (mature) or IgM-negative (immature). (F) Quantitative real-time RT-PCR analysis of AID in Eμ-myc p73+/+ and p73–/– lymphomas (7 random tumors per genotype).
Table 1 .
Lymphoma dissemination in Eμ-myc mice with 2, 1, or 0 p73 alleles
In contrast, a consistent feature of lymphomas arising in p73–/– Eμ-myc mice was a lack of the gross degree of splenomegaly and massive lymphadenopathy. Thus, the average nodal tumor burden (spleen weight and combined lymph node weight) of moribund p73–/– Eμ-myc was reduced by 33% and 68%, respectively, compared with their p73+/+ Eμ-myc controls (Figure 4B). Instead of bulky nodal tumors, the disease of tumor-bearing p73–/– Eμ-myc mice was marked by systemic signs of illness, including severe apathetic appearance, heavy breathing, and the inability to take food and water. Mice of all genotypes were sacrificed when the strictly defined experimental end point was reached (see Methods). Histological analysis showed that the clinical disease of p73–/– Eμ-myc mice was mainly due to widespread tumor dissemination, the extent of which was considerably higher compared with that of p73+/+ Eμ-myc animals (examples in Supplemental Figure 4). Conversely, when tissues from Eμ-myc p73+/+ and p73–/– mice were compared whose lymphadenopathy was equal in extent, control tumors were not disseminated but limited to spleens and lymph nodes (data not shown). One third of p73+/– and p73–/– Eμ-myc mice showed dissemination to the lung (Table 1 and Figure 4C), an organ not affected in our control cohort, regardless of tumor burden or leukemic status. Furthermore, while meningeal involvement in control mice was mild, affecting the leptomeninges in 30% of preterminal animals, it was extensive, with massive thickening of the dura mater and leptomeninges in 70% of p73–/– Eμ-myc mice (Table 1). Likewise, while spread to brain parenchyma occurred in 33% of control mice, 83% of p73–/– Eμ-myc mice were affected (Table 1 and Figure 4C). One of the most striking dissemination patterns found in all p73–/– Eμ-myc mice was the presence of macroscopically apparent lymphomatous tumor masses (“ridges”) running symmetrically along the vertebral column (Table 1 and Supplemental Figure 4). Histologically, these tumor masses had completely effaced paravertebral skeletal muscles and soft tissues. In contrast, only 10% of control mice were affected (Table 1). Interestingly, the incidence of leukemia was similar between the genotypes (Table 1), suggesting that the widespread tumor dissemination into extranodal and extralymphoid tissues upon p73 loss was not simply due to leukemic conversion.
The enhanced dissemination propensity of p73–/– compared with p73+/+ lymphoma cells was also reproducible in nude mouse assays. After tail vein injection, p73–/– Eμ-myc lymphoma cells showed greater degree of extranodal growth compared with WT Eμ-myc controls (Figure 4D). In mice receiving p73–/– tumor cells, the entire viscera in the abdominal cavity were completely overrun by tumor masses. Dissemination also extended into abdominal muscles, the paravertebral regions, lymph nodes, brain, lung, and skin. Collectively, these data demonstrate that p73–/– Eμ-myc lymphomas exhibit a greater propensity for widespread dissemination and extranodal growth than WT Eμ-myc control tumors, which is the single major cause of death in tumor-bearing p73–/– Eμ-myc mice.
As already seen with premalignant B cells (Figure 2, C and D), p73 loss also allowed increased maturation in malignant B cells. Thus, 90% of p73-null lymphomas (n = 15) expressed surface IgM, indicating a more mature B cell phenotype, compared with only 50% of p73+/+ lymphomas (n = 14) (Figure 4E; P = 0.050, 2-tailed Fisher’s exact test). In support, p73–/– lymphomas tended to express increased levels of activation-induced cytidine deaminase (AID) (Figure 4F; 7 randomly chosen lymphomas per genotype), an enzyme normally required in mature B cells for antibody diversification via class switch recombination and somatic hypermutation. When constitutively expressed, AID is involved in germinal center–derived mature B lymphomagenesis by generating DNA double-strand breaks in off-target genes (30, 31). Taken together, while half of our WT Eμ-myc lymphomas were immature lymphoblastic pre–B lymphomas (23), p73–/– Eμ-myc tumors were predominantly mature aggressive tumors. As such, they display a higher incidence of features resembling diffuse large B cell lymphoma (DLBCL), an important and diverse group of mature aggressive human B cell neoplasms with a high propensity for extranodal dissemination (32).
p73 loss does not confer a proliferative or survival advantage to tumor cells.
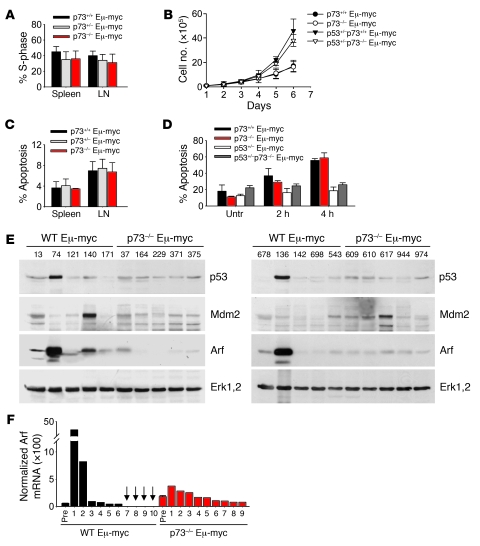
Impaired apoptosis is central to tumor development. However, contrary to expectations, p73 loss did not confer a growth or survival advantage to the cell. Premalignant p73–/– Eμ-myc B cells from BM did not show an increase in proliferation (Figure 2B) or a decrease in apoptosis (Supplemental Figure 1B). Likewise, malignant p73+/+ and p73–/– lymphomas did not differ in their proliferative rates (Figure 5, A and B, and data not shown) and spontaneous apoptosis rates (Figure 5C). Furthermore, p73–/– Eμ-myc tumor cells did not grow well in vitro and rapidly died upon exposure to genotoxic drugs, similar to p73+/+ tumor cells (Figure 5D). In contrast, tumors derived from p53+/–p73–/– Eμ-myc mice were refractory to apoptosis (Figure 5D). Thus, although p73 is thought to be one of the downstream mediators of Myc-induced apoptosis in solid cancers (4, 5, 11, 25), p73 loss in Eμ-myc B cells in vivo does not confer an apoptosis defect. This situation is reminiscent of MEFs, in which c-Myc sensitization of etoposide-induced apoptosis is similar between WT and p73–/– MEFs (8). Of possible interest in this context, c-Myc was reported to physically bind to p73, thereby impairing p73’s transcriptional activity on the Bax and p21 promoters (33).
Figure 5. p73 loss does not confer a proliferative or survival advantage to tumor cells.
(A) S-phase proportion of cells in primary tumors derived from spleens and lymph nodes of Eμ-myc mice of the indicated genotypes (n = 10 per genotype). (B) In vitro growth curves of Eμ-myc lymphoma cell lines of the indicated genotypes (2 lines each). Identical results were obtained with 2-hour pulse labeling by BrdU. (C) Spontaneous apoptosis in primary tumors from spleens and lymph nodes (n = 10 per genotype). (D) In vitro apoptosis in lymphoma cells (3 cell lines per genotype) that were challenged with 2 μg/ml etoposide for 2 or 4 hours. FACS analysis of propidium iodine–stained (A) or annexin V/propidium iodine–stained (C and D) cells. Error bars represent SEM (A–D). (E) Immunoblot analysis of p53, Mdm2, and Arf expression in Eμ-myc p73+/+ and p73–/– lymphomas. Tumor numbers are indicated. Erk1,2, loading control. (F) Arf mRNA expression, determined by quantitative real-time RT-PCR. Total RNA was isolated from B cells of premalignant (Pre) (n = 3 mice per genotype) or tumor-bearing p73+/+ (n = 10) and p73–/– (n = 9) Eμ-myc mice. Numbers denote individual tumors. HPRT levels were used for normalization. Error bars represent SEM.
In addition to changes in the clinical course and immunophenotype, loss of p73 influenced tumor cytogenetics. Lymphomas from Eμ-myc p73+/+ and p73+/– mice were characteristically aneuploid. In contrast, most p73–/– Eμ-myc lymphomas did not display aneuploidy but remained pseudodiploid, as determined by flow cytometry and spectral karyotyping (Supplemental Figure 5 and data not shown).
Because lymphomas arising in WT Eμ-myc mice frequently mutate the p19ARF/p53 pathway (29, 34), we next evaluated p53 and ARF status in tumors arising in p73–/– Eμ-myc mice. Interestingly, while the expected proportion of WT Eμ-myc lymphomas either sustained inactivating p53 mutations (e.g., tumors 74 and 136, sequence confirmed), Mdm2 overexpression (e.g., tumor 140), or other unknown mutations impinging on the pathway (e.g., tumor 13) that collectively are all reflected by aberrant ARF upregulation, p73–/– Eμ-myc lymphomas did not exhibit high levels of p53 protein indicative of p53 mutations (Figure 5E). Sequencing full-length p53 cDNAs from 12 p73-null lymphomas (including tumors shown in Figure 5E) confirmed their WT p53 status. Although WT Eμ-Myc B cells express very low levels of ARF protein as long as disease is latent (35), mutations of p53 disrupt the p53-ARF negative-feedback loop, resulting in strong induction of ARF levels (24). Conversely, the p53 pathway can be crippled by a complete loss of ARF expression (24), even though ARF inactivation is itself insufficient to trigger lymphomagenesis in Eμ-myc mice (35). Of note, while ARF was markedly upregulated in 4 of 10 p73+/+ lymphomas, ARF levels remained low in all p73–/– lymphomas (Figure 5E). Relative quantitation by real-time PCR in individual tumors confirmed that Arf mRNA levels in WT Eμ-myc lymphomas varied widely, including greatly increased levels in 2 cases and undetectable levels in 4 cases. In contrast, Arf mRNA levels displayed little or no change in tumors of p73–/– Eμ-myc mice compared with their premalignant p73–/– Eμ-myc controls or WT Eμ-myc B cells (Figure 5F), confirming WT p53 status of p73–/– tumors. Thus, we surmise that cryptic mutations other than those causing p53 and/or Arf loss of function accompany the conversion of premalignant p73–/– Eμ-myc B cells to tumor cells.
p73 loss deregulates expression of genes involved in lymphocyte homing and lymphoma dissemination.
As a step toward characterizing transcriptional profiles that might be relevant in lymphoma dissemination promoted by p73 deficiency, we performed expression analyses of representative tumors from Eμ-myc p73+/+ and p73–/– mice. Only tumors with WT p53 were chosen. A total of 822 genes were differentially regulated by at least 2-fold in p73–/– compared with p73+/+ lymphomas. Of these, 377 genes were upregulated, while 445 were downregulated in p73–/– tumors. Some of these genes were reported as direct target genes of p73 and/or p53 regulation. Within the upregulated genes, Timp2 is a p73 target (36), Ptpre is a validated novel p53 target, and 5 genes (Alox5, Marco, Chn2, Abcb9, and Gas6) contain ChIP/PET-verified p53 response elements (37). Within the downregulated genes, Jag2, Trim32, Cth, Idh2, Arntl, and Xrcc6 were reported as direct p73 targets (36, 38), Nck2 is a validated novel p53 target, and 7 genes (Ank, Eno1, Pcnx, Kcnk1, Pmvk, Ddit4, and Tle1) contain ChIP/PET-verified p53 response elements (37).
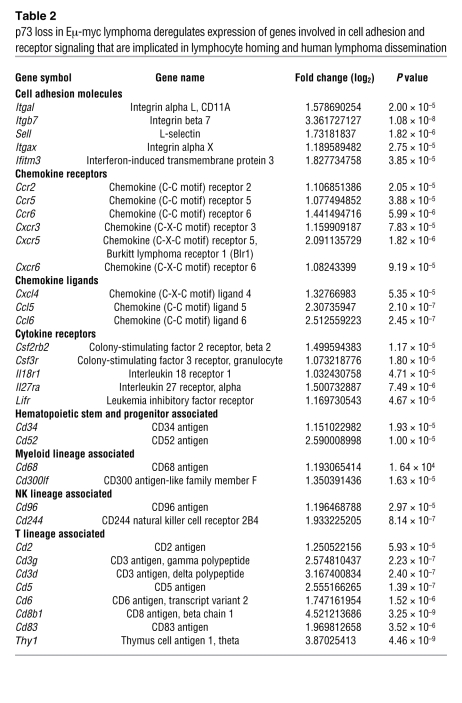
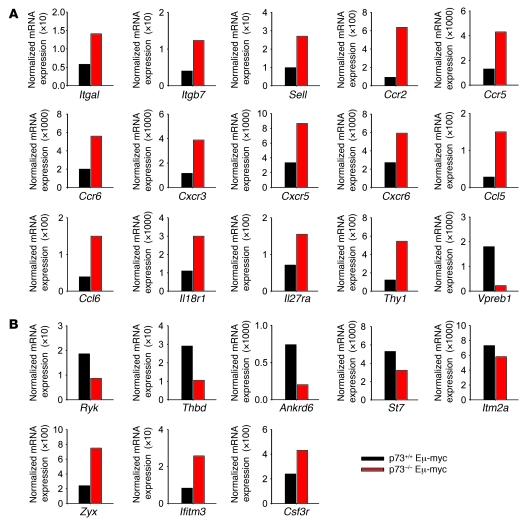
Interestingly, based on Gene Ontology (GO) classification, a large group of up- and downregulated genes (31%, 116 of 377; and 15%, 67 of 445, respectively) in disseminating p73-null lymphomas encoded cell-surface proteins involved in cell adhesion and receptor signaling (Supplemental Table 1; PANTHER functional annotation). For example, p73-null tumors showed upregulation of cell adhesion molecules integrin αL, integrin β7, integrin αX, and L-selectin. Moreover, p73-null tumors showed upregulation of chemokine receptors (Ccr2, Ccr5, Ccr6, Cxcr3, Cxcr5, and Cxcr6), chemokine ligands (Cxcl4, Ccl5, and Ccl6), and cytokine receptors (Csf2rb2, Csf3r, Il18r1, Il27ra, and Lifr) (Table 2). Additional deregulated genes in p73-null tumors included hematopoietic stem and progenitor cell–, myeloid lineage–, NK cell lineage–, and T cell lineage–associated genes (Table 2). Of note, adhesion molecules such as L-selectin and integrin β7 as well as chemokine receptors such as CXCR5 are implicated in lymphocyte homing and dissemination of human lymphomas (reviewed in ref. 39). Twenty-three cell-surface genes, shown in Tables 2 and 3, were extensively validated by quantitative real-time RT-PCR in primary malignant lymphomas and premalignant B cells from BM (Figure 6, A and B, and Supplemental Figure 6A). Both premalignant and malignant samples showed consistent p73-dependent changes in the expression profiles of specific genes, indicating that their changes are specific, robust, and occur early during lymphomagenesis (Figure 6, A and B, and Supplemental Figure 6A).
Table 2 .
p73 loss in Eμ-myc lymphoma deregulates expression of genes involved in cell adhesion and receptor signaling that are implicated in lymphocyte homing and human lymphoma dissemination
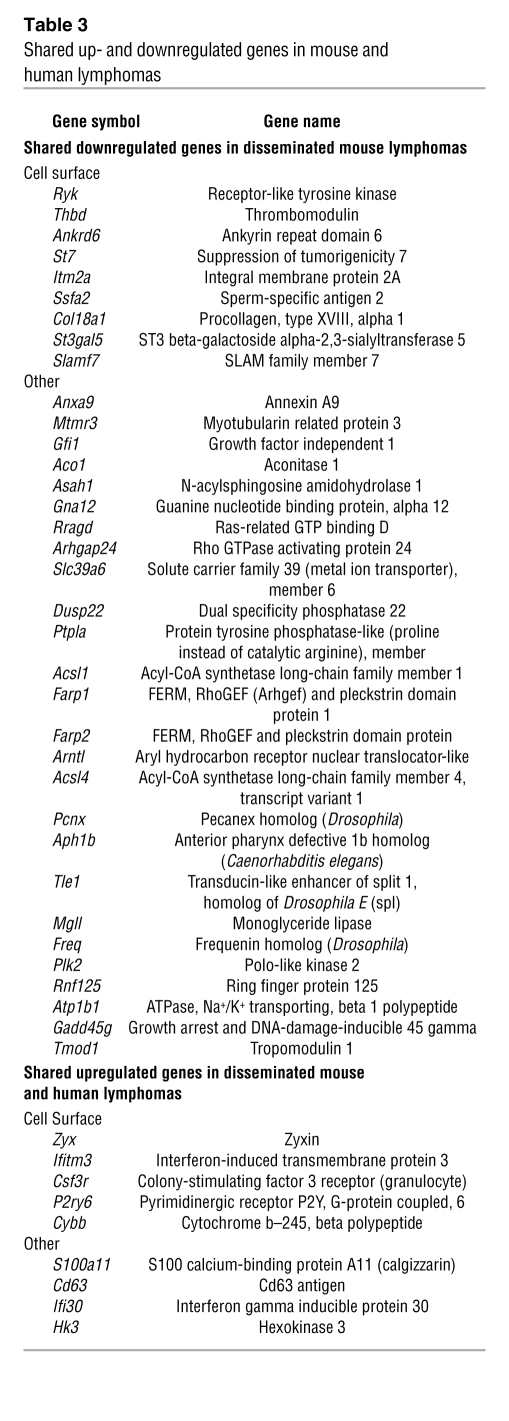
Table 3 .
Shared up- and downregulated genes in mouse and human lymphomas
Figure 6. Validation of select genes from microarray analysis by quantitative real-time RT-PCR.
(A and B) Quantitative real-time RT-PCR analysis of genes relevant to tumor dissemination in Eμ-myc mice. In B, the selection is based on overlap of deregulated genes in mouse and human B lymphomas. Shown are average expression levels in WT and p73–/– Eμ-myc lymphomas (5 pooled tumors per genotype, equal cDNA input per tumor, all tumors harbor WT p53). HPRT used for normalization, samples run in duplicate.
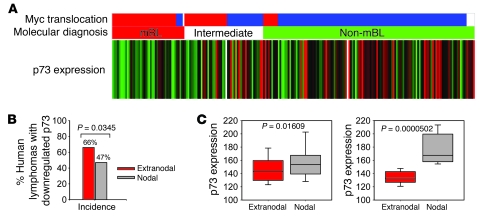
In addition, we asked whether shared deregulated genes exist between disseminating mouse (p73–/– Eμ-myc) and disseminating human B lymphomas. To this end, we queried a published annotated human database of 221 mature aggressive B lymphomas that had been characterized in great detail (GEO GSE4475) (40). Based on transcriptional and genomic profiling, tumors belonged to 1 of 3 groups (molecular Burkitt lymphoma [mBL]; intermediate group; and non-mBL, the latter largely corresponding to DLBCL and primary mediastinal large B cell lymphoma). Of note, p73 expression was downregulated in 82% of the human mBL lymphomas and in 49% of the intermediate and non-mBL lymphomas (Figure 7A). This confirms and extends previous studies that report loss of p73 expression in nearly one-third of non-Hodgkin B lymphomas (16–19).
Figure 7. Correlation between p73 downregulation and dissemination in mature aggressive human lymphomas.
(A) Expression of the TP73 gene in 221 human cases of mature aggressive B lymphomas analyzed in ref. 40. Cases with p73 downregulation (green), upregulation (red), or no change (black) compared with the average p73 expression of all 221 cases are indicated. White, not available. The middle bar indicates classification by molecular diagnosis according to ref. 40; molecular Burkitt lymphoma (red); intermediate (white); non-mBL (green). The top bar indicates the presence or absence of Myc translocation; positive (red); negative (blue); not available (white). (B) Incidence of human extranodal and nodal lymphomas with downregulated p73. (C) Relative levels of p73 mRNA expression in extranodal (E×N) versus nodal (N) human lymphomas. Box plot analyses based on all E×N (n = 65) and N (n = 66) lymphomas (left), or E×N (n = 43) and N (n = 31) lymphomas (right) classified as exhibiting greater than 2-fold downregulation of p73 with respect to the entire 221 case cohort. The horizontal line within the boxes indicates the median expression level, with the lower and upper box representing the 25th and 75th percentile, respectively. Whiskers demarcate the 10th and 90th percentile.
We next analyzed in the human lymphoma cohort whether p73 downregulation is relevant to dissemination. Dissemination status was known for 131 of these 221 tumors, of which 65 presented as extranodal (with or without additional nodal disease, grouped as ExN) and 66 presented as nodal (N) lymphomas. A statistically significant correlation between incidence and degree of p73 downregulation and lymphoma dissemination was identified. In extranodal tumors, 66% (43 of 65 cases) exhibited downregulated p73 compared with only 47% (31 of 66 cases) of nodal tumors (P = 0.0345) (Figure 7B). Moreover, extranodal lymphomas exhibited lower p73 expression than nodal lymphomas (Figure 7C; all 131 cases; P = 0.01609). This correlation was further strengthened within the “low p73” subset of lymphomas (i.e., those with over 2-fold p73 downregulation compared with the mean of the entire 221 case cohort) (Figure 7C; P = 0.0000502). The 31 downregulated nodal cases consisted of 7 mBL, 7 intermediate type, and 17 non-mBL. The 43 downregulated extranodal cases consisted of 15 mBL, 10 intermediate type, and 18 non-mBL lymphomas.
Interestingly, among the 445 downregulated mouse genes, 35 genes (8%) are codownregulated in all disseminating mouse and human lymphomas (Table 3 and Supplemental Figure 6B). Among them are 9 cell-surface–expressed genes. These include Ryk, a member of the receptor tyrosine kinase family that functions as a receptor for Wnt proteins; thrombomodulin, a cell-surface anticoagulant glycoprotein; and integral membrane protein 2A, which is normally induced during thymocyte selection and T cell activation (Table 3 and Figure 6B).
Furthermore, when each case was analyzed individually, 92% of the extranodal human lymphomas (60 of the 65 cases) shared at least 50% of their downregulated gene list with the downregulated mouse gene list derived from p73–/– Eμ-myc mice with disseminating lymphoma. Conversely, 17% of extranodal human lymphomas (11 of 65 cases) shared at least 50% of their upregulated gene list with the upregulated mouse gene list. Among them, 9 genes overlapped, in that they were upregulated in all disseminating mouse and those human lymphomas with more than 50% overlap, i.e., the subset of 17% (Table 3 and Supplemental Figure 6B). (In a random overlap model one would expect 0.198 genes.) Five of these 9 genes were cell-surface genes. They included interferon-induced transmembrane protein 3 (Ifitm3), normally expressed on migratory primordial germ cells modulating cell adhesion. Ifitm3 acts as a homing signal and enables cells to respond to environmental cues that guide their localization (41). Other notable genes are the colony-stimulating factor 3 receptor (Csf3r) and zyxin, a cytoskeletal protein involved in cell adhesion (42) (Figure 6B). In sum, p73 loss associated with mouse lymphoma dissemination alters the transcriptome significantly, including deregulated expression of cell-surface genes known to be involved in lymphocyte homing and dissemination of human lymphomas (39).
Discussion
Here we provide what we believe are novel insights into the role of p73 in B cell lymphomagenesis using the Eμ- myc model. We show that p73 plays an important function in normal B cell development, since its depletion decreases immature and mature B cell populations in primary and secondary lymphoid organs by 30%–40% in a p53-dependent manner. Interestingly, we discovered that the shortened lifespan of nontransgenic p73–/– mice can be rescued, enabling us to follow onset and development of B lymphomas after crossing them with Eμ-myc mice. We found that p73 loss has no discernible effect on disease onset and mortality in Myc-driven lymphomagenesis. Instead, the main effect of p73 loss in this context is an altered course of disease associated with a change in clinical phenotype, whereas effects on cell growth or apoptosis, as one might have expected from p73 studies in cultured cells, are not observed. The phenotype of p73-null Eμ-myc mice compared with WT Eμ-myc controls is characterized by decreased nodal disease in lymphoid organs, but increased propensity to widespread extranodal dissemination. While 50% of WT Eμ-myc lymphomas in our cohort were immature surface IgM-negative pre/pro–B lymphoblastic tumors (23, 43), 90% of p73-null Eμ-myc mice developed more mature surface IgM-positive B cell neoplasms. As such, they displayed a higher incidence of features resembling DLBCL, a major group of mature aggressive human B cell neoplasms with a high propensity for extranodal dissemination (32). Of note, dissemination in human DLBCL confers a poorer prognosis (44).
To delineate functional distinctiveness versus redundancy between p73 and p53, we generated Eμ-myc compound mice deficient in both genes. Our results indicate functional complementarity, in that p53 acts as the dominant tumor suppressor in the onset of B lymphomas, while p73 is a tumor modulator whose contribution lies mainly in preventing tumor dissemination and extranodal growth. Thus, in this system, p73 functions as a tumor modifier and not as classic tumor suppressor and loss of p73 expression is likely to be a late event in the course of B lymphoma evolution. The fact that p73-null mice are not cancer prone but develop tumors only when crossed into Eμ-myc mice further argues that at least in this oncogenic context, p73 is not a primary tumor suppressor, and its deficiency would likely come into effect when B lymphomas are established. On the other hand, our data raise the possibility that in nascent tumor cells, oncogenic signals render p53 partly dependent on p73 function. In this respect, the absence of p53 mutations in p73-null Eμ-myc tumors is somewhat surprising but not unprecedented. Loss-of-function mutations in Arf, ATM, Bim, or Bax, or overexpression of Bcl2 also cooperate with Myc and partly alleviate the pressure to inactivate p53 during lymphomagenesis (34, 45–48). As such, it will be important to delineate how specific oncogenic factors might influence the functional interactions between p53 and p73.
Human lymphoid malignancies are predominantly B cell in origin. They mainly belong to the NHL group, of which Burkitt lymphoma and DLBCL are important subgroups, and often involve chromosomal translocations among protooncogenes such as c-Myc, Bcl1, Bcl2, and Bcl6 and the immunoglobulin or other active loci (20). The proliferation and dissemination are equally important for lymphoma prognosis (39). Thus, in the International Prognostic Index for aggressive NHL, the number of extranodal sites is one of 4 prognostic variables (44). However, the molecular biology of lymphoma dissemination is incompletely understood and so far mainly based on clinical observations. Up until now, an important role in dissemination has been established for cell adhesion molecules (e.g., L-selectin and integrins), chemokine receptors, and chemokine ligands, which are also known to be involved in lymphocyte homing programs (39, 49–51). We show here in a genetically defined mouse model that p73 loss promotes extralymphatic dissemination of Myc-driven lymphoma and alters the transcriptional signature of the malignant B cells, including cell-surface–associated adhesion molecules, chemokine receptors, their ligands, and cluster of differentiation antigens. We find a parallel situation in a well-characterized large cohort of human mature aggressive B lymphomas. In particular, p73 expression was downregulated in 82% of human Burkitt lymphomas and 49% of Burkitt-like and DLBCL lymphomas. Most interestingly, these human lymphomas show a statistically significant correlation between incidence and degree of p73 downregulation and extranodal dissemination status. Moreover, deregulated genes that are shared between disseminating mouse and human B lymphomas can be identified. The prognostic value of p73 inactivation has been established in ALL, where p73 gene methylation was found in 21% of newly diagnosed ALL patients and correlated with unfavorable outcome (19). Unfavorable prognosis upon p73 loss was also confirmed by another independent study that used 251 ALL patients (19). The prognostic value of p73 inactivation in human NHL has been speculated upon, but no clinical outcome data are available yet (reviewed in ref. 19). Our data suggest a hitherto unknown pathogenetic role of p73 as a lymphoma modifier, favoring dissemination. As such, p73 might be a putative biomarker for human B lymphoma dissemination, a notion that can now be tested in clinicopathologic correlation studies.
Methods
Mice.
All animal studies were approved by the Institutional Animal Care and Use Committee at Stony Brook University. The study was littermate controlled and performed in a defined way (see below). Trp73-knockout mice (gift from F. Mckeon, Harvard Medical School, Boston, Massachusetts, USA; ref. 12) were maintained on the 129Sv background. p73+/– mice were interbred with C57BL/6 Eμ-myc mice (Jackson Laboratory) to obtain the F1 generation of Eμ-myc p73+/– transgenic animals. These were interbred with p73+/– mice to obtain the F2 generation Eμ-myc p73+/+, p73+/–, and p73–/– transgenic animals (129 × B6; 75:25). p53+/–p73+/– double-heterozygous mice were derived by crossing p73+/– with p53–/– mice (Trp53tm1Tyj on the 129Sv background, Jackson Laboratory). p53–/–p73+/– mice were derived from crosses between the double-heterozygous animals. p53–/–p73–/– mice were derived from crosses between p53+/–p73+/– mice or p53+/–p73+/– with p53–/–p73+/– mice. p73+/– Eμ-myc transgenic mice (129 × B6) were crossed with p53–/–p73+/– mice (129Sv) to obtain the F1 generations of Eμ-myc p53+/–, p53+/–p73+/–, and p53+/–p73–/– transgenic animals (129 × B6; 75:25). Genotypes were verified by PCR amplifications specific for the corresponding WT and mutant alleles. All animals were genotyped twice, at the time of weaning and when sacrificed. Our experimental end point was defined in the following way: mice were monitored every day for palpable tumors. The maximum tumor size allowed did not exceed 1 cm3. Mice were also monitored for systemic signs of illness, apathy, breathing problems, precipitous weight loss, and limited ability to reach food or water. This was particularly obvious in p73–/– Eμ-myc because they predominantly developed systemic disease rather than palpable tumors. Mice fulfilling any of these criteria were euthanized and subjected to careful necropsy examination. Tumors were harvested and processed for histological examination. For in vivo dissemination assays, 1 million freshly isolated lymphoma cells was injected into the tail veins of CD-1 athymic nude mice (Taconic Farms). After 25 days, reconstituted mice were subject to autopsy; tumors were weighed and tissues processed histologically.
Flow cytometry.
Fresh lymphoid tissue samples were examined by flow cytometry with antibodies to CD19, CD25, CD43, CD44, B220 (CD45R), IgM, IgD, c-Kit, and Sca1 (BD Pharmingen and eBioscience). For cell-cycle analysis, lymphoid cells were fixed in 70% ethanol, stained with propidium iodide, and analyzed using FACSCalibur (BD) with CellQuest software. Annexin V (Roche) staining was performed to measure apoptosis.
Expression analysis.
Semiquantitative and quantitative real-time RT-PCR were performed using whole-cell RNAs prepared from primary lymphoid cells or tumors. The sequences of primers are listed in Supplemental Table 2. For protein analysis, aliquots of whole-cell lysates (50–80 μg of protein) were separated on SDS-acrylamide gels and blotted onto a Protran BA85 nitrocellulose membrane (Schleicher & Schüell). They were then incubated with antibodies specific for p53 (FL-393), Mdm2 (SMP14, both from Santa Cruz Biotechnology Inc.); p19ARF (ab80, Novus Biologicals); and MAPK (3A7; Cell Signaling). Comparative genomic hybridization (CGH analysis) and Spectral karyotyping (SKY) were performed at the Roswell Park Cancer Institute (Buffalo, New York, USA).
Expression microarray.
Only tumors that showed at least 95% B cell enrichment by FACS analysis were selected. Total RNA was extracted from representative tumors of 3-month-old Eμ-myc p73+/+ and Eμ-myc p73–/– mice (3 animals per genotype) using the RNeasy Mini Kit (QIAGEN). The integrity of RNA was validated with Bioanalyzer 2100 QC (all samples RIN > 7.0). One-color hybridizations of labeled cRNAs (2 technical replicas) were performed against the mouse Agilent 44K/60-mer oligonucleotide microarray according to the manufacturer’s instructions (Empire Genomics LLC). Normalized, differentially expressed genes were defined as greater than 2-fold change and P < 0.05 (Student’s t test).
Statistics.
Statistical analyses were performed using the following tests: a single-factor ANOVA at a 95% level of confidence (Figure 2B and Figure 4B); the log-rank test (Figure 3A); Fisher’s exact test, 2-tailed (Figure 4E and Figure 7B); and Student’s t test, 2-tailed (Figure 7C). P ≤ 0.05 was considered statistically significant.
Supplementary Material
Acknowledgments
This work was supported by grants from the National Cancer Institute, the Deutsche Krebshilfe, the Carol Baldwin Foundation, and the Lymphoma Research Foundation (to A. Nemajerova). The authors thank the Molecular Mechanisms of Malignant Lymphoma Consortium funded by Deutsche Krebshilfe, University of Göttingen.
Footnotes
Conflict of interest: The authors have declared that no conflict of interest exists.
Citation for this article: J Clin Invest. 2010;120(6):2070–2080. doi:10.1172/JCI40331.
References
- 1.Jost CA, Marin MC, Kaelin WG., Jr p73 is a simian [correction of human] p53-related protein that can induce apoptosis. Nature. 1997;389(6647):191–194. doi: 10.1038/38298. [DOI] [PubMed] [Google Scholar]
- 2.Kaghad M, et al. Monoallelically expressed gene related to p53 at 1p36, a region frequently deleted in neuroblastoma and other human cancers. Cell. 1997;90(4):809–819. doi: 10.1016/S0092-8674(00)80540-1. [DOI] [PubMed] [Google Scholar]
- 3.Zhu J, Jiang J, Zhou W, Chen X. The potential tumor suppressor p73 differentially regulates cellular p53 target genes. Cancer Res. 1998;58(22):5061–5065. [PubMed] [Google Scholar]
- 4.Fang L, Lee SW, Aaronson SA. Comparative analysis of p73 and p53 regulation and effector functions. J Cell Biol. 1999;147(4):823–830. doi: 10.1083/jcb.147.4.823. [DOI] [PMC free article] [PubMed] [Google Scholar]
- 5.Irwin M, et al. Role for the p53 homologue p73 in E2F-1-induced apoptosis. Nature. 2000;407(6804):645–648. doi: 10.1038/35036614. [DOI] [PubMed] [Google Scholar]
- 6.Griesmann H, Schlereth K, Krause M, Samans B, Stiewe T. p53 and p73 in suppression of Myc-driven lymphomagenesis. Int J Cancer. 2009;124(2):502–506. doi: 10.1002/ijc.23978. [DOI] [PubMed] [Google Scholar]
- 7.Scian MJ, et al. Wild-type p53 and p73 negatively regulate expression of proliferation related genes. Oncogene. 2008;27(18):2583–2593. doi: 10.1038/sj.onc.1210898. [DOI] [PubMed] [Google Scholar]
- 8.Petrenko O, Zaika A, Moll UM. deltaNp73 facilitates cell immortalization and cooperates with oncogenic Ras in cellular transformation in vivo. Mol Cell Biol. 2003;23(16):5540–5555. doi: 10.1128/MCB.23.16.5540-5555.2003. [DOI] [PMC free article] [PubMed] [Google Scholar]
- 9.Moll UM, Slade N. p63 and p73: roles in development and tumor formation. Mol Cancer Res. 2004;2(7):371–386. [PubMed] [Google Scholar]
- 10.Melino G, De Laurenzi V, Vousden KH. p73: Friend or foe in tumorigenesis. Nat Rev Cancer. 2002;2(8):605–615. doi: 10.1038/nrc861. [DOI] [PubMed] [Google Scholar]
- 11.Deyoung MP, Ellisen LW. p63 and p73 in human cancer: defining the network. Oncogene. 2007;26(36):5169–5183. doi: 10.1038/sj.onc.1210337. [DOI] [PubMed] [Google Scholar]
- 12.Yang A, et al. p73-deficient mice have neurological, pheromonal and inflammatory defects but lack spontaneous tumours. Nature. 2000;404(6773):99–103. doi: 10.1038/35003607. [DOI] [PubMed] [Google Scholar]
- 13.Flores ER, et al. Tumor predisposition in mice mutant for p63 and p73: evidence for broader tumor suppressor functions for the p53 family. Cancer Cell. 2005;7(4):363–373. doi: 10.1016/j.ccr.2005.02.019. [DOI] [PubMed] [Google Scholar]
- 14.Perez-Losada J, Wu D, DelRosario R, Balmain A, Mao JH. p63 and p73 do not contribute to p53-mediated lymphoma suppressor activity in vivo. Oncogene. 2005;24(35):5521–5524. doi: 10.1038/sj.onc.1208799. [DOI] [PubMed] [Google Scholar]
- 15.Tomasini R, et al. TAp73 knockout shows genomic instability with infertility and tumor suppressor functions. Genes Dev. 2008;22(19):2677–2691. doi: 10.1101/gad.1695308. [DOI] [PMC free article] [PubMed] [Google Scholar]
- 16.Martinez-Delgado B, et al. Frequent inactivation of the p73 gene by abnormal methylation or LOH in non-Hodgkin’s lymphomas. Int J Cancer. 2002;102(1):15–19. doi: 10.1002/ijc.10618. [DOI] [PubMed] [Google Scholar]
- 17.Corn PG, et al. Transcriptional silencing of the p73 gene in acute lymphoblastic leukemia and Burkitt’s lymphoma is associated with 5′ CpG island methylation. Cancer Res. 1999;59(14):3352–3356. [PubMed] [Google Scholar]
- 18.Kawano S, et al. Loss of p73 gene expression in leukemias/lymphomas due to hypermethylation. Blood. 1999;94(3):1113–1120. [PubMed] [Google Scholar]
- 19.Pluta A, Nyman U, Joseph B, Robak T, Zhivotovsky B, Smolewski P. The role of p73 in hematological malignancies. Leukemia. 2006;20(5):757–766. doi: 10.1038/sj.leu.2404166. [DOI] [PubMed] [Google Scholar]
- 20.Kuppers R. Mechanisms of B-cell lymphoma pathogenesis. Nat Rev Cancer. 2005;5(4):251–262. doi: 10.1038/nrc1589. [DOI] [PubMed] [Google Scholar]
- 21.Siu LL, Chan JK, Wong KF, Kwong YL. Specific patterns of gene methylation in natural killer cell lymphomas: p73 is consistently involved. Am J Pathol. 2002;160(1):59–66. doi: 10.1016/s0002-9440(10)64349-0. [DOI] [PMC free article] [PubMed] [Google Scholar]
- 22.Adams JM, et al. The c-myc oncogene driven by immunoglobulin enhancers induces lymphoid malignancy in transgenic mice. Nature. 1985;318(6046):533–538. doi: 10.1038/318533a0. [DOI] [PubMed] [Google Scholar]
- 23.Adams JM, Cory S. Transgenic models of tumor development. Science. 1991;254(5035):1161–1167. doi: 10.1126/science.1957168. [DOI] [PubMed] [Google Scholar]
- 24.Lowe SW, Sherr CJ. Tumor suppression by Ink4a-Arf: progress and puzzles. Curr Opin Genet Dev. 2003;13(1):77–83. doi: 10.1016/S0959-437X(02)00013-8. [DOI] [PubMed] [Google Scholar]
- 25.Zaika A, Irwin M, Sansome C, Moll UM. Oncogenes induce and activate endogenous p73 protein. J Biol Chem. 2001;276(14):11310–11316. doi: 10.1074/jbc.M005737200. [DOI] [PubMed] [Google Scholar]
- 26.Talos F, Nemajerova A, Flores ER, Petrenko O, Moll UM. p73 Suppresses polyploidy and aneuploidy in the absence of functional p53. Mol Cell. 2007;27(4):647–659. doi: 10.1016/j.molcel.2007.06.036. [DOI] [PubMed] [Google Scholar]
- 27.Langdon WY, Harris AW, Cory S, Adams JM. The c-myc oncogene perturbs B lymphocyte development in E-mu-myc transgenic mice. Cell. 1986;47(1):11–18. doi: 10.1016/0092-8674(86)90361-2. [DOI] [PubMed] [Google Scholar]
- 28.Hsu B, Marin MC, el-Naggar AK, Stephens LC, Brisbay S, McDonnell TJ. Evidence that c-myc mediated apoptosis does not require wild-type p53 during lymphomagenesis. Oncogene. 1995;11(1):175–179. [PubMed] [Google Scholar]
- 29.Schmitt CA, McCurrach ME, de Stanchina E, Wallace-Brodeur RR, Lowe SW. INK4a/ARF mutations accelerate lymphomagenesis and promote chemoresistance by disabling p53. Genes Dev. 1999;13(20):2670–2677. doi: 10.1101/gad.13.20.2670. [DOI] [PMC free article] [PubMed] [Google Scholar]
- 30.Pasqualucci L, Kitaura Y, Gu H, Dalla-Favera R. PKA-mediated phosphorylation regulates the function of activation-induced deaminase (AID) in B cells. Proc Natl Acad Sci U S A. 2006;103(2):395–400. doi: 10.1073/pnas.0509969103. [DOI] [PMC free article] [PubMed] [Google Scholar]
- 31.Mahowald GK, Baron JM, Sleckman BP. Collateral damage from antigen receptor gene diversification. Cell. 2008;135(6):1009–1012. doi: 10.1016/j.cell.2008.11.024. [DOI] [PubMed] [Google Scholar]
- 32.De Paepe P, De Wolf-Peeters C. Diffuse large B-cell lymphoma: a heterogeneous group of non-Hodgkin lymphomas comprising several distinct clinicopathological entities. Leukemia. 2007;21(1):37–43. doi: 10.1038/sj.leu.2404449. [DOI] [PubMed] [Google Scholar]
- 33.Watanabe K, et al. Physical interaction of p73 with c-Myc and MM1, a c-Myc-binding protein, and modulation of the p73 function. J Biol Chem. 2002;277(17):15113–15123. doi: 10.1074/jbc.M111281200. [DOI] [PubMed] [Google Scholar]
- 34.Eischen CM, Weber JD, Roussel MF, Sherr CJ, Cleveland JL. Disruption of the ARF-Mdm2-p53 tumor suppressor pathway in Myc-induced lymphomagenesis. Genes Dev. 1999;13(20):2658–2669. doi: 10.1101/gad.13.20.2658. [DOI] [PMC free article] [PubMed] [Google Scholar]
- 35.Bertwistle D, Sherr CJ. Regulation of the Arf tumor suppressor in Emicro-Myc transgenic mice: longitudinal study of Myc-induced lymphomagenesis. Blood. 2007;109(2):792–794. doi: 10.1182/blood-2006-07-033985. [DOI] [PubMed] [Google Scholar]
- 36.Vikhanskaya F, Marchini S, Marabese M, Galliera E, Broggini M. P73a overexpression is associated with resistance to treatment with DNA-damaging agents in a human ovarian cancer cell line. Cancer Res. 2001;61(3):935–938. [PubMed] [Google Scholar]
- 37.Wei CL, et al. A global map of p53 transcription-factor binding sites in the human genome. Cell. 2006;124(1):207–219. doi: 10.1016/j.cell.2005.10.043. [DOI] [PubMed] [Google Scholar]
- 38.Fontemaggi G, et al. Identification of direct p73 target genes combining DNA microarray and chromatin immunoprecipitation analyses. J Biol Chem. 2002;277(45):43359–43368. doi: 10.1074/jbc.M205573200. [DOI] [PubMed] [Google Scholar]
- 39.Pals ST, de Gorter DJ, Spaargaren M. Lymphoma dissemination: the other face of lymphocyte homing. Blood. 2007;110(9):3102–3111. doi: 10.1182/blood-2007-05-075176. [DOI] [PubMed] [Google Scholar]
- 40.Hummel M, et al. A biologic definition of Burkitt’s lymphoma from transcriptional and genomic profiling. N Engl J Med. 2006;354(23):2419–2430. doi: 10.1056/NEJMoa055351. [DOI] [PubMed] [Google Scholar]
- 41.Tanaka SS, Yamaguchi YL, Tsoi B, Lickert H, Tam PP. IFITM/Mil/fragilis family proteins IFITM1 and IFITM3 play distinct roles in mouse primordial germ cell homing and repulsion. Dev Cell. 2005;9(6):745–756. doi: 10.1016/j.devcel.2005.10.010. [DOI] [PubMed] [Google Scholar]
- 42.Spinardi L, Marchisio PC. Podosomes as smart regulators of cellular adhesion. Eur J Cell Biol. 2006;85(3–4):191–194. doi: 10.1016/j.ejcb.2005.08.005. [DOI] [PubMed] [Google Scholar]
- 43.Mori S, et al. Utilization of pathway signatures to reveal distinct types of B lymphoma in the Emicro-myc model and human diffuse large B-cell lymphoma. Cancer Res. 2008;68(20):8525–8534. doi: 10.1158/0008-5472.CAN-08-1329. [DOI] [PMC free article] [PubMed] [Google Scholar]
- 44.[No authors listed]. A predictive model for aggressive non-Hodgkin’s lymphoma. The International Non-Hodgkin’s Lymphoma Prognostic Factors Project. N Engl J Med. 1993;329(14):987–994. doi: 10.1056/NEJM199309303291402. [DOI] [PubMed] [Google Scholar]
- 45.Eischen CM, Roussel MF, Korsmeyer SJ, Cleveland JL. Bax loss impairs Myc-induced apoptosis and circumvents the selection of p53 mutations during Myc-mediated lymphomagenesis. Mol Cell Biol. 2001;21(22):7653–7662. doi: 10.1128/MCB.21.22.7653-7662.2001. [DOI] [PMC free article] [PubMed] [Google Scholar]
- 46.Egle A, Harris AW, Bouillet P, Cory S. Bim is a suppressor of Myc-induced mouse B cell leukemia. Proc Natl Acad Sci U S A. 2004;101(16):6164–6169. doi: 10.1073/pnas.0401471101. [DOI] [PMC free article] [PubMed] [Google Scholar]
- 47.Hemann MT, et al. Evasion of the p53 tumour surveillance network by tumour-derived MYC mutants. Nature. 2005;436(7052):807–811. doi: 10.1038/nature03845. [DOI] [PMC free article] [PubMed] [Google Scholar]
- 48.Maclean KH, Kastan MB, Cleveland JL. Atm deficiency affects both apoptosis and proliferation to augment Myc-induced lymphomagenesis. Mol Cancer Res. 2007;5(7):705–711. doi: 10.1158/1541-7786.MCR-07-0058. [DOI] [PubMed] [Google Scholar]
- 49.Deutsch AJ, et al. Distinct signatures of B-cell homeostatic and activation-dependent chemokine receptors in the development and progression of extragastric MALT lymphomas. J Pathol. 2008;215(4):431–444. doi: 10.1002/path.2372. [DOI] [PubMed] [Google Scholar]
- 50.Belanger SD, St-Pierre Y. Role of selectins in the triggering, growth, and dissemination of T-lymphoma cells: implication of L-selectin in the growth of thymic lymphoma. Blood. 2005;105(12):4800–4806. doi: 10.1182/blood-2004-04-1406. [DOI] [PubMed] [Google Scholar]
- 51.Kurtova AV, Tamayo AT, Ford RJ, Burger JA. Mantle cell lymphoma cells express high levels of CXCR4, CXCR5, and VLA-4 (CD49d): importance for interactions with the stromal microenvironment and specific targeting. Blood. 2009;113(19):4604–4613. doi: 10.1182/blood-2008-10-185827. [DOI] [PMC free article] [PubMed] [Google Scholar]
Associated Data
This section collects any data citations, data availability statements, or supplementary materials included in this article.


