

Abstract
Studies of nucleotide diversity have found an excess of low-frequency amino acid polymorphisms segregating in Arabidopsis thaliana, suggesting a predominance of weak purifying selection acting on amino acid polymorphism in this inbreeding species. Here, we investigate levels of diversity and divergence at synonymous and nonsynonymous sites in 6 circumpolar populations of the outbreeding Arabidopsis lyrata and compare these results with A. thaliana, to test for differences in mutation and selection parameters across genes, populations, and species. We find that A. lyrata shows an excess of low-frequency nonsynonymous polymorphisms both within populations and species wide, consistent with weak purifying selection similar to the patterns observed in A. thaliana. Furthermore, nonsynonymous polymorphisms tend to be more restricted in their population distribution in A. lyrata, consistent with purifying selection preventing their geographic spread. Highly expressed genes show a reduced ratio of amino acid to synonymous change for both polymorphism and fixed differences, suggesting a general pattern of stronger purifying selection on high-expression proteins.
Keywords: McDonald–Kreitman test, site-frequency spectrum, Arabidopsis, inbreeding, nonsynonymous, synonymous
Introduction
The genus Arabidopsis represents an excellent model system to investigate the causes and consequences of patterns of nucleotide polymorphism and molecular evolution. First, it exhibits a diverse array of mating systems and life histories (Clauss and Koch 2006), and this variation is predicted to have important effects on patterns of neutral diversity, efficacy of natural selection, and rates of adaptation (Wright et al. 2002; Marais 2003; Nordborg et al. 2005; Wright and Gaut 2005). Second, there is evidence for substantial genome evolution, including chromosome number, ploidy, genome size, and base composition (Charlesworth and Barton 2004; Marais et al. 2004; Yogeeswaran et al. 2005; Schranz et al. 2006). Finally, a number of species exhibit an intermediate level of divergence, providing sufficient time for genome evolution although still allowing for the straightforward reconstruction and comparison of patterns of molecular evolution (Clauss and Koch 2006).
Two features of polymorphism and genome structure in the highly selfing model plant Arabidopsis thaliana are suggestive of a reduced efficacy of natural selection due to inbreeding. First, a number of studies have revealed an excess of low-frequency amino acid polymorphism within species relative to divergence (Weinreich and Rand 2000; Bustamante et al. 2002), suggesting an abundance of slightly deleterious amino acids segregating in natural populations. This has been attributed to an effect of inbreeding reducing the efficacy of natural selection and contrasts with alternative expectations that inbreeding taxa should effectively purge deleterious recessive mutations due to homozygosity (Wang et al. 1999). This pattern also contrasts with data from Drosophila melanogaster, where an excess of amino acid fixation suggests frequent positive selection on amino acids (Bustamante et al. 2002; Shapiro et al. 2007). Second, codon usage bias is generally lower than observed in other eukaryotes (Duret and Mouchiroud 1999), suggesting a relaxation of selection on translational efficiency or accuracy.
Although these patterns suggest a weakening of natural selection associated with a highly inbreeding mating system, comparisons with close outcrossing relatives are essential for assessing the role of selfing. In a comparison of substitution rates and genome structure with the outcrossing Arabidopsis lyrata, Wright et al. (2002) found no evidence for a significant excess of amino acid substitutions or a reduction in codon bias in A. thaliana. Although a subsequent study identified a significant difference in synonymous base composition, the analysis suggested that this did not reflect reduced efficacy of natural selection on codon usage bias (Wright, et al. 2007). These studies thus provide little evidence for a difference in the efficacy of selection between selfing and outcrossing species expected under a nearly neutral model of molecular evolution. However, these tests to detect a difference in selection may have been limited for 4 reasons. First, rates of substitution were estimated using a single sequence from each species. Some of the identified changes will thus represent polymorphisms segregating within species, rather than fixed differences. Second, given the observed excess of amino acid polymorphism within A. thaliana, it is possible that inbreeding is driving local fixation of deleterious mutations, but selection is effective enough species-wide or inbreeding recent enough, that there is not a similar increase in amino acid fixations. Third, positive selection on amino acids at some loci would complicate tests for increased deleterious amino acid substitution in inbreeding populations. In particular, if positive selection on amino acids occurs at a significant rate in outcrossers, we may not expect to see an elevated fixation rate of replacement substitutions in inbreeders. Finally, selfing may have evolved recently in A. thaliana (Shimizu et al. 2004; Bechsgaard et al. 2006; Sherman-Broyles et al. 2007; but see Tang et al. 2007), and this might provide insufficient time to detect an effect on molecular evolution, whereas polymorphism patterns may still reveal a detectable accumulation of slightly deleterious mutations in local populations.
A detailed comparison of the patterns of nucleotide polymorphism and divergence would allow a better understanding of the role of selection and mutation in molecular evolution in Arabidopsis. Furthermore, inferences about the nature of selection on different classes of mutation require studies that incorporate within-population sampling, to enable a better picture of their dynamics. For example, an excess of low-frequency amino acid polymorphisms in a species-wide sample could be reflective of local amino acid fixation or long-term maintenance of low-frequency amino acid mutations under mutation and purifying selection. To date, our understanding of selection on amino acids has been limited by a lack of population-level sampling.
Here, we investigate polymorphism and divergence in multiple populations of A. lyrata and compare it with A. thaliana, to test for differences in selection parameters across populations and species and their role in molecular evolution. Because previous studies have suggested an important effect of gene expression level and breadth on the average selection coefficient (Wright et al. 2004), we include genes with contrasting expression profiles in our analysis. Making use of an extensive sequence polymorphism data set (Wright, Ross-Ibarra, et al. 2008), we also include multiple populations with contrasting demography to explore the role of population history within a single species on the patterns of polymorphism and divergence.
Methods
Polymorphism and Divergence Data
Arabidopsis lyrata
We utilized 3 polymorphism data sets from A. lyrata. First, polymorphism data from 62 large exons were taken from Wright et al. (2006) and Wright, Ross-Ibarra, et al. (2008). Briefly, a total of 71 diploid A. lyrata individuals were used for this study. The samples originated from 6 natural populations, each at a single locality. The plants from which sequences were obtained include 15 individuals from Karhumaki, Russia (from O. Savolainen), nine individuals from Stubbsand, Sweden (O. Savolainen), 12 individuals from Plech, Germany (T. Mitchell-Olds), 12 individuals from Esja Mountain, Iceland (E. Thorhallsdottir), 11 individuals from Indiana Dunes, Indiana (B. Mable), and 12 individuals from Rondeau Provincial Park, Ontario, Canada (B. Mable).
Second, to provide more power to investigate a gene expression effect in A. lyrata, we added to these data sets by sequencing 7 additional highly expressed genes, chosen using expression data from massively parallel signature sequencing (MPSS) data (see below). The highly expressed genes chosen were At1g15690, At1g20340, At1g20620, At3g26650, At3g60750, At4g34870, and At5g60390. A subsample of the populations listed above were used for this analysis (see supplementary table S1, Supplementary Material online). Briefly, polymerase chain reaction primers were designed to amplify 650–700 bp from single large exons, and these products were sequenced directly using ABI sequencing. Chromatograms were checked manually for heterozygous sites, using Sequencher version 4.7, with the aid of the “Call secondary peaks” option. All analyses of polymorphism and divergence within A. lyrata were conducted after combining these highly expressed genes with data set one above. All new sequence data from this study were submitted to GenBank, with accession numbers EU592234–EU592323.
Third, for direct comparison of orthologous genes in A. thaliana (see below), we also included sequence data for the following genes in A. lyrata from 2 European populations and 2 North American populations: At1g26310, At1g66340, At4g16780, and At4g05530, from Wright et al. (2003). All A. lyrata sequences were aligned to orthologous genes in A. thaliana from the genome sequence (Arabidopsis Genome Initiative 2000).
To examine substitution patterns that are specific to A. lyrata, we also obtained outgroup data for a subsample of our loci. Outgroup data from Capsella bursa-pastoris were obtained from four individuals, collected from Ontario, Canada (K. Hazzouri). Further outgroup data from Capsella rubella and Boechera stricta were obtained using Blast (Altschul et al. 1990) to search for homologs of A. lyrata loci. In total, we utilize outgroup data for 27 of our loci with polymorphism data in A. lyrata: two loci using C. bursa-pastoris, 15 using C. rubella, and 10 using B. stricta (see supplementary table S1, Supplementary Material online). Phylogenetic analysis indicates that all these species are equally distant from Arabidopsis (Koch et al. 2000), so the use of different outgroups should not affect our conclusions.
Arabidopsis thaliana
We used 675 loci from the A. thaliana polymorphism data set of Nordborg et al. (2005) to examine synonymous and nonsynonymous nucleotide polymorphism and divergence. In addition, we sequenced 13 genes, using the same sampling, that have also been sequenced in A. lyrata in the data sets described above, allowing for direct comparisons of orthologous loci. For the remaining loci, we used the consensus sequences from Blast searches (Altschul et al. 1990) to the A. lyrata shotgun genome sequence to measure divergence at these loci (www.jgi.doe.gov). For each locus, we ensured that each site had at least two Blast hits to A. lyrata (with a cut off of 10 sites per locus with only 1 Blast hit) in order to avoid overestimating substitutions due to sequencing error. If the 2 hits had a disagreement, we conservatively assumed that no substitution had occurred between the species.
Data Analysis
An expression profile was generated for each of the A. lyrata loci used in this study in 5 separate tissues using MPSS data obtained from the A. thaliana MPSS Web site (http://mpss.udel.edu/at/) (Brenner et al. 2000; Meyers et al. 2004). This technique quantifies the abundance of short sequence tags from messenger RNA (mRNA). The 5 tissues included in the expression data are leaves, roots, flowers, siliques, and callus. We searched the database using the Arabidopsis protein query number and used the sum of abundance of sense-strand signatures for the mRNA data to estimate the expression level of each gene. To estimate expression level, we took maximum expression level across tissues as our estimate. When maximum expression was found to be greater than 1,000 transcripts per million (TPM), the gene in question was designated highly expressed. Those genes whose maximum expression level was found to be less than 100 TPM were designated lowly expressed and those whose expression fell between 100 and 1,000 TPM were classified as moderately expressed. These designations roughly correspond to categories of codon usage bias found by Wright et al. (2004, see fig. 1). In the A. lyrata data set, 10 genes were designated highly expressed, 50 genes were designated lowly expressed, and 9 genes were designated moderately expressed. In the A. thaliana data set, 57 genes were designated highly expressed, 273 were designated lowly expressed, and 299 genes were designated moderately expressed.
FIG. 1.—
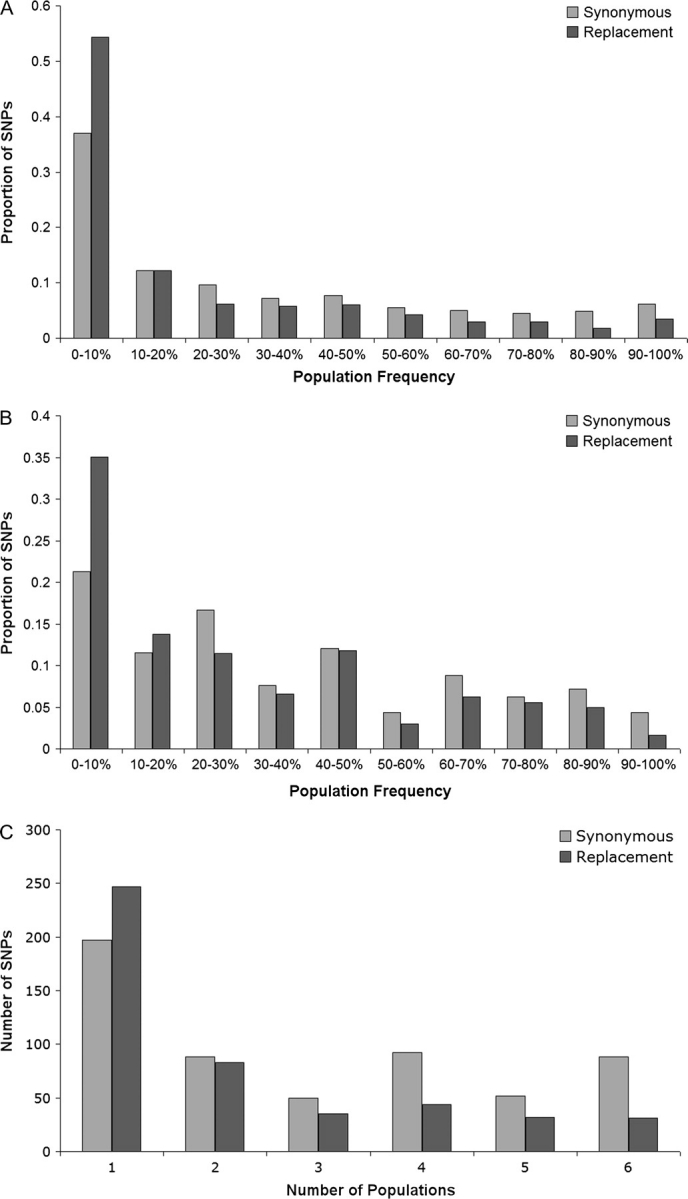
Frequency distributions of derived polymorphic synonymous and replacement variants in Arabidopsis lyrata. Derived states were inferred using Arabidopsis thaliana as an outgroup. (A) Species-wide sample, (B) Within-population sample from Germany, and (C) Distribution of number of populations with derived variant.
Sequence-based summary statistics θ (Watterson 1975) and π (Tajima 1993) synonymous and nonsynonymous as well as frequency data were calculated using a modified version of Perl code (Polymorphurama) written by D. Bachtrog and P. Andolfatto. Derived single nucleotide polymorphism (SNP) frequency distributions were inferred using A. thaliana as an outgroup to determine derived states. Significant differences in site-frequency spectra were tested using the Mann–Whitney U test (MWU), implemented using SPSS version 13 (SPSS Inc., Chicago, IL).
The McDonald–Kreitman test was used to compare the ratio of changes in replacement and synonymous sites for both within-species polymorphism and between-species divergence (McDonald and Kreitman 1991). Under complete neutrality, it is expected that the level of variability within a species and the rate of evolution between species are linearly related to the mutation rate (Kimura 1983). The ratios of variability in synonymous and replacement sites as estimated from both polymorphism data and from fixed differences between A. lyrata and A. thaliana should be equal under complete neutrality. If, however, an excess of fixed replacement substitutions are found when compared with replacement polymorphisms, positive selection is inferred. Similarly, an excess of polymorphic replacement substitutions is suggestive of weak purifying selection. In addition to the McDonald–Kreitman analysis of fixed differences, lineage-specific fixations in A. lyrata and A. thaliana were calculated using outgroup sequence data from C. bursa-pastoris, C. rubella, and B. stricta with the aid of DnaSP Version 4.0 (Rozas et al. 2003). To test whether the outcome of a McDonald–Kreitman test differed significantly across populations, species, and gene expression categories (i.e., whether the relative ratio of amino acid to synonymous polymorphism to fixation differs), we used the Mantel–Haenszel test of homogeneity of odds ratios (Sokal and Rohlf 1995).
In addition, a Bayesian analysis of polymorphism and divergence was performed using the software mkprf (Bustamante et al. 2002). This analysis estimates the population selection parameter 4Ns for each locus, where N is the effective population size and s is the selection coefficient, using observed data of polymorphism and divergence at synonymous and nonsynonymous sites. The analysis was run first with no predefined categories for selection and second assuming that the different gene expression level categories originated from distinct selection distributions. In all cases, default parameter values were used for the analysis.
Results and Discussion
Testing for Selection on Amino Acid Replacements: Species-Wide Samples
Table 1 shows overall species-wide synonymous and replacement polymorphisms within A. lyrata and fixed differences between A. lyrata and A. thaliana. It can be seen that there is a clear excess of replacement polymorphisms (McDonald–Kreitman test P < 0.01) in A. lyrata, as has been found in A. thaliana (Bustamante et al. 2002). We repeated this analysis this time disregarding any polymorphism present at less than 12.5% because low-frequency deleterious variants present in the population may serve to mask the signature of positive selection (Fay et al. 2002). When we remove low-frequency variants, the McDonald–Kreitman test is nonsignificant (P = 0.11), suggesting that deleterious amino acid polymorphisms are restricted to low frequency and the vast majority of amino acid fixations are neutral. Furthermore, analysis of the frequency distribution of polymorphic variants, using A. thaliana as an outgroup, shows a clear excess of low-frequency replacement polymorphisms compared with synonymous (fig. 1A; MWU P < 0.001). Taken together, these results suggest the action of weak purifying selection on a significant fraction of amino acid changes in A. lyrata.
Table 1.
Number of Replacement and Synonymous Substitutions for Fixed Differences between Species and Polymorphisms within Species
| Synonymous | Replacement | |||
| Fixed | Polymorphic | Fixed | Polymorphic | |
| Arabidopsis lyrata | ||||
| Species wide** | 755 | 740 | 440 | 553 |
| Germany | 709 | 436 | 421 | 275 |
| Iceland | 687 | 227 | 392 | 136 |
| Sweden | 608 | 149 | 409 | 111 |
| Russia | 692 | 133 | 395 | 77 |
| Canada | 793 | 102 | 467 | 67 |
| United States* | 714 | 94 | 431 | 76 |
| Arabidopsis thaliana** | 5,884 | 2,032 | 4,873 | 2,539 |
P < 0.05.
P < 0.01.
One limitation of the above analysis is that fixed differences can include fixations that have occurred in both A. thaliana and A. lyrata. If there is a high rate of positive selection on amino acids specifically in A. lyrata, pooling fixed differences could mask the signature of positive selection. We performed a McDonald–Kreitman test on 27 of our loci in A. lyrata this time using C. bursa-pastoris, C. rubella, or B. stricta as outgroups, to estimate lineage-specific fixations in A. lyrata. Our results still show an excess of replacement polymorphisms (Fisher's exact test P < 0.001), again confirming the predominance of purifying selection on amino acids in the A. lyrata genome.
In order to directly compare patterns of polymorphism in A. lyrata with those in A. thaliana, we made comparisons of synonymous and replacement polymorphism and fixation at 13 orthologous loci (At1g01040, At1g06520, At1g26310, At1g36310, At1g36730, At1g59720, At1g62390, At1g65450, At1g66340, At1g68530, At1g72390, At4g05530, and At4g16780). Fixations between the species were inferred using C. bursa-pastoris and B. stricta as outgroups. When we examine the ratios of replacement to synonymous polymorphism for A. lyrata and A. thaliana, we find no significant difference between the 2 species (Fishers exact test P > 0.05, supplementary table S1, Supplementary Material online). Furthermore a comparison of replacement to synonymous fixations between these 2 species reveals no significance (Fishers exact test P> 0.05, supplementary table S1, Supplementary Material online). These results indicate no detectable disparity in the strength of selection on A. lyrata versus the inbreeding A. thaliana, with the caveat that the comparison is based on only 13 genes.
To make a more global, genome-wide comparison, we compared the ratios of replacement polymorphism to synonymous polymorphism between these 2 species using the data of Nordborg et al. (2005; table 1). In this case, the ratio of nonsynonymous to synonymous polymorphism is significantly in excess in the A. thaliana data set compared with A. lyrata (Fisher's exact test, P < 0.01). However, the ratio is also elevated for fixed differences (Fisher's exact test, P < 0.01), suggesting that this set of genes may have a general reduction in constraint on amino acid substitutions compared with loci selected in the A. lyrata polymorphism data. Nevertheless, the neutrality index (ratio of amino acid to synonymous polymorphism relative to the ratio for divergence) is elevated in A. thaliana (1.5) relative to A. lyrata(1.28), and this is a marginally significant difference using a Mantel–Haenszel test (χ2 = 3.3, 1 degree of freedom, P = 0.069). The combined results provide a trend suggesting that A. thaliana may have an elevated neutrality index compared with A. lyrata, but this will have to be confirmed using a larger data set of orthologous loci.
One of the limits of a global analysis, such as that described above, is that although the results are reflective of the genome as a whole, they tell us nothing about individual genes or classes of gene. To further explore our above findings, we performed individual McDonald–Kreitman tests for each locus in our data set (supplementary table S1, Supplementary Material online). From this analysis in A. lyrata, 2 loci (At3g48690 and At1g31930) showed a significant McDonald–Kreitman test (P < 0.05) in the direction of elevated amino acid polymorphism consistent with weak purifying selection or balancing selection, whereas a third locus (At4g14180) showed a significant result driven by elevated amino acid fixation suggestive of positive selection. Given the number of informative loci with a count of at least 4 for polymorphism, divergence, and synonymous and replacement changes (58), we observe approximately 5% of loci significant, which is that number expected simply by random chance. In A. thaliana, 42 of 675 loci (6%) showed significantly elevated amino acid polymorphism suggesting weak purifying selection, whereas six loci (0.8%) diplayed excess amino acid fixation indicative of positive selection (see supplementary table S1, Supplementary Material online). If we restrict tests to those informative loci showing at least 4 differences in each column and row of the McDonald–Kreitman table (i.e., polymorphisms, fixations, synonymous, and nonsynonymous), we find a total of 37 out of 338 (11%) tests to be significant at the 5% level. Of these, 5 (1.5%) show excess replacement fixation consistent with positive selection, whereas 32 (9.5%) show excess amino acid polymorphism consistent with weak purifying selection or balancing selection. Given that 2.5% of tests are expected to show excess in either direction by chance, this suggests an enrichment of genes showing elevated replacement polymorphism.
To quantify per locus estimates of selection on amino acids, we used a Bayesian approach to estimate selection coefficients on amino acids in A. lyrata (Bustamante et al. 2002). Our results suggest a very weakly negative Ns for the majority of genes analyzed (average −0.2) (fig. 2A). Five genes (8.6% of informative loci) showed significant evidence for negative selection, whereas only 2 genes (3.4% of informative loci) show significant positive selection.
FIG. 2.—

Estimates of the population selection coefficient Ns for Arabidopsis lyrata using the Bayesian analysis of synonymous and nonsynonymous polymorphism and divergence mkprf. Error bars show 95% confidence intervals of the parameter estimates. (A) Complete data set considered together and (B) Genes categorized by expression level.
We also performed this Bayesian analysis on 675 loci in A. thaliana (Nordborg et al. 2005) (fig. 3A). Here, our results suggest a similarly negative Ns value for the genes analyzed (average −0.32), and 67 loci (10%) show significantly negative Ns values using the 95% confidence interval. Using the most informative loci, 61 of 338 (18%) show significantly negative Ns values. Ten loci (1.5%) were found to display a significantly positive Ns, although this is below the proportion expected by random chance. Of these 10 loci 4 are known to be involved in disease resistance (At3g51360, At1g10920, At5g22690, and At1g27180; see Supplementary Material online). Because disease resistance genes have previously been shown to be subject to positive selection between loci (Bergelson et al. 2001; Mondragon-Palomino et al. 2002), it is not surprising that they were found to display significantly positive Ns values at individual loci since the divergence of A. lyrata and A. thaliana. Furthermore, only 4 informative loci (2%) were found to display a significantly positive Ns (fig. 3A); given that the remaining 6 loci had fewer than 4 polymorphisms in total, the evidence for positive selection should be treated with caution. The similarity in mean Ns values and excess of genes showing negative Ns in A. lyrata and A. thaliana provides no obvious evidence for a difference in selection pressure acting upon these 2 species.
FIG. 3.—

Estimates of the population selection coefficient Ns for Arabidopsis thaliana using the Bayesian analysis of synonymous and nonsynonymous polymorphism and divergence mkprf. (A) Complete data set considered together and (B) Genes categorized by expression level.
Our results are somewhat inconsistent with the suggestion by Bustamante et al. (2002) that positive selection is reduced in A. thaliana as a result of inbreeding. They contrasted the patterns observed in A. thaliana with the outbreeding D. melanogaster and found evidence for frequent positive selection in the latter species. Although this contrast was inferred to result from the breeding system difference, it can be seen from our results that there is no clear evidence for a decrease in levels of positive selection due to inbreeding; both species show little evidence for positive selection on amino acids in this data set. The general pattern is suggestive of the predominance of purifying selection on amino acid polymorphisms in both species.
Investigation into selection on the human genome has also yielded similar results. For instance, in a study involving 1442 SNPs from 102 individuals representing each major culturally defined ethnic groups, (Hughes et al. 2003) found evidence for widespread purifying selection in human protein-coding loci . A more recent study, in which polymorphism data from 39 humans and over 11,000 genes were contrasted to divergence between humans and chimpanzees found further evidence for widespread weak purifying selection on the human genome (Bustamante et al. 2005). However, evidence for high levels of positive selection on amino acids in many genomes seems to be somewhat more controversial. Drosophila melanogaster remains one of the few examples of rampant positive selection on amino acids (Bustamante et al. 2002; Smith and Eyre-Walker 2002; Bierne and Eyre-Walker 2004; Andolfatto 2005).
Population-Specific Comparisons
Although the species-wide analyses of polymorphism and divergence suggest a general picture of weak purifying selection on amino acid polymorphisms, we wanted to investigate the possible importance of population structure in generating these global patterns. A large-scale polymorphism data set with extensive within-population sampling (Wright, Ross-Ibarra et al. 2008) allowed us to investigate this. When we compared the ratios of nonsynonymous to synonymous polymorphism to fixation for each individual population, we found a higher ratio of nonsynonymous to synonymous polymorphism compared with fixation for each of the 6 populations (table 1). However, with the exception of the US population, these results were found to be nonsignificant, perhaps reflecting reduced power with fewer segregating sites. Nevertheless, this general trend agrees with the action of weak purifying selection on the A. lyrata genome and pairwise comparisons provide no evidence for a significant difference among populations in the ratio of nonsynonymous to synonymous polymorphism (all population pairs; P > 0.05). Similar conclusions were obtained when using the within-population samples to estimate Ns under the Bayesian approach (data not shown). In particular, 3 populations showed an excess of loci with significant evidence of negative selection (Canada 8.6%, Russia 7.8%, and Sweden 5.9% of loci showed significant negative selection), whereas no population had greater than 5% of loci with significant evidence for positive selection.
Next, we investigated the frequency of polymorphic variants across the 6 populations. We calculated the number of populations in which each derived variant was present and found that derived nonsynonymous SNPs were found in fewer populations on average than synonymous SNPs (fig. 1C). The number of derived amino acid SNPs present in a single population (247) relative to multiple populations (247) was significantly higher than the ratio for synonymous polymorphisms (197 vs. 398; Fisher's exact test P< 0.001). These results are consistent with the action of purifying selection preventing the spread of deleterious amino acid alleles across the 6 populations considered.
To investigate further whether the within-population patterns show evidence for distinct selection pressures from those observed in the species-wide sample, we compared the site-frequency spectra for synonymous versus nonsynonymous polymorphisms within each population (fig. 1B for Germany, Supplementary figure S1 [Supplementary Material online] for remaining populations). Analysis of the site-frequency spectra from the German population (fig. 1B), which appears closest to equilibrium (Wright, Ross-Ibarra, et al. 2008), reveals a significant excess of low-frequency amino acid polymorphisms (MWU P = 0.001), consistent with species-wide patterns. This contrasts with the nonsignificant McDonald–Kreitman test within Germany, likely reflecting higher power for the site-frequency spectrum to detect selection. In the remaining cases, both nonsynonymous and synonymous site-frequency spectra are typically skewed toward high-frequency polymorphisms (Supplementary figure S1, Supplementary Material online), likely reflective of postglacial colonization bottlenecks (Muller, et al. 2007; Wright, Ross-Ibarra, et al. 2008). Nevertheless, direct comparisons of the frequencies of nonsynonymous versus synonymous polymorphisms showed a reduced average frequency of nonsynonymous polymorphisms in most populations (Supplementary figure S1, Supplementary Material online). Comparisons of the site-frequency spectra were significant for Iceland (MWU P = 0.003) and the United States (MWU P < 0.006) but not for Canada, Sweden, or Russia (MWU P >> 0.05). The latter nonsignificant results are likely reflective of reduced power associated with lower levels of polymorphism in these populations (Wright, Ross-Ibarra, et al. 2008) but could also reflect the effects of severe population bottlenecks leading to a loss of low-frequency nonsynonymous polymorphisms in these populations.
One potential problem with analysis of the site-frequency spectra is misinference of ancestral states due to multiple substitutions since the divergence between A. thaliana and A. lyrata (Hernandez, et al. 2007). Because synonymous sites have an effectively higher mutation rate, ancestral misinference may more often incorrectly assign low-frequency synonymous mutations as high frequency derived, generating a pattern consistent with purifying selection. To assess this possibility, we also analyzed the “folded” frequency spectrum of minor alleles, without making use of outgroup information. With this analysis, our inference of purifying selection remains unchanged, although the significance levels are reduced (Germany MWU P = 0.039; Iceland MWU P = 0.013; US MWU P = 0.01; and remaining populations P >> 0.05).
In summary, the trends from the McDonald–Kreitman analysis and the comparisons of within-population site-frequency spectra are generally consistent with the conclusions from species-wide data that weak purifying selection predominates patterns of amino acid polymorphism, although some recently bottlenecked populations generally have patterns closer to neutral expectation.
Gene Expression Category Comparisons
When we compared the ratios of replacement to synonymous polymorphism across the 3 categories of gene expression, there was a significant increase in the ratio for the low expression genes in A. lyrata (low expression, 0.83; moderate expression, 0.49; high expression, 0.50; 2 × 3 Fisher's exact test P < 0.01). Similarly, the ratio of replacement to synonymous fixations for the lowly expressed genes is significantly higher than for other categories (low expression, 0.68; moderate expression 0.5; high expression, 0.19; 2 × 3 Fisher's exact test P < 0.01). The observed decrease in the levels of replacement polymorphism and fixation in the more highly expressed genes is consistent with the action of stronger purifying selection on these categories of expression.
Comparing neutrality indices, we find that the highly expressed genes have an elevated index (2.6) compared with low expression genes (1.2), whereas the moderately expressed genes have the lowest index (1.0) and this difference is borderline significant (Mantel–Haenszel test, χ2 = 5.36, P < 0.068). To investigate this result in more detail, we repeated our Bayesian analysis in A. lyrata this time subdividing our genes into the 3 expression categories. This a priori subdivision generates an assumption in the analysis that distinct gene expression categories derive from distinct distributions of selection coefficients, rather than all loci experiencing a single distribution of selection coefficients. With this analysis, the more highly expressed genes show a greater signature of purifying selection than the lowly expressed genes, consistent with the trend from the neutrality indices. Interestingly, the moderately expressed genes were suggestive of very weak positive selection (fig. 2B).
Our results from a similar analysis in A. thaliana revealed a less consistent pattern (fig. 3B). All gene category comparisons showed comparable distributions of selection coefficients. According to this analysis, the highly expressed genes show no evidence for elevated purifying selection, unlike in A. lyrata. However, the contrast could be due to the action of strong purifying selection on these highly expressed genes in A. thaliana, where our data set includes very highly expressed genes. In particular, the McDonald–Kreitman approach identifies purifying selection as an excess amino acid polymorphism relative to divergence, and this is a signature of weak purifying selection. If very highly expressed genes exhibit only strong purifying selection, the signature of negative selection from this framework is eliminated (Weinreich and Rand 2000). Consistent with this, we found the ratios of nonsynonymous to synonymous fixation and polymorphism to both be negatively correlated with expression level (Spearman rank coefficient nonsynonymous to synonymous fixation vs. expression level = −0.273, P < 0.001; Spearman rank coefficient nonsynonymous to synonymous polymorphism vs. expression level = −0.254, P < 0.001).
These results are consistent with observations by Wright et al. (2004) who found a significant negative correlation between MPSS-based estimates of gene expression and the rate of amino acid substitution. Our results confirm this finding at the level of polymorphism and suggest that the elevated amino acid divergence in low expression genes results not from higher rates of positive selection but from lower levels of purifying selection on amino acid changes. Comparable results have recently been found in humans (Osada 2007).
Summary and Conclusion
Our findings indicate that the A. lyrata genome is subject to the action of both weak and strong purifying selection on amino acids, and the pattern is apparent both in species-wide and within-population samples. Our comparison of highly and lowly expressed genes reveals that the more highly expressed genes undergo stronger purifying selection when compared with the lowly expressed genes. As any alteration of genes expressed at such a high level is expected to have detrimental effects on the fitness of the organism for reasons discussed above, these results mirror those previously reported.
Investigation into the presence and nature of selection on plant genomes has consistently revealed the action of purifying selection. Results in humans have for the most part been in agreement. Drosophila melanogaster, however, shows recurrent evidence for the presence of positive selection acting upon its genome (Smith and Eyre-Walker 2002; Andolfatto 2005; Sawyer et al. 2007; Shapiro et al. 2007). When we use the formula derived by Smith and Eyre-Walker (2002) to estimate the proportion of amino acid substitutions driven by positive selection in A. lyrata, we find a value of −10.73% and in A. thaliana −0.13%, consistent with our conclusion that there is little positive selection on amino acids. Using method of Fay, Wyckoff, and Wu based on the ratio of nonsynonymous to synonymous polymorphisms for rare and common SNPs (Fay et al. 2001), we estimate 85% of amino acid mutations to be deleterious, of which 17.94% are slightly deleterious in A. lyrata. This strongly contrasts with Drosophila where 30–45% of amino acid substitutions have been inferred to be positively selected (Shapiro et al. 2007; Smith and Eyre-Walker 2002). The question remains as to why there is such disparity in the literature regarding the action of positive selection on amino acids. It could be that unusually high rates of positive selection have acted upon the Drosophila genome. One possible explanation for this could be very large effective population sizes; recent analyses suggest the predominance of weak positive selection in Drosophila (Andolfatto 2007), and the effective size of many taxa may simply be too low for these mutations to be fixed by selection. Another possibility is that genes analyzed in D. melanogaster were chosen with an a priori expectation that they are under strong positive selection, although with the increasing addition of independent, randomly chosen loci, this explanation seems unlikely (Begun et al. 2007). Finally, it may be that weak purifying selection on synonymous sites is generating significant McDonald–Kreitman results in Drosophila (Nielsen et al. 2007). If common, this effect could alter the interpretation of all tests for selection where synonymous change, presumed to be neutral, has been used to control for mutation.
Supplementary Material
Supplementary table S1 and figure S1 are available at Molecular Biology and Evolution online (http://www.mbe.oxfordjournals.org/).
Supplementary Material
Acknowledgments
We thank T. Slotte for helpful comments and suggestions on analyses. This work was supported by a National Sciences and Engineering Research Council of Canada (NSERC) discovery grant and Alfred P. Sloan Research Fellowship to S.I.W., an National Science Foundation (NSF) grant to B.G. (DEB-0426166), an NSF grant to M.N. (DEB-0115062), and a US National Institutes of Health (HG002790 to M. Waterman).
References
- Altschul SF, Gish W, Miller W, Myers EW, Lipman DJ. Basic local alignment search tool. J Mol Biol. 1990;215:403–410. doi: 10.1016/S0022-2836(05)80360-2. [DOI] [PubMed] [Google Scholar]
- Andolfatto P. Hitchhiking effects of recurrent beneficial amino acid substitutions in the Drosophila melanogaster genome. Genome Res. 2007;12:1755–1762. doi: 10.1101/gr.6691007. [DOI] [PMC free article] [PubMed] [Google Scholar]
- Andolfatto P. Adaptive evolution of non-coding DNA in Drosophila. Nature. 2005;437:1149–1152. doi: 10.1038/nature04107. [DOI] [PubMed] [Google Scholar]
- Arabidopsis Genome Initiative Analysis of the genome sequence of the flowering plant Arabidopsis thaliana. Nature. 2000;14:796–815. doi: 10.1038/35048692. [DOI] [PubMed] [Google Scholar]
- Bechsgaard JS, Castric V, Charlesworth D, Vekemans X, Schierup MH. The transition to self-compatibility in Arabidopsis thaliana and evolution within S-haplotypes over 10 Myr. Mol Biol Evol. 2006;23:1741–1750. doi: 10.1093/molbev/msl042. [DOI] [PubMed] [Google Scholar]
- Begun DJ, Holloway AK, Stevens K, et al. (13 co-authors) Population genomics: whole-genome analysis of polymorphism and divergence in Drosophila simulans. PLoS Biol. 2007;5:e310. doi: 10.1371/journal.pbio.0050310. [DOI] [PMC free article] [PubMed] [Google Scholar]
- Bergelson J, Kreitman M, Stahl EA, Tian D. Evolutionary dynamics of plant R-genes. Science. 2001;292:2281–2285. doi: 10.1126/science.1061337. [DOI] [PubMed] [Google Scholar]
- Bierne N, Eyre-Walker A. The genomic rate of adaptive amino acid substitution in Drosophila. Mol Biol Evol. 2004;21:1350–1360. doi: 10.1093/molbev/msh134. [DOI] [PubMed] [Google Scholar]
- Brenner S, Johnson M, Bridgham J, et al. (24 co-authors) Gene expression analysis by massively parallel signature sequencing (MPSS) on microbead arrays. Nat Biotechnol. 2000;18:630–634. doi: 10.1038/76469. [DOI] [PubMed] [Google Scholar]
- Bustamante CD, Fledel-Alon A, Williamson S, et al. (14 co-authors) Natural selection on protein-coding genes in the human genome. Nature. 2005;437:1153–1157. doi: 10.1038/nature04240. [DOI] [PubMed] [Google Scholar]
- Bustamante CD, Nielsen R, Sawyer SA, Olsen KM, Purugganan MD, Hartl DL. The cost of inbreeding in Arabidopsis. Nature. 2002;416:531–534. doi: 10.1038/416531a. [DOI] [PubMed] [Google Scholar]
- Charlesworth B, Barton N. Genome size: does bigger mean worse? Curr Biol. 2004;14:R233–R235. doi: 10.1016/j.cub.2004.02.054. [DOI] [PubMed] [Google Scholar]
- Clauss MJ, Koch MA. Poorly known relatives of Arabidopsis thaliana. Trends Plant Sci. 2006;11:449–459. doi: 10.1016/j.tplants.2006.07.005. [DOI] [PubMed] [Google Scholar]
- Duret L, Mouchiroud D. Expression pattern and, surprisingly, gene length shape codon usage in Caenorhabditis, Drosophila and Arabidopsis. Proc Natl Acad Sci USA. 1999;96:4482–4487. doi: 10.1073/pnas.96.8.4482. [DOI] [PMC free article] [PubMed] [Google Scholar]
- Fay JC, Wyckoff GJ, Wu CI. Positive and negative selection on the human genome. Genetics. 2001;158:1227–1234. doi: 10.1093/genetics/158.3.1227. [DOI] [PMC free article] [PubMed] [Google Scholar]
- Fay JC, Wyckoff GJ, Wu CI. Testing the neutral theory of molecular evolution with genomic data from Drosophila. Nature. 2002;415:1024–1026. doi: 10.1038/4151024a. [DOI] [PubMed] [Google Scholar]
- Hernandez RD, Williamson SH, Bustamante CD. Context dependence, ancestral misidentification, and spurious signatures of natural selection. Mol Biol Evol. 2007;24:1792–1800. doi: 10.1093/molbev/msm108. [DOI] [PubMed] [Google Scholar]
- Hughes AL, Packer B, Welch R, Bergen AW, Chanock SJ, Yeager M. Widespread purifying selection at polymorphic sites in human protein-coding loci. Proc Natl Acad Sci USA. 2003;100:15754–15757. doi: 10.1073/pnas.2536718100. [DOI] [PMC free article] [PubMed] [Google Scholar]
- Kimura M. The neutral theory of molecular evolution. Cambridge: Cambridge University Press; 1983. [Google Scholar]
- Koch MA, Haubold B, Mitchell-Olds T. Comparative evolutionary analysis of chalcone synthase and alcohol dehydrogenase loci in Arabidopsis, Arabis, and related genera (Brassicaceae) Mol Biol Evol. 2000;17:1483–1498. doi: 10.1093/oxfordjournals.molbev.a026248. [DOI] [PubMed] [Google Scholar]
- Marais G. Biased gene conversion: implications for genome and sex evolution. Trends Genet. 2003;19:330–338. doi: 10.1016/S0168-9525(03)00116-1. [DOI] [PubMed] [Google Scholar]
- Marais G, Charlesworth B, Wright SI. Recombination and base composition: the case of the highly self-fertilizing plant Arabidopsis thaliana. Genome Biol. 2004;5:R45. doi: 10.1186/gb-2004-5-7-r45. [DOI] [PMC free article] [PubMed] [Google Scholar]
- McDonald JH, Kreitman M. Adaptive protein evolution at the Adh1 locus in Drosophila. Nature. 1991;351:652–654. doi: 10.1038/351652a0. [DOI] [PubMed] [Google Scholar]
- Meyers BC, Lee DK, Vu TH, Tej SS, Edberg SB, Matvienko M, Tindell LD. Arabidopsis MPSS. An online resource for quantitative expression analysis. Plant Physiol. 2004;135:801–813. doi: 10.1104/pp.104.039495. [DOI] [PMC free article] [PubMed] [Google Scholar]
- Mondragon-Palomino M, Meyers BC, Michelmore RW, Gaut BS. Patterns of positive selection in the complete NBS-LRR gene family of Arabidopsis thaliana. Genome Res. 2002;12:1305–1315. doi: 10.1101/gr.159402. [DOI] [PMC free article] [PubMed] [Google Scholar]
- Muller MH, Leppala J, Savolainen O. Genome-wide effects of postglacial colonization in Arabidopsis lyrata. Heredity. 2007;100:47–58. doi: 10.1038/sj.hdy.6801057. [DOI] [PubMed] [Google Scholar]
- Nielsen R, Bauer DuMont VL, Hubisz MJ, Aquadro CF. Maximum likelihood estimation of ancestral codon usage bias parameters in Drosophila. Mol Biol Evol. 2007;24:228–235. doi: 10.1093/molbev/msl146. [DOI] [PubMed] [Google Scholar]
- Nordborg M, Hu TT, Ishino Y, et al. (24 co-authors) The pattern of polymorphism in Arabidopsis thaliana. PLoS Biol. 2005;3:e196. doi: 10.1371/journal.pbio.0030196. [DOI] [PMC free article] [PubMed] [Google Scholar]
- Osada N. Inference of expression-dependent negative selection based on polymorphism and divergence in the human genome. Mol Biol Evol. 2007;24:1622–1626. doi: 10.1093/molbev/msm080. [DOI] [PubMed] [Google Scholar]
- Rozas J, Sanchez-DelBarrio JC, Messeguer X, Rozas R. DnaSP, DNA polymorphism analyses by the coalescent and other methods. Bioinformatics. 2003;19:2496–2497. doi: 10.1093/bioinformatics/btg359. [DOI] [PubMed] [Google Scholar]
- Sawyer SA, Parsch J, Zhang Z, Hartl DL. Prevalence of positive selection among nearly neutral amino acid replacements in Drosophila. Proc Natl Acad Sci USA. 2007;104:6504–6510. doi: 10.1073/pnas.0701572104. [DOI] [PMC free article] [PubMed] [Google Scholar]
- Schranz ME, Lysak MA, Mitchell-Olds T. The ABC's of comparative genomics in the Brassicaceae: building blocks of crucifer genomes. Trends Plant Sci. 2006;11:535–542. doi: 10.1016/j.tplants.2006.09.002. [DOI] [PubMed] [Google Scholar]
- Shapiro JA, Huang W, Zhang C, et al. (12 co-authors) Adaptive genic evolution in the Drosophila genomes. Proc Natl Acad Sci USA. 2007;104:2271–2276. doi: 10.1073/pnas.0610385104. [DOI] [PMC free article] [PubMed] [Google Scholar]
- Sherman-Broyles S, Boggs N, Farkas A, Liu P, Vrebalov J, Nasrallah ME, Nasrallah JB. S locus genes and the evolution of self-fertility in Arabidopsis thaliana. Plant Cell. 2007;19:94–106. doi: 10.1105/tpc.106.048199. [DOI] [PMC free article] [PubMed] [Google Scholar]
- Shimizu KK, Cork JM, Caicedo AL, et al. (11 co-authors) Darwinian selection on a selfing locus. Science. 2004;306:2081–2084. doi: 10.1126/science.1103776. [DOI] [PubMed] [Google Scholar]
- Smith NG, Eyre-Walker A. Adaptive protein evolution in Drosophila. Nature. 2002;415:1022–1024. doi: 10.1038/4151022a. [DOI] [PubMed] [Google Scholar]
- Sokal RR, Rohlf FJ. Biometry. Oxford (UK): W.H. Freeman and Company; 1995. [Google Scholar]
- Tajima F. 1993. Measurement of DNA polymorphism. Pp. 37–60. In: N. Takahata, and A Clark, editor. Mechanisms of molecular evolution. Tokyo: Japan Scientific Societies Press. [Google Scholar]
- Tang C, Toomajian C, Sherman-Broyles S, Plagnol V, Guo YL, Hu TT, Clark RM, Nasrallah JB, Weigel D, Nordborg M. The evolution of selfing in Arabidopsis thaliana. Science. 2007;317:1070–1072. doi: 10.1126/science.1143153. [DOI] [PubMed] [Google Scholar]
- Wang J, Hill WG, Charlesworth D, Charlesworth B. Dynamics of inbreeding depression due to deleterious mutations in small populations: mutation parameters and inbreeding rate. Genet Res. 1999;74:165–178. doi: 10.1017/s0016672399003900. [DOI] [PubMed] [Google Scholar]
- Watterson GA. On the number of segregating sites in genetical models without recombination. Theor Popul Biol. 1975;7:188–193. doi: 10.1016/0040-5809(75)90020-9. [DOI] [PubMed] [Google Scholar]
- Weinreich DM, Rand DM. Contrasting patterns of nonneutral evolution in proteins encoded in nuclear and mitochondrial genomes. Genetics. 2000;156:385–399. doi: 10.1093/genetics/156.1.385. [DOI] [PMC free article] [PubMed] [Google Scholar]
- Wright SI, Foxe JP, DeRose-Wilson L, Kawabe A, Looseley M, Gaut BS, Charlesworth D. Testing for effects of recombination rate on nucleotide diversity in natural populations of Arabidopsis lyrata. Genetics. 2006;174:1421–1430. doi: 10.1534/genetics.106.062588. [DOI] [PMC free article] [PubMed] [Google Scholar]
- Wright SI, Gaut BS. Molecular population genetics and the search for adaptive evolution in plants. Mol Biol Evol. 2005;22:506–519. doi: 10.1093/molbev/msi035. [DOI] [PubMed] [Google Scholar]
- Wright SI, Iorgovan G, Misra M, Mokhtari M. Neutral evolution of synonymous base composition in the Brassicaceae. J Mol Evol. 2007;64:136–141. doi: 10.1007/s00239-005-0274-1. [DOI] [PubMed] [Google Scholar]
- Wright SI, Lauga B, Charlesworth D. Rates and patterns of molecular evolution in inbred and outbred Arabidopsis. Mol Biol Evol. 2002;19:1407–1420. doi: 10.1093/oxfordjournals.molbev.a004204. [DOI] [PubMed] [Google Scholar]
- Wright SI, Lauga B, Charlesworth D. Subdivision and haplotype structure in natural populations of Arabidopsis lyrata. Mol Ecol. 2003;12:1247–1263. doi: 10.1046/j.1365-294x.2003.01743.x. [DOI] [PubMed] [Google Scholar]
- Wright SI, Ross-Ibarra J, Foxe JP, Kawabe A, DeRose-Wilson L, Gos G, Charlesworth D, Gaut BS. Local adaptation and demographic history in natural populations of Arabidopsis lyrata. PloS ONE. 2008 doi: 10.1371/journal.pone.0002411. [DOI] [PMC free article] [PubMed] [Google Scholar]
- Wright SI, Yau CB, Looseley M, Meyers BC. Effects of gene expression on molecular evolution in Arabidopsis thaliana and Arabidopsis lyrata. Mol Biol Evol. 2004;21:1719–1726. doi: 10.1093/molbev/msh191. [DOI] [PubMed] [Google Scholar]
- Yogeeswaran K, Frary A, York TL, Amenta A, Lesser AH, Nasrallah JB, Tanksley SD, Nasrallah ME. Comparative genome analyses of Arabidopsis spp.: inferring chromosomal rearrangement events in the evolutionary history of A. thaliana. Genome Res. 2005;15:505–515. doi: 10.1101/gr.3436305. [DOI] [PMC free article] [PubMed] [Google Scholar]
Associated Data
This section collects any data citations, data availability statements, or supplementary materials included in this article.