Abstract
Glucose-stimulated insulin secretion from pancreatic islet β-cells is dependent in part on pyruvate cycling through the pyruvate/isocitrate pathway, which generates cytosolic α-ketoglutarate, also known as 2-oxoglutarate (2OG). Here, we have investigated if mitochondrial transport of 2OG through the 2-oxoglutarate carrier (OGC) participates in control of nutrient-stimulated insulin secretion. Suppression of OGC in clonal pancreatic β-cells (832/13 cells) and isolated rat islets by adenovirus-mediated delivery of small interfering RNA significantly decreased glucose-stimulated insulin secretion. OGC suppression also reduced insulin secretion in response to glutamine plus the glutamate dehydrogenase activator 2-amino-2-norbornane carboxylic acid. Nutrient-stimulated increases in glucose usage, glucose oxidation, glutamine oxidation, or ATP:ADP ratio were not affected by OGC knockdown, whereas suppression of OGC resulted in a significant decrease in the NADPH:NADP+ ratio during stimulation with glucose but not glutamine + 2-amino-2-norbornane carboxylic acid. Finally, OGC suppression reduced insulin secretion in response to a membrane-permeant 2OG analog, dimethyl-2OG. These data reveal that the OGC is part of a mechanism of fuel-stimulated insulin secretion that is common to glucose, amino acid, and organic acid secretagogues, involving flux through the pyruvate/isocitrate cycling pathway. Although the components of this pathway must remain intact for appropriate stimulus-secretion coupling, production of NADPH does not appear to be the universal second messenger signal generated by these reactions.
Keywords: Diabetes, Metabolic Regulation, Mitochondrial Transport, Pancreatic Islet, siRNA, Insulin Secretion
Introduction
Insulin secretion from pancreatic β-cells occurs in response to catabolism of metabolic fuels and is necessary for maintenance of plasma glucose homeostasis. Glucose-induced increases in the cytosolic ATP:ADP ratio play an important role in triggering insulin release by closing ATP-dependent potassium (KATP) channels, leading to a cascade of events, including cell membrane depolarization, influx of calcium, and insulin granule exocytosis (1–4). However, multiple lines of evidence also implicate ATP-independent metabolic signals in control of insulin secretion (5–8). As dysregulation of insulin secretion marks the transition from pre-diabetes to overt hyperglycemia (9), a better understanding of both ATP-dependent and ATP-independent mechanisms of insulin release is necessary to facilitate development of new drug therapies for this common disease.
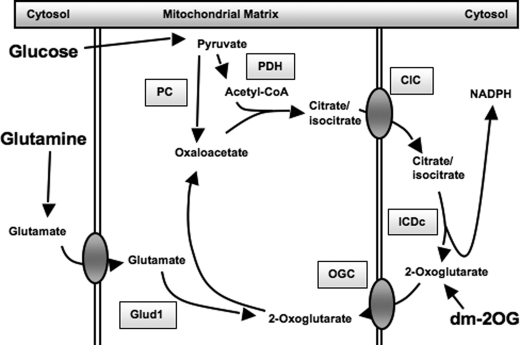
Significant evidence has accumulated in recent years in support of pyruvate cycling pathways as mediators of ATP-independent control of insulin secretion (reviewed in Ref. 8). Pyruvate cycling is initiated by anaplerotic entry of pyruvate into the tricarboxylic acid cycle through pyruvate carboxylase, leading to efflux of citrate, isocitrate, and malate from the mitochondria to the cytosol (7, 8, 10–15). Once in the cytosol, these metabolic intermediates can be reconverted into pyruvate through several pyruvate cycling pathways (8). The pyruvate/malate cycle involves export of mitochondrial malate into the cytosol through the dicarboxylate carrier, followed by reconversion of malate into pyruvate via malic enzyme. The pyruvate/citrate cycle involves export of mitochondrial citrate and isocitrate into the cytosol via the citrate/isocitrate carrier (CIC),3 followed by reconversion of these substrates into pyruvate via citrate lyase and malic enzyme. This pathway can also lead to fatty acid synthesis (involving citrate lyase, acetyl-CoA carboxylase, and fatty-acid synthase). Finally, the pyruvate/isocitrate cycling pathway (refer to Fig. 7) involves direct conversion of cytosolic isocitrate into α-ketoglutarate (also known as 2-oxoglutarate, 2OG) through the NADP-dependent form of isocitrate dehydrogenase (ICDc) but with unknown fates of 2OG terminal to the ICDc reaction (14).
FIGURE 7.
Schematic overview of the pyruvate/isocitrate cycle and OGC, important components of the pathway regulating glucose- and glutamine-stimulated insulin secretion. The enzymes and transporters involved in pyruvate/isocitrate cycling are shown: pyruvate carboxylase (PC), pyruvate dehydrogenase (PDH). Glutamate dehydrogenase (Glud1) is also shown, along with the metabolic entry points for glucose, glutamine, and dimethyl-2-oxoglutarate (dm-2OG).
Work from our laboratory has revealed that flux through the pyruvate/malate or pyruvate/citrate cycles does not play a major role in regulating insulin release (16, 17). Instead, suppression of cytosolic NADP-dependent ICDc, a key enzyme in the pyruvate/isocitrate cycle, significantly impairs insulin secretion (14). Two products of the ICDc reaction are cytosolic NADPH and 2OG, and both of these metabolites have been suggested to function as ATP-independent coupling factors for insulin secretion (7, 8, 18, 19). Consistent with this idea, the most potent fuel secretagogues (including glucose, glutamine, and α-ketoisocaproate) are all capable of generating 2OG. For example, stimulation of β-cells with glutamine plus leucine (leucine is an activator of glutamate dehydrogenase) results in direct conversion of glutamate to 2OG within the mitochondria and robust insulin secretion (20). However, the contribution of 2OG metabolism to insulin secretion, either via direct influence as a coupling factor or maintenance of flux through various pyruvate cycling pathways, remains to be determined. Similarly, although there is a strong correlation between NADPH generation and GSIS (14, 18, 21), and one study that has demonstrated an effect of NADPH to stimulate insulin granule exocytosis when added to permeabilized islets (18), direct evidence that NADPH is required for GSIS is lacking, and the potential role of this cofactor in regulating insulin secretion in response to non-glucose fuels remains largely unexplored.
One of the possible metabolic fates of 2OG generated in the cytosol by ICDc could be transport into the mitochondria for engagement in a variety of mitochondrial pathways. The mitochondrial 2OG carrier (OGC, SLC25A11) is part of an ∼50-member family (in humans) of mitochondrial transporters that includes the citrate/isocitrate carrier (CIC), the dicarboxylate carrier (DIC), and uncoupling proteins (22). These proteins share three tandemly repeated ∼100 amino acid peptide domains and are responsible for the facilitated diffusion of solutes across the mitochondrial inner membrane. The OGC is an electroneutral bi-directional antiporter, capable of transporting both 2OG and malate simultaneously in opposite directions, either into or out of the mitochondrial matrix (23, 24).
In this study, we assessed the role of the OGC in 2OG transport and in the regulation of insulin release in response to several different metabolic fuels. Overexpression and gene knockdown experiments were used to test the hypothesis that 2OG transport through the OGC is necessary for proper regulation of insulin secretion in response to various fuel substrates. We also investigated the effects of carrier suppression on cell metabolism, including ATP and NADPH production after stimulation with glucose or glutamine. Our results indicate that OGC is part of a common pathway of reactions necessary for insulin secretion in response to multiple fuel substrates.
EXPERIMENTAL PROCEDURES
Reagents
All reagents were purchased from Sigma, unless otherwise stated.
Adenovirus Construction and Purification
For overexpression of OGC, the OGC gene was first amplified from rat 832/13 β-cell cDNA with the SuperScriptTM III one-step RT-PCR system with Platinum Taq® high fidelity (Invitrogen) using the forward primer AATC GAATTC CAA AGC CGA GGG CCA TCA AG containing an EcoRI restriction site and 4-base leader sequence and reverse primer AATC AAGCTT TGG AAA CCC TGG CAC ACG AG containing a HindIII restriction site and 4-base leader sequence. The PCR product (1020 bases) was then cloned into the EcoRI/HindIII double-digested pAC.CMV plasmid to construct the adenovirus AdCMV-OGC, as described previously (25). For suppression of OGC, oligonucleotides containing the target sequences GCA ATT CTT GCT GGA CTC A or CTA GCA TCC TGA AGG CAG A were used to generate recombinant adenoviruses Ad-siOGC#1 and Ad-siOGC#2, respectively, by methods described previously (26, 27). We cloned the annealed OGC oligonucleotides directly into the BglII and HindIII sites of plasmid FF805, an EH006-derived (26) RNA interference plasmid that contains the human H1 RNA promoter, followed by unique BglII and HindIII sites. To create FF805, a BglII site in the EH006 backbone was destroyed by digestion with BglII, extension with Taq polymerase, and religation. A 232-bp EcoRI/HindIII fragment from pSUPER (26) containing the H1 RNA interference expression cassette was then inserted, followed by insertion of unique BglII/HindIII cloning sites (annealed oligonucleotides GAT CTG CGT TTA AAC GGA and AGC TTC CGT TTA AAC GCA). Adenovirus-mediated suppression of cytosolic ICDc was accomplished with a previously described Ad-siICDc adenovirus (14). An adenovirus expressing an siRNA with no known homology (containing the sequence GAG ACC CTA TCC GTG ATT A) was used as control for all siRNA experiments (Ad-siControl). All adenoviruses were purified by the CsCl gradient, and titer was determined by measuring absorbance followed by the plaque formation assay (25).
Tissue Culture
The 832/13 β-cell line (28), derived from INS-1 insulinoma cells (29), was used for these studies. Cells were cultured in RPMI 1640 medium, with modifications as described previously (28), treated with purified viruses or siRNA duplexes, and stimulated with 2 mm glucose, 12 mm glucose, 12 mm glutamine, or 12 mm glutamine + 6 mm 2-amino-2-norbornane carboxylic acid (BCH) in insulin secretion assays (14–17).
Islet Experiments
Pancreatic islets were isolated from Sprague-Dawley rats, cultured, and used as described previously (14–17). Insulin secretion studies were conducted in the presence of 2 mm glucose, 12 mm glucose, 12 mm glutamine, or 12 mm glutamine + 12 mm BCH. Insulin release from cells or islets was quantified by the Coat-a-Count radioimmunoassay kit (Siemens, Malvern, PA) (28).
Real Time PCR
RNA was isolated from 832/13 cells using the Qiagen RNeasy mini kit (Qiagen, Germantown, MD) or from islets using the RNeasy micro kit, and reverse transcribed using the iScript cDNA synthesis kit (Bio-Rad). Real time PCR was performed for OGC expression using iTAQ SYBR Green supermix with ROX (Bio-Rad), containing 100 nm forward primer AAA GCC CTG ATT GGC ATG AC and reverse primer ATG GAA GCA GCA GTG GTG AC. Cyclophilin B was used as an internal loading control because its expression levels (CT values) closely matched that of OGC, and its expression did not change with any of the treatments used. Cyclophilin B was amplified using forward primer CGG ACA GCC GGG ACA A and reverse primer TTC GAT CTT GCC ACA GTC TAC AA. Measurements were performed on an ABI Prism 7000 sequence detection system (Applied Biosystems Inc., Foster City, CA).
Immunoblot Analysis
Rabbit antisera against the rat OGC peptide fragment IQNMRMIDGKPEYKN was generated by Antagene, Inc. (Mountain View, CA). For immunoblotting, mitochondria were isolated from 832/13 cells using the mitochondria isolation kit for cultured cells (Thermo Fisher Scientific, Inc., Waltham, MA) and lysed in CelLyticTM M cell lysis reagent (Sigma) using three freeze-thaw cycles. 50 μg of protein per sample was separated on a 10% BisTris gel, transferred to a polyvinylidene difluoride membrane, blocked in Tris-buffered saline plus 2% fat-free powdered milk for 1 h at room temperature, and incubated overnight at 4 °C in anti-OGC antisera diluted 1:1000 in Tris-buffered saline plus 0.05% Tween® 20 and 1% polyvinylpyrrolidone. Blots were washed, incubated in secondary anti-rabbit antibody (Sigma), and bands visualized using the ECL detection system (GE Healthcare) on a VersaDoc 4000 imaging system (Bio-Rad). Results were normalized to the expression of VDAC-1 (mouse monoclonal Ab14734, Abcam, Cambridge, MA), a commonly used mitochondrial specific loading control protein.
2-Oxoglutarate Carrier Assay
The plasma membranes of 832/13 cells were permeabilized with 100 mm KCl, 22 mm NaCl, 10 mm K-HEPES, 1 mm MgCl2, 5 mm KHCO3 plus the hemolytic reagent saponin (final concentration 26 μg/ml) (“permeabilization buffer”), for 25 min at room temperature (15). Cell pellets were then washed twice in permeabilization buffer without saponin and incubated at 37 °C in permeabilization buffer plus 12 mm glutamic acid, 1 mm malic acid, and 6 mm BCH. Conversion of glutamate to 2OG led to transport out of the mitochondria at a rate dependent on the amount of OGC present in the mitochondrial membrane. After 45 min, supernatant containing newly generated 2OG was removed and combined with isocitrate dehydrogenase reaction buffer (40 mm MgCl2, 35 mm NaHCO3, 100 mm Na-HEPES, 10% glycerol, 80 μm NADPH, and 0.25 units/reaction NADP-dependent isocitrate dehydrogenase enzyme (Sigma)), based on the conditions described for isocitrate dehydrogenase enzymatic assays (30). In this way, OGC transporter activity was measured indirectly via the change in absorbance at 340 nm as NADPH was consumed by NADP-dependent isocitrate dehydrogenase.
Metabolic Assays
Glucose usage (glycolytic flux) was determined by incubation in 2 or 12 mm glucose with 0.06 Ci/mol [5-3H]glucose (GE Healthcare) added as tracer, as described previously (31). Glucose oxidation and glutamine oxidation were measured using a CO2 trapping system (32) with either 0.5 Ci/mol d-[U-14C]glucose or 0.1 Ci/mol [U-14C]glutamine as tracer, respectively. Data were corrected for trapping efficiency, as determined using [14C]sodium bicarbonate. Cell viability and general mitochondrial function were determined using the CellTiter 96® proliferation assay (methanethiosulfonate ethylammonium assay, Promega, Madison, WI). ATP and ADP were measured using a luciferase-based ATP assay (Sigma), as described previously (15, 33). Finally, NADP+ and NADPH were measured as described previously (21).
Statistical Methods
For some of these experiments, multifactorial analysis of variance was performed to evaluate the main effects of treatment conditions and interactions. Student's t test was used for individual comparisons between treatments (p < 0.05). Data are presented as mean ± S.E., for n ≥3 separate experiments.
RESULTS
Effects of OGC Suppression and Overexpression on Glucose-stimulated Insulin Secretion in 832/13 β-Cells
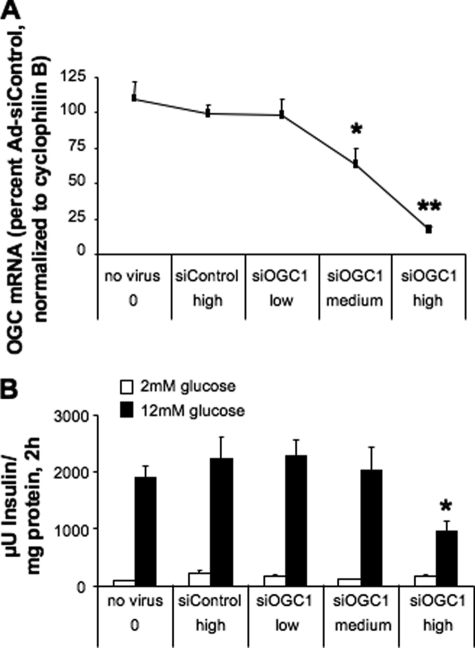
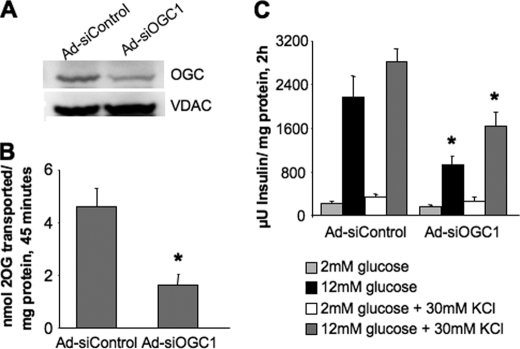
To investigate the role of 2OG transport in insulin secretion, we began by constructing two recombinant adenoviruses containing unique siRNA sequences targeting OGC, Ad-siOGC#1 and Ad-siOGC#2. Treatment of 832/13 β-cells with Ad-siOGC#1 resulted in a dose-dependent decrease in OGC mRNA levels, as determined by quantitative real time PCR. At the highest dose of Ad-siOGC#1, OGC RNA expression was suppressed by 83 ± 6% (p < 0.001), as compared with treatment with Ad-siControl (which contains an siRNA with no homology to known RNA sequences), matched with the highest viral dose of Ad-siOGC#1 (Fig. 1A). At this dose, Ad-siOGC#1 decreased GSIS by 56.8 ± 10.7% (p < 0.05) (Fig. 1B). Similar effects were observed after treatment with Ad-siOGC#2, which caused a 71 ± 10% (p < 0.01) suppression of OGC RNA expression corresponding with a 48.0 ± 14.3% (p < 0.05) reduction in GSIS (data not shown). Suppression of the OGC using Ad-siOGC#1 also resulted in a 52.7 ± 4.3% decrease (p < 0.001) in OGC protein expression, as determined by immunoblot analysis (Fig. 2A). To determine whether this decrease in OGC protein was accompanied by a loss of OGC function, the plasma membrane of target cells was selectively permeabilized by light saponin treatment, and the rate of 2OG production and transport was measured as described under “Experimental Procedures.” OGC knockdown resulted in a 65 ± 10% decrease (p < 0.01) in the rate of 2OG production and transport out of the mitochondria compared with control cells (Fig. 2B).
FIGURE 1.
Effects of OGC suppression on GSIS in 832/13 cells. Expression of OGC was suppressed in 832/13 cells using Ad-siOGC#1 in a dose-dependent manner. A, low, medium, and high doses of Ad-siOGC#1 adenovirus (5, 25, and 50 plaque-forming units of virus/cell, respectively) dose-dependently reduced OGC RNA relative to both a no virus control and cells treated with the Ad-siControl virus. B, effects of Ad-siOGC#1 on OGC expression corresponded with decreased glucose-stimulated insulin secretion. Data represent the mean ± S.E. for three independent experiments. *, p < 0.05, **, p < 0.01 as compared with Ad-siControl.
FIGURE 2.
Effects of OGC suppression on protein expression, transporter activity, and KCl-stimulated insulin secretion. Expression of OGC was suppressed in 832/13 cells using the highest dose of Ad-siOGC#1 described in Fig. 1. Ad-siOGC#1 decreased OGC protein expression (A) and OGC transporter activity (B). C, GSIS in the presence or absence of KCl was measured to identify metabolic versus nonmetabolic effects on secretion. Comparisons were made between Ad-siControl and Ad-siOGC#1 for each stimulation condition. Data for B and C represent the mean ± S.E. for three and four independent experiments, respectively. *, p < 0.05 as compared with Ad-siControl. VDAC, voltage-dependent anion-selective channel protein-1.
To determine whether the effects of OGC suppression on GSIS were due to metabolic or nonmetabolic effects, insulin secretion was measured in the presence or absence of a depolarizing concentration of KCl (30 mm). OGC suppression resulted in a 42.6 ± 9.5% (p < 0.05) reduction in insulin secretion in response to high glucose + KCl, whereas no differences were observed at low glucose + KCl (Fig. 2C). These results demonstrate a lack of effect of OGC on nonmetabolic secretion machinery (assessed at low glucose + KCl) and suggest that OGC suppression specifically interferes with signals generated by fuel metabolism.
To test the converse manipulation to siRNA-mediated knockdown of OGC, a recombinant adenovirus was constructed and used to overexpress the rat OGC in 832/13 β-cells and isolated islets. Despite a 10-fold increase in OGC RNA, a 4-fold increase in protein expression and OGC transport activity in the 832/13 β-cells, and a 10-fold increase in OGC RNA in rat islets, no effects on glucose-stimulated insulin secretion were observed in either cellular context (data not shown). The lack of effect of OGC overexpression on GSIS could be explained by endogenous expression of OGC at levels that are not rate-limiting for pyruvate/isocitrate cycling, such that more expression had no impact on overall cycling activity.
Effects of OGC Suppression on β-Cell Metabolism during GSIS
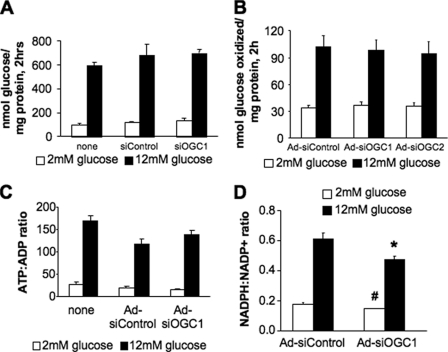
To determine whether the effects of OGC suppression on GSIS were due to general alterations in metabolism, we next measured glucose usage, glucose oxidation, and changes in the ratio of ATP:ADP. Suppression of the OGC in 832/13 β-cells had no effects on glucose usage (Fig. 3A), glucose oxidation (Fig. 3B), or cell viability as determined by methanethiosulfonate ethylammonium assay (data not shown). Additionally, the increase in ATP:ADP observed in response to glucose stimulation in the Ad-siOGC#1-treated cells was not significantly different from that seen in Ad-siControl-treated cells (Fig. 3C).
FIGURE 3.
Effects of OGC suppression on glucose oxidation, glucose usage, ATP production, and NADPH generation. The OGC was suppressed in 832/13 cells, and the effects on metabolic parameters were determined. A, glucose usage (glycolytic flux) was measured from cells treated with siOGC1 and compared with cells either left untreated or transfected with siControl duplexes. B, glucose oxidation was measured after treatment with Ad-siOGC#1 or Ad-siOGC#2 and compared with oxidation in cells treated with Ad-siControl. C, ATP:ADP ratio at 2 and 12 mm glucose, in cells treated with Ad-siOGC#1, compared with a no virus control and the Ad-siControl. D, NADPH:NADP+ ratio at 12 versus 2 mm glucose. Data represent the mean ± S.E. of four, three, three, and four independent experiments, respectively. #, p < 0.01, and *, p < 0.05 as compared with low glucose and high glucose Ad-siControl, respectively.
Although no differences were observed in general metabolic function after suppression of the OGC, we reasoned that reduced 2OG transport could alter flux through the pyruvate/isocitrate cycling pathway. Suppression of two components of the pyruvate/isocitrate pathway, cytosolic ICDc or the CIC have previously been shown to decrease the production of NADPH in concert with suppression of GSIS (14, 15). Here, suppression of OGC resulted in a 23.0 ± 7.0% (p < 0.05) reduction in the ratio of NADPH:NADP+ after stimulation with glucose (Fig. 3D). These results are consistent with the idea that the OGC is an integral component of a cyclic pyruvate/isocitrate pathway that generates NADPH in the ICDc reaction.
Suppression of either OGC or ICDc Reduces Glutamine-stimulated Insulin Secretion
To determine whether other fuel secretagogues besides glucose share the same mechanism for stimulating insulin release and to more thoroughly investigate the role of 2OG metabolism and transport in insulin secretion, glutamine-stimulated insulin secretion was investigated in 832/13 β-cells.
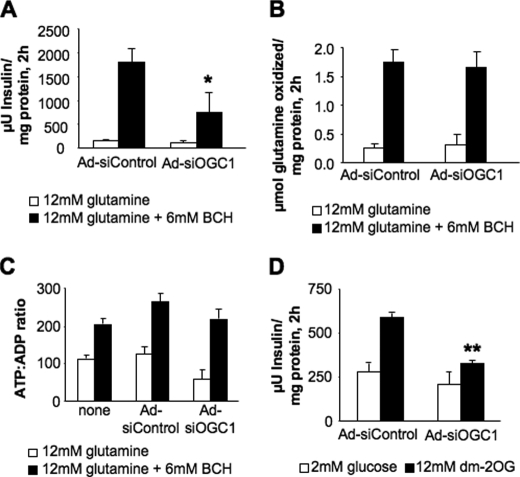
First, we suppressed expression of OGC using Ad-siOGC#1, resulting in a 59 ± 14% (p < 0.05) decrease in insulin secretion in response to glutamine + the glutamate dehydrogenase activator BCH (Fig. 4A). Suppression of OGC had no effect on glutamine oxidation (Fig. 4B). Although the ratio of ATP:ADP was decreased slightly by Ad-siOGC#1 under both basal and stimulatory conditions relative to the control (Fig. 4C), the difference was not statistically significant, and OGC suppression also inhibited insulin release in response to a third secretagogue, dimethyl-2-oxoglutarate, a plasma membrane-permeable analog of 2OG, by 47.1 ± 8.2% (Fig. 4D). These results provide evidence that transport of 2OG into the mitochondria is an important component of a common pathway that mediates insulin secretion in response to glucose, an organic acid (2OG), and an amino acid (glutamine) in the 832/13 insulinoma cell line.
FIGURE 4.
Effects of OGC suppression on glutamine-stimulated insulin secretion and metabolism, and DM-2OG-stimulated insulin secretion. The effects of OGC suppression on glutamine-stimulated insulin secretion and metabolism were determined. A, glutamine-stimulated insulin secretion; B, glutamine oxidation; C, ATP:ADP ratio in the presence of glutamine alone or glutamine + BCH. D, DM (dm)-2OG-stimulated insulin secretion after OGC suppression. Data represent the mean ± S.E. for three to eight independent experiments per panel. *, p < 0.05; **, p < 0.01 as compared with Ad-siControl.
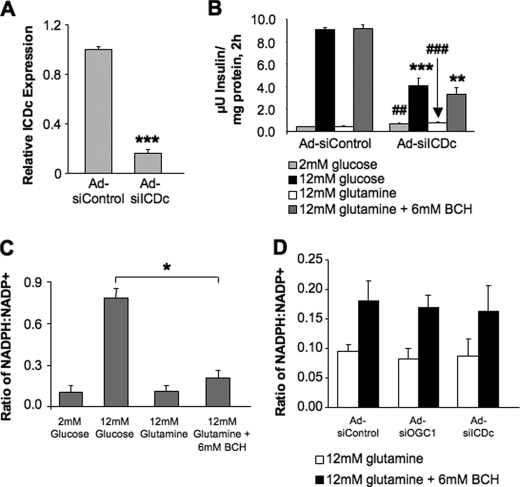
Next, we examined the effects of ICDc suppression on glutamine-stimulated insulin secretion, reasoning that if glutamine-stimulated insulin secretion also involves flux through the pyruvate/isocitrate cycling pathway, suppression of ICDc should impair the secretory response to the amino acid, just as it does to glucose (14). Incubation of 832/13 cells with glutamine plus BCH resulted in robust insulin secretion comparable with the effects observed with stimulatory glucose, and siRNA-mediated suppression of ICDc (Fig. 5A) dramatically reduced both GSIS and glutamine-stimulated secretion to equal extents (Fig. 5B). These results suggest that glucose and glutamine act as secretagogues via flux through a common metabolic pathway that includes ICDc and OGC.
FIGURE 5.
Effects of OGC and ICDc suppression on NADPH:NADP ratio during glucose- and glutamine-stimulated insulin secretion. The cytosolic NADP-dependent enzyme ICDc was suppressed in 832/13 cells, and the effects on glutamine-stimulated insulin secretion were measured. A, expression of ICDc as determined by real time PCR. B, effects of ICDc suppression on insulin secretion after stimulation with glucose or glutamine + BCH. C, NADPH:NADP+ ratio in 832/13 β-cells stimulated with low glucose, high glucose, glutamine alone, and glutamine + BCH. D, NADPH:NADP ratio during glutamine-stimulated insulin secretion, following treatment of cells with Ad-siControl, Ad-siOGC#1, or Ad-siICDc. Data represent the mean ± S.E. for three independent experiments for each panel. ##, p < 0.01, and ###, p < 0.001; *, p < 0.05; **, p < 0.01; ***, p < 0.001 as compared with low glucose and high glucose Ad-siControl, respectively.
The similar effects of OGC and ICDc suppression on insulin secretion in response to multiple fuel secretagogues suggested altered signaling through the pyruvate/isocitrate cycling pathway. Therefore, NADPH production was measured during glutamine + BCH stimulation. However, in contrast to glucose, which caused a 7.3-fold increase in NADPH:NADP ratio, stimulation of β-cells with glutamine + BCH caused only a doubling of this ratio relative to glutamine alone (Fig. 5C). Moreover, neither ICDc nor OGC suppression affected the NADPH:NADP ratio during stimulation with glutamine + BCH relative to cells treated with Ad-siControl (Fig. 5D).
Insulin Secretion in Islets after Suppression of OGC
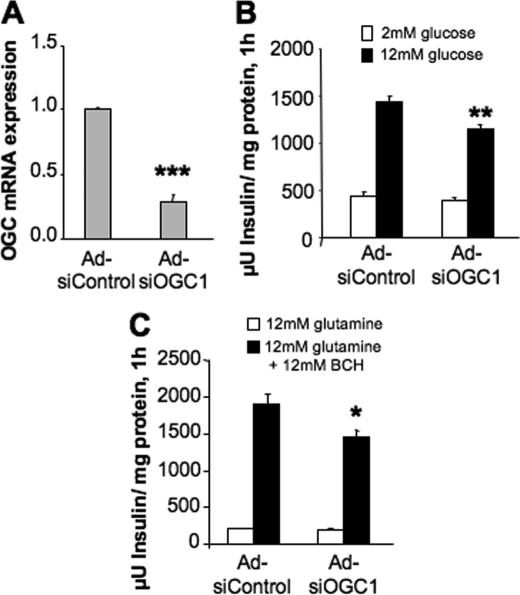
To investigate whether the effects of OGC suppression on glucose- and glutamine-stimulated insulin secretion translated to primary cells, OGC knockdown experiments were performed in isolated rat islets. Treatment of rat islets with Ad-siOGC#1 resulted in a 71 ± 5% (p < 0.001) decrease in OGC RNA as compared with Ad-siControl-treated islets (Fig. 6A). Under these conditions, GSIS was reduced by 20 ± 5% (p < 0.01) (Fig. 6B), and insulin secretion in response to glutamine + BCH was reduced by 23 ± 7% (p < 0.05) (Fig. 6C).
FIGURE 6.
Effects of OGC suppression in rat pancreatic islets. OGC was suppressed in isolated rat pancreatic islets. A, OGC mRNA expression after treatment with Ad-siOGC. B, GSIS; C, glutamine-stimulated insulin secretion after OGC suppression. Data represent the mean ± S.E. of five, five, and four independent experiments, respectively. *, p < 0.05; **, p < 0.01; ***, p < 0.001 as compared with Ad-siControl.
DISCUSSION
In this study, we investigated the role of 2OG transport in fuel-stimulated insulin secretion from pancreatic β-cells, using adenovirus transduction to transiently overexpress or suppress expression of the mitochondrial 2-oxoglutarate carrier (OGC). Suppression of OGC using two unique siRNA targeting sequences resulted in a significant reduction in GSIS. Insulin release under conditions of low glucose plus a depolarizing concentration of KCl was unchanged by OGC knockdown, whereas insulin secretion was impaired in the presence of stimulatory glucose or high glucose + KCl, demonstrating that the carrier plays an important role in metabolic regulation of GSIS. Suppression of OGC did not affect rates of glucose usage or glucose oxidation, cell viability, or glucose-stimulated increases in the ATP:ADP ratio, indicating that the effects of OGC on insulin secretion were mediated by metabolic events independent of the canonical KATP channel-dependent pathway of GSIS. Overexpression of OGC failed to alter GSIS from either clonal β-cells or isolated rat islets, indicating that flux through the carrier under normal conditions is likely not a rate-limiting step in metabolism.
Our data suggest two possible conclusions in terms of glucose-regulated insulin release. First, decreased OGC transporter activity may lower 2OG levels in either the cytosolic or mitochondrial compartments, thereby abrogating any signaling role the molecule might be playing in GSIS. Alternatively, our findings may indicate a need for continuous flux of 2OG through the OGC to sustain the pyruvate/isocitrate cycling pathway, which in turn plays an essential role in GSIS.
To address these questions, both glutamine-stimulated insulin secretion and dimethyl (DM)-2OG-stimulated insulin secretion were measured after OGC suppression. Glutamine directly generates 2OG in the mitochondria via glutamate dehydrogenase activity. In contrast, stimulation of cells with DM-2OG is expected to generate cytosolic 2OG. Suppression of OGC reduced insulin secretion in response to both secretagogues. We assume that DM-2OG becomes demethylated in the cytosol, and if this assumption is correct, our results indicate that replenishment of cytosolic 2OG does not overcome the effects of OGC suppression on insulin secretion. Instead, our results are consistent with a model in which the effect of OGC suppression is explained by a requirement for continued operation of the entire pyruvate/isocitrate cycle. The effect of ICDc suppression to block glutamine-stimulated insulin secretion is also consistent with this model (Fig. 7).
Our studies also provide fresh insight into the role of two putative stimulus-secretion coupling factors in fuel-stimulated insulin secretion, NADPH and α-ketoglutarate (2OG). Multiple lines of evidence have suggested that NADPH may function as a signaling molecule in the β-cell (7, 8). Consistent with this idea, we found a significant reduction in glucose-stimulated NADPH production in response to OGC suppression, similar to effects observed previously in response to suppression of ICDc or CIC (14, 15). However, no such changes were observed in response to OGC or ICDc suppression during glutamine-stimulated insulin secretion. Also, substantially less NADPH was produced during stimulation of cells with glutamine + BCH as compared with stimulation with glucose, resulting in a lower NADPH:NADP+ ratio in the former case despite comparable insulin secretion for both secretagogues. Thus, either NADPH is not a key stimulus-secretion coupling factor for insulin secretion or it functions in this role only during glucose stimulation and not during stimulation with glutamine.
Alternatively, 2OG, which is also produced by ICDc in the pyruvate/isocitrate cycling reactions, has been suggested as a potential coupling factor in insulin secretion (19). This is based on the finding that the transamination product of leucine, α-ketoisocaproate, which serves as an activator of glutamate dehydrogenase (Glud1), elicits a dramatic insulin secretion response in insulin-resistant and hyperinsulinemic BTBR mice but not in normoinsulinemic B6 mice. BTBR islets have higher glutamate content than B6 islets and are therefore postulated to be more effective at generating 2OG. When islets from either mouse strain are stimulated with dimethyl glutamate plus α-ketoisocaproate, which would make both groups equally effective at producing 2OG, insulin secretion (normalized to content) is equivalent (19).
2OG could regulate β-cell insulin secretion by serving as a substrate for α-ketoglutarate hydroxylases, which modify proline residues on hypoxia-inducible transcription factors and possibly other substrates, promoting their degradation and inactivation (34). Consistent with this idea, acute inhibition of α-ketoglutarate hydroxylases causes impairment of insulin secretion in response to glucose or glutamine + leucine (35). In this study, DM-2OG was able to stimulate insulin secretion above 2 mm glucose, but interestingly, knockdown of OGC caused a significant impairment of this response (Fig. 4D). These findings suggest that transport of 2OG from the cytosol to the mitochondria is a key event in control of insulin secretion, implying that a by-product of the pyruvate/isocitrate cycle other than cytosolic 2OG serves as a key mediator of GSIS. One possible candidate is GTP produced by succinate dehydrogenase in the mitochondria (36). Further studies will be required to clarify these issues.
In sum, this study provides support for a key role of the OGC transport step in fuel-regulated insulin secretion. Our work demonstrates a role for this carrier not only in GSIS but also in glutamine-stimulated insulin secretion. Our data also suggest that one of the by-products generated by pyruvate/isocitrate cycling, NADPH, is not the universal signal for fuel-stimulated insulin secretion, because glutamine-stimulated insulin secretion occurs despite only small changes in NADPH:NADP+ ratio. Our findings show instead that the pyruvate/isocitrate pathway as a whole must remain intact for appropriate stimulus-secretion coupling. Thus, although a common metabolic pathway for fuel-stimulated insulin secretion has been identified, the precise identity of the coupling factors that it generates will require further investigation.
Acknowledgments
We thank Dr. Michelle Arlotto and Charles Ramsey for their assistance with immunoblot analysis and real time PCR and Helena Winfield for assistance in isolating islets.
This work was supported in part by National Institutes of Health Grants DK-42583 and DK-58398 (to C. B. N.). This work was also supported by a Canadian Institute of Health Research grant (to J. W. J.).
- CIC
- citrate/isocitrate carrier
- GSIS
- glucose-stimulated insulin secretion
- 2OG
- 2-oxoglutarate
- OGC
- 2-oxoglutarate carrier; dicarboxylate carrier
- BCH
- 2-amino-2-norbornane carboxylic acid
- PC
- pyruvate carboxylase
- ICDc
- cytosolic isocitrate dehydrogenase
- siRNA
- small interfering RNA
- BisTris
- 2-[bis(2-hydroxyethyl)amino]-2-(hydroxymethyl)propane-1,3-diol
- DM
- dimethyl.
REFERENCES
- 1.Ashcroft F. M., Harrison D. E., Ashcroft S. J. (1984) Nature 312, 446–448 [DOI] [PubMed] [Google Scholar]
- 2.MacDonald P. E., Joseph J. W., Rorsman P. (2005) Philos. Trans. R. Soc. Lond. B Biol. Sci. 360, 2211–2225 [DOI] [PMC free article] [PubMed] [Google Scholar]
- 3.Bryan J., Crane A., Vila-Carriles W. H., Babenko A. P., Aguilar-Bryan L. (2005) Curr. Pharm. Des. 11, 2699–2716 [DOI] [PubMed] [Google Scholar]
- 4.Newgard C. B., Matschinsky F. M. (2001) in Handbook of Physiology (Jefferson L. S., Cherrington A. eds) pp. 125–152, Oxford University Press, Oxford [Google Scholar]
- 5.Henquin J. C. (2000) Diabetes 49, 1751–1760 [DOI] [PubMed] [Google Scholar]
- 6.Gembal M., Gilon P., Henquin J. C. (1992) J. Clin. Invest. 89, 1288–1295 [DOI] [PMC free article] [PubMed] [Google Scholar]
- 7.MacDonald M. J., Fahien L. A., Brown L. J., Hasan N. M., Buss J. D., Kendrick M. A. (2005) Am. J. Physiol. Endocrinol. Metab. 288, E1–E15 [DOI] [PubMed] [Google Scholar]
- 8.Jensen M. V., Joseph J. W., Ronnebaum S. M., Burgess S. C., Sherry A. D., Newgard C. B. (2008) Am. J. Physiol. Endocrinol. Metab. 295, E1287–E1297 [DOI] [PMC free article] [PubMed] [Google Scholar]
- 9.Muoio D. M., Newgard C. B. (2008) Nat. Rev. Mol. Cell. Biol. 9, 193–205 [DOI] [PubMed] [Google Scholar]
- 10.Schuit F., De Vos A., Farfari S., Moens K., Pipeleers D., Brun T., Prentki M. (1997) J. Biol. Chem. 272, 18572–18579 [DOI] [PubMed] [Google Scholar]
- 11.Lu D., Mulder H., Zhao P., Burgess S. C., Jensen M. V., Kamzolova S., Newgard C. B., Sherry A. D. (2002) Proc. Natl. Acad. Sci. U.S.A. 99, 2708–2713 [DOI] [PMC free article] [PubMed] [Google Scholar]
- 12.Boucher A., Lu D., Burgess S. C., Telemaque-Potts S., Jensen M. V., Mulder H., Wang M. Y., Unger R. H., Sherry A. D., Newgard C. B. (2004) J. Biol. Chem. 279, 27263–27271 [DOI] [PubMed] [Google Scholar]
- 13.Cline G. W., Lepine R. L., Papas K. K., Kibbey R. G., Shulman G. I. (2004) J. Biol. Chem. 279, 44370–44375 [DOI] [PubMed] [Google Scholar]
- 14.Ronnebaum S. M., Ilkayeva O., Burgess S. C., Joseph J. W., Lu D., Stevens R. D., Becker T. C., Sherry A. D., Newgard C. B., Jensen M. V. (2006) J. Biol. Chem. 281, 30593–30602 [DOI] [PubMed] [Google Scholar]
- 15.Joseph J. W., Jensen M. V., Ilkayeva O., Palmieri F., Alárcon C., Rhodes C. J., Newgard C. B. (2006) J. Biol. Chem. 281, 35624–35632 [DOI] [PubMed] [Google Scholar]
- 16.Joseph J. W., Odegaard M. L., Ronnebaum S. M., Burgess S. C., Muehlbauer J., Sherry A. D., Newgard C. B. (2007) J. Biol. Chem. 282, 31592–31600 [DOI] [PubMed] [Google Scholar]
- 17.Ronnebaum S. M., Jensen M. V., Hohmeier H. E., Burgess S. C., Zhou Y. P., Qian S., MacNeil D., Howard A., Thornberry N., Ilkayeva O., Lu D., Sherry A. D., Newgard C. B. (2008) J. Biol. Chem. 283, 28909–28917 [DOI] [PMC free article] [PubMed] [Google Scholar]
- 18.Ivarsson R., Quintens R., Dejonghe S., Tsukamoto K., in 't Veld P., Renström E., Schuit F. C. (2005) Diabetes 54, 2132–2142 [DOI] [PubMed] [Google Scholar]
- 19.Rabaglia M. E., Gray-Keller M. P., Frey B. L., Shortreed M. R., Smith L. M., Attie A. D. (2005) Am. J. Physiol. Endocrinol. Metab. 289, E218–E224 [DOI] [PubMed] [Google Scholar]
- 20.Li C., Allen A., Kwagh J., Doliba N. M., Qin W., Najafi H., Collins H. W., Matschinsky F. M., Stanley C. A., Smith T. J. (2006) J. Biol. Chem. 281, 10214–10221 [DOI] [PubMed] [Google Scholar]
- 21.Jensen M. V., Joseph J. W., Ilkayeva O., Burgess S., Lu D., Ronnebaum S. M., Odegaard M., Becker T. C., Sherry A. D., Newgard C. B. (2006) J. Biol. Chem. 281, 22342–22351 [DOI] [PubMed] [Google Scholar]
- 22.Palmieri F. (2004) Pflugers Arch. 447, 689–709 [DOI] [PubMed] [Google Scholar]
- 23.Indiveri C., Palmieri F., Bisaccia F., Krämer R. (1987) Biochim. Biophys. Acta 890, 310–318 [DOI] [PubMed] [Google Scholar]
- 24.Palmieri F., Bisaccia F., Capobianco L., Dolce V., Fiermonte G., Iacobazzi V., Zara V. (1993) J. Bioenerg. Biomembr. 25, 493–501 [DOI] [PubMed] [Google Scholar]
- 25.Becker T. C., Noel R. J., Coats W. S., Gómez-Foix A. M., Alam T., Gerard R. D., Newgard C. B. (1994) Methods Cell Biol. 43, 161–189 [DOI] [PubMed] [Google Scholar]
- 26.Bain J. R., Schisler J. C., Takeuchi K., Newgard C. B., Becker T. C. (2004) Diabetes 53, 2190–2194 [DOI] [PubMed] [Google Scholar]
- 27.Schisler J. C., Jensen P. B., Taylor D. G., Becker T. C., Knop F. K., Takekawa S., German M., Weir G. C., Lu D., Mirmira R. G., Newgard C. B. (2005) Proc. Natl. Acad. Sci. U.S.A. 102, 7297–7302 [DOI] [PMC free article] [PubMed] [Google Scholar]
- 28.Hohmeier H. E., Mulder H., Chen G., Henkel-Rieger R., Prentki M., Newgard C. B. (2000) Diabetes 49, 424–430 [DOI] [PubMed] [Google Scholar]
- 29.Asfari M., Janjic D., Meda P., Li G., Halban P. A., Wollheim C. B. (1992) Endocrinology 130, 167–178 [DOI] [PubMed] [Google Scholar]
- 30.Kanao T., Kawamura M., Fukui T., Atomi H., Imanaka T. (2002) Eur. J. Biochem. 269, 1926–1931 [DOI] [PubMed] [Google Scholar]
- 31.Hughes S. D., Quaade C., Johnson J. H., Ferber S., Newgard C. B. (1993) J. Biol. Chem. 268, 15205–15212 [PubMed] [Google Scholar]
- 32.Kim J. Y., Koves T. R., Yu G. S., Gulick T., Cortright R. N., Dohm G. L., Muoio D. M. (2002) Am. J. Physiol. Endocrinol. Metab. 282, E1014–E1022 [DOI] [PubMed] [Google Scholar]
- 33.Joseph J. W., Koshkin V., Saleh M. C., Sivitz W. I., Zhang C. Y., Lowell B. B., Chan C. B., Wheeler M. B. (2004) J. Biol. Chem. 279, 51049–51056 [DOI] [PubMed] [Google Scholar]
- 34.Ozer A., Bruick R. K. (2007) Nat. Chem. Biol. 3, 144–153 [DOI] [PubMed] [Google Scholar]
- 35.Fallon M. J., MacDonald M. J. (2008) Metabolism 57, 1148–1154 [DOI] [PMC free article] [PubMed] [Google Scholar]
- 36.Kibbey R. G., Pongratz R. L., Romanelli A. J., Wollheim C. B., Cline G. W., Shulman G. I. (2007) Cell Metab. 5, 253–264 [DOI] [PMC free article] [PubMed] [Google Scholar]


