

Abstract
The neuronal nicotinic receptor genes (CHRN) have been implicated in a variety of smoking-related behaviors. Here we tested for association between an early subjective response phenotype, “dizziness,” and 226 SNPs in CHRN genes. The sample included 789 nicotine-dependent cases and 811 controls, where early “dizziness” reports were significantly associated with case/control status (p<0.0001). Multiple SNPs in the putative promoter region of the CHRNB3 gene were nominally associated with “dizziness” experience from the first few cigarettes (p<0.01). Cell culture studies were conducted to examine the ability of different haplotypes in the CHRNB3 promoter to drive luciferase expression. Data from these experiments supports the hypothesis that different alleles in the CHRNB3 upstream promoter region may lead to different levels of RNA expression. In addition, a novel finding of association between SNPs in the CHRNA10 gene reached experiment-wide empirical significance (p=0.048), which implicates another CHRN gene as being involved in early subjective response to tobacco.
Keywords: nicotinic receptors, genetics, subjective effects, tobacco, gene expression, humans
Introduction
Tobacco kills over five million people each year and is a risk factor for six of the eight leading cases of death worldwide (2008). Although the health risks of tobacco are well-known in industrialized nations, smoking prevalence remains at around 20% of the United States adult population (CDC, 2007). It is estimated that cigarette smoking and exposure to tobacco smoke leads to as many as 438,000 early deaths and productivity losses of over $90 billion annually (CDC, 2005). Smoking is a complex behavior mediated by both genetic and environmental factors. Multiple twin studies have provided strong evidence that genetic factors contribute to around 50% of the phenotypic variance for tobacco behaviors (Heath et al., 1998; Hopfer et al., 2001; Swan and Carmelli, 1997; Swan et al., 1997; Young et al., 2006). The identification of genes which contribute to nicotine addiction is important for our understanding of an individual’s unique risk factors and improved understanding of the underlying biology.
The neuronal nicotinic acetylcholine receptor (nAChR) subunit genes (CHRN genes) are strong candidates because nicotine binds to the nAChRs, activating the receptors and initiating a cascade of downstream neurobiological effects. Many nAChRs are expressed on dopaminergic nerve terminals (Grady et al., 2007), which are believed to be key components of the reward pathway involved in addictive behaviors. Several CHRN genes have been associated with tobacco-related phenotypes, including age of initiation (Schlaepfer et al., 2008b), subjective response to tobacco during early experimentation (Ehringer et al., 2007; Zeiger et al., 2008), cigarettes per day (Berrettini et al., 2008), nicotine dependence (Bierut et al., 2007; Greenbaum et al., 2006; Hoft et al., 2008; Li et al., 2005; Saccone et al., 2007; Weiss et al., 2008), and lung cancer (Amos et al., 2008; Hung et al., 2008; Thorgeirsson et al., 2008). The collection of studies strongly suggests the nAChRs are involved in human smoking behaviors, but it remains unclear how different subunits and different receptor subtypes might contribute to different developmental stages of addiction.
In a large candidate gene study by Saccone et al. (2007), variants in the putative promoter region of the CHRNB3 gene emerged as the strongest signal for association with nicotine dependence among a sample of nicotine dependent cases and non-dependent controls. Shortly thereafter, Zeiger et al. (2008), reported associations between early subjective response to tobacco and the CHRNB3/A6 genes in two samples of young adults. Analysis of individual subjective effects items revealed that “dizziness” in the period during early experimentation was a major component driving the association with SNPs in the CHRNB3 gene. The goals of this project were three-fold. First, we tested for an association between a “dizziness” phenotype among adult smokers reporting about how they felt from their first few cigarettes and 17 SNPs in the CHRNB3 promoter region (Saccone et al., in press). Second, we conducted an exploratory analysis of 209 single nucleotide polymorphisms in 15 additional CHRN genes for association with “dizziness.” Furthermore, we conducted functional analysis to examine whether different haplotypes in the CHRNB3 promoter region may lead to differential levels of gene expression.
Materials and Methods
Subjects and Assessments
All subjects (789 cases and 811 controls) were selected from the Collaborative Genetic Study of Nicotine Dependence (COGEND), a US-based European ancestry sample (St Louis, Detroit, and Minneapolis). Details regarding recruitment and phenotypic assessments are in (Bierut et al., 2007; Saccone et al., 2007). Briefly, a personal interview was administered to assess nicotine dependence using the Fagerström Test for Nicotine Dependence (FTND) (Heatherton et al., 1991) and cases were defined by a current FTND score of 4 or more (maximum score of 10). Control subjects were defined as individuals who had smoked at least 100 cigarettes during their lifetime, yet never became dependent (lifetime FTND=0).
In addition to FTND assessment, subjects completed a questionnaire asking them “How would you rate the following from smoking your first few cigarettes?” for eight items: pleasant sensations, unpleasant sensations, nausea, relaxation, dizziness, pleasurable rush or buzz, coughing, and difficulty inhaling. Responses could include 1-none, 2-slight, 3-moderate, or 4-intense.
Genotyping
DNA was extracted from whole blood and EBV transformed cells and was aliquoted and stored frozen at −80°C until distributed to the genotyping labs. Details of the genotyping and quality control for the 226 SNPs have been previously described (Saccone et al., in press). Initial genotyping of the case-control sample was carried out by Perlegen Sciences using custom arrays as previously described by the Nicotine Single Nucleotide Polymorphism (NICSNP) study (Bierut et al., 2007; Saccone et al., 2007). Additional genotyping was then carried out by the Center for Inherited Disease Research using Illumina Golden Gate technology. SNPs in the CHRN genes were selected with these goals. First, SNPs with poor or marginal genotype call rates (<98%), or failed quality control measures described in Bierut et al. (2007) and Saccone et al. (2007) were re-genotyped. Second, r2 bin tag SNPs (Carlson et al., 2004) were selected to improve coverage of the CHRN genes. Third, because of the strong associations with case-control status in the CHRNA5/CHRNA3/CHRNB4 and CHRNB3/CHRNA6 gene clusters, we densely covered these regions for fine-mapping. All SNPs were required to have call rates ≥ 98%, leading to a final analysis set of 226 SNPs (118 newly genotyped by CIDR). Map positions were obtained from the UCSC Genome Browser (genome.ucsc.edu) Human March 2006 Assembly.
Statistical Analysis
To test for a possible role of “dizziness” in mediating tobacco dependence, we examined whether response to this question was associated with case/control status using Chi-square analysis.
For the genetic analysis, our a priori hypothesis focused on the CHRNB3 gene and its possible association with “dizziness,” based on the work published by Zeiger et al. (2008). All statistical analyses were completed using Statistical Analysis Software (SAS) v.9.1. Haplotype blocks and linkage disequilibrium were examined using Haploview v4.1 (Barrett et al., 2005). We conducted a general linear regression analysis for each of the SNPs in the CHRNB3 gene (17), where the “dizziness” score (residual score for 1–4 responses after regression of case status) was the dependent variable predicted by the SNP, with age and sex as covariates.
As a secondary exploratory analysis, we tested whether any of the other CHRN SNPs for which genotyping had been completed might be associated with “dizziness.” A permutation procedure implemented as set-based tests in PLINK (Purcell et al., 2007) was used to obtain empirical p-values for the gene-based tests and experiment-wide p-values for all SNPs (10,000 permutations).
Finally, because previous work using this data set included a sex*genotype interaction term in the regression model (Bierut et al., 2007; Saccone et al., 2007), we repeated the individual SNP analyses with this term included.
Functional analysis of CHRNB3 SNPs
Cloning of SNP alleles into a luciferase reporter-gene plasmid
Human genomic DNA from Promega Corporation was used amplify the putative promoter region of CHRNB3. Amplification was performed using Picomaxx High Fidelity PCR System (Stratagene, LaJolla, CA) with the primers 5′ AGGCTTGACATCCGTTTGTT 3′ and 5′ TCGTGATGTCAGTTTCAGAAAGA 3′ to produce a 2987 bp product. Following PCR, the resulting amplicons were introduced into the vector pCR2.1-TOPO (Invitrogen, Carlsbad, CA) and several independent clones were sequenced to ascertain the genotype of the clones. The inserts were then tranferred into a pGL3-Basic plasmid (Promega Corporation, Madison, WI) for the luciferase assays using Xho I and Hind III restriction enzymes. The shorter constructs were created by digestion of the inserts with Nhe I and Hind III to produce a 1670 bp product.. Figure 2 depicts the two pairs of plasmid constructs representing two different haplotypes for the putative promoter region of the CHRNB3 gene. Three long constructs include approximately 3000 bp of the putative promoter region of CHRNB3 (common, mixed, and minor), while the shorter pairs cover approximately 1500 bp (short common and short minor). Plasmid preparations from bacterial cultures were done using FastPlasmid Mini-prep kit (Eppendorf, Westbury, NY) for small scale DNA preps or the Qiagen Plasmid Maxi Purification Kit (Qiagen) for large scale preps.
Figure 2.

Diagram of CHRNB3 putative promoter region and constructs created for luciferase assays.
Cell culture and transfections
All constructs were tested in HEK293T human embryonic kidney, P19 mouse embryonal carcinoma, and SH-SY5Y human neuroblastoma cells. Cell culture conditions, including growth and maintenance have been carried out as described in Mexal et al. (Mexal et al., 2007). Transfections were carried out by seeding 0.5×10⁶ cells per well in a 24 well plate. The following day cells were transfected using FuGENE® HD tranfection reagent (Roche) with 0.2 ug of the test plasmids. Approximately 5–10ng of a control vector (pRL-CMV; renilla luciferase) was co-transfected to control for transfection efficiency and prevent competition of the test and control plasmids for transcription factor binding SH-SY5Y cells were induced to differentiate by incubation with 75mM all-trans-retinoic acid in addition to normal growth media for 10 days prior to transfection.
Statistical Analyses
Within each experiment for each cell type, luciferase expression levels relative to a renilla control vector were normalized to the control construct, which was set at 1.0. A one-way ANOVA comparing the mean expression of the five constructs (control, common, mixed, minor, short common, and short minor) was conducted using SPSS 16.0. Tukey’s post hoc test was used to determine statistically significant differences between individual pairs of constructs. Secondary ANOVA analysis was conducted using data from only the three long constructs and control.
Results
Descriptive statistics for the cases and controls are presented in Table 1. The mean age of the controls was 35.7±5.5 (S.D.) years and the cases were 36.9±5.3 years, which corresponds to a significant difference (t=4.52, p<0.0001). There were fewer males in the control sample compared to the cases (Χ2=30.7, p<0.0001). There was also a significant association between responses to the “dizziness” item and case/control status (Χ2=42.7, p<0.0001). Table 1 includes response patterns for each group, where case subjects were more likely to endorse “intense” dizziness from smoking their first few cigarettes.
Table 1.
Response patterns in cases and controls for “dizziness” after their first few cigarettes
| Controls | Cases | |
|---|---|---|
| Age | 35.7±5.5 | 36.9±5.3 |
| Males | 250 (30.8%) | 349 (44.2%) |
| Dizzy: None | 216 (26.8%) | 140 (17.9%) |
| Dizzy: Slight | 265 (33.0%) | 225 (28.8%) |
| Dizzy: Moderate | 218 (27.1%) | 228 (29.2%) |
| Dizzy: Intense | 106 (13.2%) | 189 (24.2%) |
The linkage disequilibrium structure of genotyped SNPs in the CHRNB3 gene is presented in Supplementary Figure 1. Haploview 4.1 (Barrett et al., 2005) analysis using the confidence interval algorithm of Gabriel et al. (Gabriel et al., 2002) revealed one major haplotype block spanning the 5′UTR and putative promoter region of the gene.
Linear regression analysis of our a priori hypothesis to examine 17 SNPs in the CHRNB3 gene revealed significant associations between several SNPs and the “dizziness” measure, adjusted for age, sex, and case status (Table 2). Five SNPs (rs10958726, rs1955186, rs1955185, rs13277254, and rs13277524) were nominally significant at p<0.01, and are likely to represent the same signal since they are in high linkage disequilibrium (r2 >0.98). Four other SNPs in the same haplotype block (rs5005909, rs6474412, rs6474413, and rs4950) were significant at the nominal p<0.03, with the minor differences in p-values likely due to slight differences in missing data (see Supplementary Figure 1). The other two SNPs in the haplotype block (rs1530847 and rs13280301) were slightly less common than the others, with no evidence of association (p>0.15). PLINK was used for set-based permutation testing to correct for all 17 SNPs examined in this gene (Purcell et al., 2007). rs1955186 emerged as the SNP with the lowest p value, with a gene-based empirical p=0.021 (Table 3).
Table 2.
Linear regression association results between SNPs in CHRNB3 and “dizziness” (age, sex, and case status included as co-variates)
| CHRNB3 SNP | Location | UCSC position | β estimate | P-value | Minor allele freq | Minor allele |
|---|---|---|---|---|---|---|
| rs5005909 | Upstream | 42647824 | −0.107 | 0.022 | 0.18 | G |
| rs10958726 | Upstream | 42655066 | −0.126 | 0.005 | 0.21 | C |
| rs1530847 | Upstream | 42667396 | −0.057 | 0.275 | 0.15 | G |
| rs1955186 | Upstream | 42668648 | −0.119 | 0.009 | 0.21 | G |
| rs1955185 | Upstream | 42668804 | −0.118 | 0.009 | 0.21 | G |
| rs13277254 | Upstream | 42669139 | −0.121 | 0.007 | 0.21 | G |
| rs13280301 | Upstream | 42669174 | −0.072 | 0.165 | 0.15 | A |
| rs13277524 | Upstream | 42669214 | −0.122 | 0.007 | 0.21 | C |
| rs6474412 | Upstream | 42669655 | −0.111 | 0.014 | 0.21 | G |
| rs6474413 | Upstream | 42670221 | −0.114 | 0.011 | 0.21 | G |
| rs4950 | 5′UTR | 42671790 | −0.116 | 0.010 | 0.21 | G |
| rs7838246 | Intron3 | 42704454 | −0.152 | 0.122 | 0.038 | G |
| rs4952 | Exon5 | 42706222 | −0.151 | 0.123 | 0.038 | A |
| rs4953 | Exon5 | 42706816 | −0.149 | 0.126 | 0.038 | G |
| rs17621256 | Intron5 | 42709065 | −0.159 | 0.136 | 0.031 | A |
| rs7012713 | Downstream | 42711460 | −0.057 | 0.580 | 0.033 | A |
| rs6987323 | Intergenic | 42716389 | −0.169 | 0.068 | 0.042 | C |
Table 3.
Region-based empirical p-values by gene for association with “Dizzy” item (corrected for case status). p-values < 0.05 are italicized in bold. p-value refers to the individual SNP p-value, Set p refers to gene-level p-value, and All sets p refers to individual SNP p-value corrected for all SNPs tested across all genes.
| Chr | Gene | # SNPs | SNP | T | p-value | Set p | All sets p |
|---|---|---|---|---|---|---|---|
| 1 | CHRNB2 | 4* | rs2072660 | 0.109 | 0.945 | 0.954 | 1 |
| 2 | CHRNA1 | 5* | rs7560774 | 1.28 | 0.569 | 0.633 | 1 |
| 2 | CHRND/G | 12 | rs11690038 | 6.654 | 0.059 | 0.081 | 0.672 |
| 4 | CHRNA9 | 10 | rs6823439 | 1.102 | 0.609 | 0.674 | 1 |
| 8 | CHRNA2 | 12 | rs2565065 | 7.089 | 0.052 | 0.074 | 0.617 |
| 8 | CHRNB3 | 17 | rs1955186 | 7.24 | 0.011 | 0.021 | 0.192 |
| 8 | CHRNA6 | 9 | rs9298629 | 2.211 | 0.179 | 0.209 | 0.970 |
| 11 | CHRNA10 | 4 | rs2231532 | 7.986 | 0.002 | 0.007 | 0.048 |
| 15 | CHRNA7 | 41 | rs2133965 | 2.032 | 0.831 | 0.871 | 1 |
| 15 | CHRNA5/A3/B4 | 77 | rs7177514 | 2.539 | 0.551 | 0.640 | 1 |
| 17 | CHRNE | 7 | rs4790235 | 0.959 | 0.814 | 0.856 | 1 |
| 17 | CHRNB1 | 15 | rs2302765 | 2.013 | 0.393 | 0.456 | 0.998 |
| 20 | CHRNA4 | 11 | rs3787140 | 7.621 | 0.011 | 0.020 | 0.192 |
SNPs rs2072658 in CHRNB2 and rs6730111 in CHRNA1 had MAF <0.01 so were not included in the PLINK analysis.
Table 3 summarizes the secondary gene-based analysis of all other SNPs genotyped. Three columns of p-values are provided which were obtained used the permutation procedure implemented in PLINK (Purcell et al., 2007): p-value refers to the individual SNP p-value, Set p refers to gene-level p-value, and All sets p refers to individual SNP p-value corrected for all SNPs tested across all genes. SNPs rs2072658 in CHRNB2 and rs6730111 in CHRNA1 had MAF <0.01 so were not included in the PLINK analysis, leaving a total of 224 SNPs. These exploratory tests revealed significant evidence for association of CHRNA10 (set-based empirical p=0.007) and CHRNA4 (p=0.020) with the “dizziness” item. Only SNPs in CHRNA10 (rs2231532) reached experiment-wide significance when corrected for all SNPs tested (all sets p=0.048, Table 3). Nominal p-values for all SNPs tested are available in Supplementary Table 1. A series of graphs in Figure 1 provide an overview of all SNPs tested by chromosome and gene. Each dot plots the −log (p-value) on the y-axis of individual SNPs along their respective chromosomal positions on the x-axis. The dashed horizontal line at −log(0.01) reflects a for p-value of 0.01.
Figure 1.

Results of association testing for all CHRN SNPs with “dizziness.” Each graph represents a different chromosomal regions and SNPs for individual genes are in different colors. The −log(p-value) for each SNP is plotted on the y-axis with respective physical position of the x-axis. The dashed horizontal line shows −log(0.01) for p=0.01.
In addition, our analysis which included a sex*genotype interaction term revealed suggestive evidence for interaction for nearly all of the SNPs in CHRNB3 and CHRNA10. These data are presented in Supplementary Table 1, with columns for the SNP beta and p-values, and interaction term beta and p-values, in the full model. The initial association appears to be driven by the males, since an analysis of only males yielded similar (slightly stronger) evidence for association, while there was no evidence for an association in the female subgroup.
A Supplementary Table provides all nominal p-values from a linear regression analysis of all SNPs, where one can see corresponding clusters of signals in CHRNA4 and CHRNA10. For comparison, this table also includes results from a previous test of association with nicotine dependence in this same sample (Saccone et al., in press).
Functional analysis of CHRNB3 haplotypes
Five reporter assay plasmid constructs were generated containing the region upstream of the CHRNB3 gene, shown in Figure 2. All of the known SNPs (identified from the Ensembl and UCSC Genome Browsers) are shown, approximately to scale. The top three long inserts consisted of approximately 3000 bp which includes the putative promoter region of CHRNB3. Three different long plasmid constructs, as indicated by the genotype for each SNP, were cloned representing common (B3L_common), mixed (B3L_mixed) and minor (B3L_minor) haplotypes. The bottom pair containing shorter inserts of ~1500 bp represents two haplotypes (B3S_common and B3S_minor).
To test whether the major and minor alleles of the upstream region of CHRNB3 might affect gene expression, the CHRNB3 reporter constructs were evaluated in three cell types: HEK293T, P19, and SH-SY5Y. In the HEK293T cells, luciferase expression levels from the CHRNB3 constructs were not significantly higher than control plasmids containing no insert, suggesting these cell types do not contain the transcriptional machinery to express CHRNB3. In the P19 embryonal carcinoma cells, a one-way ANOVA including all five constructs yielded evidence for a significant difference between the constructs (F=2.87, p=0.018). However, none of the pair-wise tests for differences using Tukey’s post hoc test were significant (all p>0.08). The patterns of expression are shown in Figure 3a, which suggest a step-wise difference in expression between the three long constructs. A post hoc ANOVA of only these three constructs and the control revealed evidence for differences between the common and minor constructs. The overall ANOVA F statistic was 3.95 (p=0.012), with significant differences between the control and common haplotypes (p=0.048) and between the common and minor haplotypes (p=0.023). Figure 3a shows the relative levels of expression for the constructs in P19 cells. In the SH-SY5Y human neuroblastoma cells, one-way ANOVA of all five constructs approached significance (F=2.03, p=0.078; Figure 3b). Although a step-wise difference in the long constructs was suggested by the bar graph, secondary ANOVA remained non-significant (F=2.10, p=0.106). However, after the SH-SY5Y cells were differentiated, a significant difference consistent with the P19 cell results emerged. Examining all five constructs, there was a significant difference associated with haplotype (F=7.68, p<0.001). Tukey’s post hoc provided evidence for differences between the long common and mixed haplotypes (p=0.023), the long common and minor haplotypes (p=0.065), the long mixed haplotype and each of the short constructs (p=0.005 and 0.006), the long minor haplotype and each of the short versions (p=0.014 in each), and suggestive evidence for differences between the common and minor haplotypes (p=0.065). The control vector was significantly different from the common (0.045), short common (0.009), and short minor (0.009) constructs. These data are shown in Figure 3c.
Figure 3.
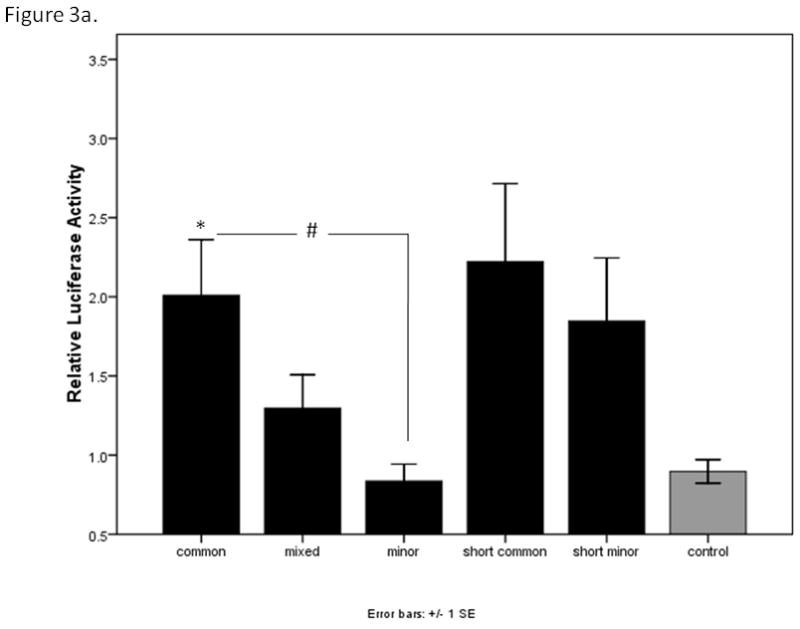
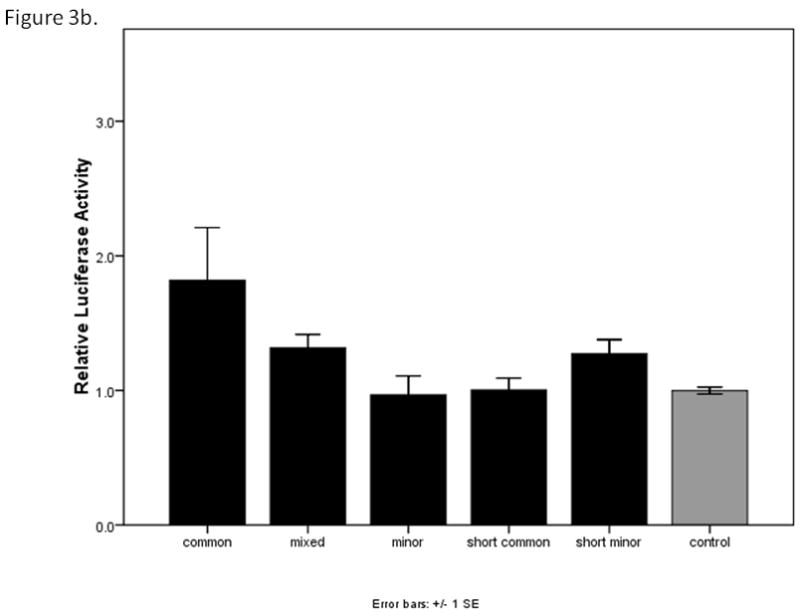
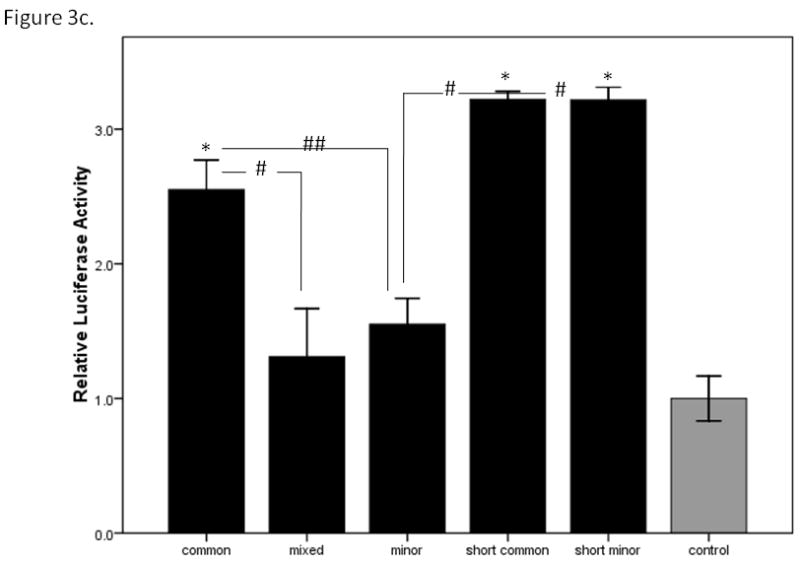
Figure 3a. Relative luciferase expression levels of five CHRNB3 promoter region constructs in P19 mouse embryonic carcinoma cells. All data were normalized to the control (empty) construct. Note: Using ANOVA which included all five constructs and the control, there were no significant differences. * indicates significant differences (p<0.05) in the analysis of the three long constructs with the control. # indicates a significant difference (p<0.05) between the long common and long minor haplotypes. Error bars show +/− 1 standard error.
Figure 3b. Relative luciferase expression levels of the CHRNB3 promoter region constructs in SH-SY5Y human neuroblastoma cells. Error bars show +/− 1 standard error.
Figure 3c. Relative luciferase expression levels of the CHRNB3 promoter region constructs in differentiated SH-SY5Y human neuroblastoma cells. * indicates significant differences (p<0.05) in the analysis of the three long constructs with the control. # indicates a significant difference (p<0.05) between indicated haplotypes. ## indicates a suggestive difference (p=0.065) between indicated haplotypes. Error bars show +/− 1 standard error.
Discussion
This study supports a previous report, in a separate sample, of an association between the CHRNB3 gene (Zeiger et al., 2008) and early subjective response to tobacco, specifically “dizziness.” The “dizziness” item was selected as the only subjective effect for this analysis based on its high contribution to two genetically-derived prinicipal components phenotypes associated with CHRNB3 in our previous study (Figure 2 in (Zeiger et al., 2008)) and to minimize false-positive findings that may occur with multiple testing of several phenotypes. After correcting for all 17 SNPs tested in the gene, the overall empirical p-value for the gene reached significance at p=0.021 (Table 3). Within the gene, multiple SNPs in the putative promoter region of CHRNB3 reached nominal significance, while none of the SNPs in other regions showed any evidence for association with “dizziness” (Table 2). In addition, evidence for a connection between two other CHRN genes (CHRNA4 and CHRNA10) emerged from our secondary analysis of all SNPs that had been genotyped. The CHRNA4 gene (rs3787140) reached a similar level of significance as CHRNB3 for the top individual SNP empirical p-value (0.011) and gene-based empirical p-value (0.020), but was not significant experiment-wide (p=0.19). The most significant result was for SNP rs2231532 (p=0.002) in CHRNA10 (p=0.007), which reached experiment-wide significance (p=0.048) after correcting for all 226 SNPs. This is a novel association finding that was not observed in the analysis of case-control status in the overlapping NICSNP sample (uncorrected p=0.18) (Saccone et al., in press).
We focused on the single item “dizziness” based on our previous analysis of CHRNB3 and early subjective effects to tobacco in the National Longitudinal Study of Adolescent Health, where this item emerged as an important contributor to a genetically-derived principal component subjective effects phenotype (Zeiger et al., 2008). It is noteworthy that in this sample there was a strong correlation between “dizziness” and nicotine dependence, where dependent subjects were more likely to report feeling of “intense” dizziness. This supports the idea that “dizziness” might be an early smoking-related phenotype which may be more closely related to the underlying genetic mechanisms of tobacco addiction, while simultaneously encompassing important predicative validity regarding clinical dependence.
This replication in a third sample provides further support for a role of the putative promoter region of CHRNB3 and early subjective responses to tobacco (Zeiger et al., 2008). Therefore, we conducted functional studies aimed at determining whether different SNPs in this putative promoter region might lead to differences in expression of CHRNB3. Work by others has shown that a 75bp fragment located immediately upstream of the ATG start site is sufficient for neuronal-specific expression of β3 in birds (Hernandez et al., 1995; Roztocil et al., 1998). Our analysis shows a similar stretch of sequences in the same region of the human CHRNB3 gene, which overlaps with known SNP rs41272375 (see Figure 2). Because the SNP rs4950, immediately downstream of rs41272375, was implicated in our previous study and was nominally significant in this study, we generated two pairs of luciferase reporter assay constructs which included rs4950. One pair of constructs extended approximately 3000 bp upstream of the initiation codon of CHRNB3 and included SNPs rs13277254 and rs13277524. Both of these SNPs are among the top five SNPs (rs10958726, rs1955186, rs1955185, rs13277254, and rs13277524) in high linkage disequilibrium showing similar levels of nominal significance (p<0.01). The other pair of constructs included SNPs rs6474413 and rs4950, which were among the “second-tier” level of significant SNPs (Table 2).
In the HEK293T human embryonic kidney cells, none of the constructs led to sufficient levels of expression above the control plasmid. These results were not unexpected, because studies of β3 subunit expression have been challenging due to its low level of endogenous expression in a limited number of certain cell types (Cauley et al., 1996). Fortunately, we were able to compare expression levels of the five constructs with control plasmid lacking any inserts using two cell lines: P19 mouse embryonal carcinoma cells and SH-SY5Y human neuroblastoma cells. In the P19 cells, there was a significant difference in expression between the long construct containing the common haplotype and the minor haplotype (Figure 3a) providing evidence that allelic variation in this promoter region may be associated with gene expression. There were no significant differences in expression among any of the constructs in the undifferentiated SH-SY5Y cells (Figure 3b). However, there was a significant difference between the long common and mixed haplotypes, and suggestive evidence for a difference between the long common and minor haplotypes. This last comparison probably failed to reach significance because of the variability in signal that is obtained from these assays.
The significant association between the dizziness item and CHRNA4 (rs3787140) is a novel finding, and somewhat difficult to interpret in the context of previous studies. The α4 subunit commonly combines with the β2 subunit to form some of the most widely distributed and common nAChR subtypes in the brain (Gotti et al., 2007). In case-control analysis of the NICSNP sample, nominal significance was reported for other SNPs in CHRNA4, but not rs3787140 (Saccone et al., in press). In other samples, Feng et al. (2004) reported an association between the CHRNA4 gene and nicotine dependence (as measured by the Fagerstrom Test for Nicotine Dependence – FTND (Heatherton et al., 1991)), but no association with CHRNB2. Also using the FTND, Li et al (2005) found an association with CHRNA4, but not CHRNB2. Another study by Hutchison et al (2007) showed an association between CHRNA4, nicotine dependence, a “rush” or “high” following a cigarette, and the expression of α4β2 nAChRs in the nucleus accumbens. This study also presented functional data for two SNPs in the 5′UTR and promoter region of CHRNA4. Two other studies focused on CHRNB2 failed to find evidence for an association with nicotine phenotypes (Lueders et al., 2002; Silverman et al., 2000). However, a more recent study found evidence for an association between age of initiation of smoking in women and CHRNB2 (Greenbaum et al., 2006). Furthermore, our group found evidence for association between a rare SNP in the 5′UTR of CHRNB2 (rs2072658) and early subjective response to both alcohol and tobacco as well as modest evidence for association between past six month alcohol use and CHRNA4 (Ehringer et al., 2007). In the current study, significance levels for CHRNA4 are comparable to those for CHRNB3, but since this gene was not tested as an a priori hypothesis the experiment-wide empirical p-values did not meet significance. Although we did not detect an association with CHRNB2 in this study, only four SNPs (not including rs2072658) were genotyped, so it is possible this gene was not fully saturated. Since α4 and β2 subunits combine to form the most abundant high affinity nAChRs in the brain, and two separate studies have implicated these genes in early subjective response to nicotine, we believe additional work examining CHRNA4 and CHRNB2 with related subjective effects measures is merited.
To our knowledge, this is the first report of an association between a tobacco-related behavior and the CHRNA10 gene. Three of the four SNPs examined in the CHRNA10 gene were nominally significant at p<0.01, and SNP rs2231532 was the only SNP that reached experiment-wide empirical significance at p=0.048. The α10 nAChR subunit is the most recently discovered subunit and human α10 RNA and protein have been detected in inner-ear tissue, immortalized B-cells, cultured T-cells, and peripheral blood lymphocytes (Lustig et al., 2001). Their location in the inner ear corresponds nicely with a possible involvement in mediating a “dizziness” phenotype. Although the α10 subunit has not been shown to produce functional receptors alone, co-injection with α9 leads to robust acetylcholine-evoked currents, suggesting these receptors are likely to be targets for nicotine as well (Sgard et al., 2002). This potential biological relevance of the CHRNA10 gene suggests future studies examining the “dizziness” endophenotype will be of value.
Interestingly, a follow-up analysis revealed strong evidence for a sex*genotype interaction at the CHRNB3 and CHRNA10 SNPs. There was no evidence for association between sex and “dizziness” (data not shown), so this interaction is also a novel finding. Here we see evidence that the association with “dizziness” is observed only in males, and not in females. It will be important to try to replicate this result in other samples.
It is noteworthy that there was no evidence for association with “dizziness” and the CHRNA5/A3/B4 gene cluster on chromosome 15, which has been repeatedly associated with smoking behaviors, including age of initiation (Schlaepfer et al., 2008a; Weiss et al., 2008), “pleasurable buzz” during early experimentation (Sherva et al., 2008), cigarettes per day (Berrettini et al., 2008; Thorgeirsson et al., 2008), nicotine dependence (Bierut et al., 2007; Saccone et al., 2007), and lung cancer (Amos et al., 2008; Hung et al., 2008). At least two independent loci in this region have been identified for association with nicotine dependence (Bierut et al., 2008; Saccone et al., in press), with evidence for functional relevance of a non-synonomous SNP rs16969968 in the α5 subunit (Bierut et al., 2008). The CHRNA5/A3/B4 cluster is associated with nicotine dependence in this sample (see Saccone et al., in press, and Supplementary Table 1), but the p-value for association between “dizziness” and rs16969968 is 0.40. Nor did we find evidence for association between “pleasurable buzz” and rs16969968 (p=0.43, data not shown). This lack of association highlights the challenge of finding and understanding genetic components for complex disorders. Although “dizziness” and “pleasurable buzz” are highly predictive of nicotine dependence and likely to be an informative phenotype for understanding some genes related to smoking behavior, they do not explain the association of the CHRNA5/A3/B4 cluster with nicotine dependence in this sample.
There are three limitations that should be considered when drawing conclusions from this work. First, none of the p-values have been corrected for multiple testing of different phenotypes. These data have been previously examined for nicotine dependence (Saccone et al., in press), and it is probable that the data may be analyzed to examine other related phenotypes in the future. Likewise, we chose to analyze SNPs in the CHRNB3 gene separately from the CHRNA6 gene, based on previous work that had specifically implicated the CHRNB3 gene (and our own functional work). However, by doing this, the overall gene significance level of CHRNB3 may be slightly inflated. Finally, although the functional data provide evidence for differences in gene expression, it will be important to elucidate the possible mechanism of differences (e.g. transcriptional or post-transcriptional) in future studies. Likewise, it will be important to determine whether such differences correspond to differences in protein levels, but these experiments are limited currently by the fact that there is no method for specifically measuring Chrnb3 protein, since no reliable antibodies are available.
In conclusion, this work replicates an association between variations in the CHRNB3 gene promoter region and “dizziness” sensations during early tobacco use. Functional data using reporter-gene assays support the hypothesis that different alleles of SNPs upstream of CHRNB3 may lead to differential RNA expression of the gene. In addition, we have found modest evidence for an association between CHRNA4 and “dizziness” and strong evidence for an association with CHRNA10. These findings provide important insight into the developmental trajectory for nicotine dependence, and the utility of focusing on an early tobacco response phenotype in genetic studies. This idea was described in a theoretical framework of the neuroregulatory effects of nicotine by Pomerleau and colleagues over twenty years ago (Pomerleau and Pomerleau, 1984). In the current study, subjects were asked retrospectively about their early responses to cigarettes, and the potential for inaccurate recall is a major limitation. In the Zeiger et al. (2008) study, two different young adult samples were assessed within 5–10 years of their initiation, so the convergence across the three samples suggests this phenotype is likely to be important. A better understanding of how individual genes may contribute to differential responses during early periods of use should allow us to develop improved methods for early intervention and prevention of nicotine dependence.
Supplementary Material
Acknowledgments
This work was supported by National Institutes of Health grants [CA89392 to L.J. Bierut], [AA015336 to M.A.E.], [CA89392 to L.J.B.], [DA022462 salary support for J.S.], [DA017637 training support for N.R.H.], [EY012562 salary support for M.B.M.].
The COGEND project is a collaborative research group and part of the NIDA Genetics Consortium. Subject collection was supported by NIH grant CA89392 (PI - L Bierut) from the National Cancer Institute. Genotyping work at Perlegen Sciences was performed under NIDA Contract HHSN271200477471C. Phenotypic and genotypic data are stored in the NIDA Center for Genetic Studies (NCGS) at http://zork.wustl.edu/ under NIDA Contract HHSN271200477451C (PIs J Tischfield and J Rice). Genotyping services were also provided by the Center for Inherited Disease Research (CIDR). CIDR is fully funded through a federal contract from the National Institutes of Health to The Johns Hopkins University, contract number HHSN268200782096.
In memory of Theodore Reich, founding Principal Investigator of COGEND, we are indebted to his leadership in the establishment and nurturing of COGEND and acknowledge with great admiration his seminal scientific contributions to the field. Lead investigators directing data collection are Laura Bierut, Naomi Breslau, Dorothy Hatsukami, and Eric Johnson. The authors thank Heidi Kromrei and Tracey Richmond for their assistance in data collection.
Footnotes
Financial Disclosures
Drs. LJ Bierut and JC Wang are listed as inventors on a patent (US 20070258898) held by Perlegen Sciences, Inc., covering the use of certain SNPs in determining the diagnosis, prognosis, and treatment of addiction. Dr. Bierut has acted as a consultant for Pfizer, Inc. in 2008.
References
- WHO report on the global tobacco epidemic, 2008: the MPOWER package. Geneva: World Health Organization; 2008. [Google Scholar]
- Amos CI, Wu X, Broderick P, Gorlov IP, Gu J, Eisen T, Dong Q, Zhang Q, Gu X, Vijayakrishnan J, et al. Genome-wide association scan of tag SNPs identifies a susceptibility locus for lung cancer at 15q25.1. Nat Genet. 2008 doi: 10.1038/ng.109. [DOI] [PMC free article] [PubMed] [Google Scholar]
- Barrett JC, Fry B, Maller J, Daly MJ. Haploview: analysis and visualization of LD and haplotype maps. Bioinformatics. 2005;21(2):263–5. doi: 10.1093/bioinformatics/bth457. [DOI] [PubMed] [Google Scholar]
- Berrettini W, Yuan X, Tozzi F, Song K, Francks C, Chilcoat H, Waterworth D, Muglia P, Mooser V. alpha-5/alpha-3 nicotinic receptor subunit alleles increase risk for heavy smoking. Mol Psychiatry. 2008 doi: 10.1038/sj.mp.4002154. [DOI] [PMC free article] [PubMed] [Google Scholar]
- Bierut LJ, Madden PA, Breslau N, Johnson EO, Hatsukami D, Pomerleau OF, Swan GE, Rutter J, Bertelsen S, Fox L, et al. Novel genes identified in a high-density genome wide association study for nicotine dependence. Hum Mol Genet. 2007;16(1):24–35. doi: 10.1093/hmg/ddl441. [DOI] [PMC free article] [PubMed] [Google Scholar]
- Bierut LJ, Stitzel JA, Wang JC, Hinrichs AL, Grucza RA, Xuei X, Saccone NL, Saccone SF, Bertelsen S, Fox L, et al. Variants in Nicotinic Receptors and Risk for Nicotine Dependence. Am J Psychiatry. 2008 doi: 10.1176/appi.ajp.2008.07111711. [DOI] [PMC free article] [PubMed] [Google Scholar]
- Carlson CS, Eberle MA, Kruglyak L, Nickerson DA. Mapping complex disease loci in whole-genome association studies. Nature. 2004;429(6990):446–52. doi: 10.1038/nature02623. [DOI] [PubMed] [Google Scholar]
- Cauley K, Marks M, Gahring LC, Rogers SW. Nicotinic receptor subunits alpha 3, alpha 4, and beta 2 and high affinity nicotine binding sites are expressed by P19 embryonal cells. J Neurobiol. 1996;30(2):303–14. doi: 10.1002/(SICI)1097-4695(199606)30:2<303::AID-NEU11>3.0.CO;2-K. [DOI] [PubMed] [Google Scholar]
- CDC. Annual Smoking-Attibutable Mortality, Years of Potential Life Lost, and Productivity Losses - United States, 1997–2001. Morb Mort Wkly Rep. 2005;54(25):625–628. [PubMed] [Google Scholar]
- CDC. Cigarette Smoking Among Adults - United States, 2006. Morb Mort Wkly Rep. 2007;56(44):1157–1161. [PubMed] [Google Scholar]
- Ehringer MA, Clegg HV, Collins AC, Corley RP, Crowley T, Hewitt JK, Hopfer CJ, Krauter K, Lessem J, Rhee SH, et al. Association of the neuronal nicotinic receptor beta2 subunit gene (CHRNB2) with subjective responses to alcohol and nicotine. Am J Med Genet B Neuropsychiatr Genet. 2007;144B:596–604. doi: 10.1002/ajmg.b.30464. [DOI] [PubMed] [Google Scholar]
- Feng Y, Niu T, Xing H, Xu X, Chen C, Peng S, Wang L, Laird N. A Common Haplotype of the Nicotine Acetylcholine Receptor alpha 4 Subunit Gene Is Associated with Vulnerability to Nicotine Addiction in Men. Am J Hum Genet. 2004;75(1):112–21. doi: 10.1086/422194. [DOI] [PMC free article] [PubMed] [Google Scholar]
- Gabriel SB, Schaffner SF, Nguyen H, Moore JM, Roy J, Blumenstiel B, Higgins J, DeFelice M, Lochner A, Faggart M, et al. The structure of haplotype blocks in the human genome. Science. 2002;296(5576):2225–9. doi: 10.1126/science.1069424. [DOI] [PubMed] [Google Scholar]
- Gotti C, Moretti M, Gaimarri A, Zanardi A, Clementi F, Zoli M. Heterogeneity and complexity of native brain nicotinic receptors. Biochem Pharmacol. 2007;74(8):1102–11. doi: 10.1016/j.bcp.2007.05.023. [DOI] [PubMed] [Google Scholar]
- Grady SR, Salminen O, Laverty DC, Whiteaker P, McIntosh JM, Collins AC, Marks MJ. The subtypes of nicotinic acetylcholine receptors on dopaminergic terminals of mouse striatum. Biochem Pharmacol. 2007;74(8):1235–46. doi: 10.1016/j.bcp.2007.07.032. [DOI] [PMC free article] [PubMed] [Google Scholar]
- Greenbaum L, Kanyas K, Karni O, Merbl Y, Olender T, Horowitz A, Yakir A, Lancet D, Ben-Asher E, Lerer B. Why do young women smoke? I. Direct and interactive effects of environment, psychological characteristics and nicotinic cholinergic receptor genes. Mol Psychiatry. 2006;11(3):312–22. 223. doi: 10.1038/sj.mp.4001774. [DOI] [PubMed] [Google Scholar]
- Heath AC, Madden PA, Martin NG. Statistical methods in genetic research on smoking. Stat Methods Med Res. 1998;7(2):165–86. doi: 10.1177/096228029800700205. [DOI] [PubMed] [Google Scholar]
- Heatherton TF, Kozlowski LT, Frecker RC, Fagerstrom KO. The Fagerstrom Test for Nicotine Dependence: a revision of the Fagerstrom Tolerance Questionnaire. Br J Addict. 1991;86(9):1119–27. doi: 10.1111/j.1360-0443.1991.tb01879.x. [DOI] [PubMed] [Google Scholar]
- Hernandez MC, Erkman L, Matter-Sadzinski L, Roztocil T, Ballivet M, Matter JM. Characterization of the nicotinic acetylcholine receptor beta 3 gene. Its regulation within the avian nervous system is effected by a promoter 143 base pairs in length. J Biol Chem. 1995;270(7):3224–33. doi: 10.1074/jbc.270.7.3224. [DOI] [PubMed] [Google Scholar]
- Hoft NR, Corley RP, McQueen MB, Schlaepfer IR, Huizinga D, Ehringer MA. Genetic Association of the CHRNA6 and CHRNB3 Genes with Tobacco Dependence in a Nationally Representative Sample. Neuropsychopharmacology. 2008 doi: 10.1038/npp.2008.122. [DOI] [PMC free article] [PubMed] [Google Scholar]
- Hopfer CJ, Stallings MC, Hewitt JK. Common genetic and environmental vulnerability for alcohol and tobacco use in a volunteer sample of older female twins. J Stud Alcohol. 2001;62(6):717–23. doi: 10.15288/jsa.2001.62.717. [DOI] [PubMed] [Google Scholar]
- Hung RJ, McKay JD, Gaborieau V, Boffetta P, Hashibe M, Zaridze D, Mukeria A, Szeszenia-Dabrowska N, Lissowska J, Rudnai P, et al. A susceptibility locus for lung cancer maps to nicotinic acetylcholine receptor subunit genes on 15q25. Nature. 2008;452(7187):633–7. doi: 10.1038/nature06885. [DOI] [PubMed] [Google Scholar]
- Hutchison KE, Allen DL, Filbey FM, Jepson C, Lerman C, Benowitz NL, Stitzel J, Bryan A, McGeary J, Haughey HM. CHRNA4 and tobacco dependence: from gene regulation to treatment outcome. Arch Gen Psychiatry. 2007;64(9):1078–86. doi: 10.1001/archpsyc.64.9.1078. [DOI] [PubMed] [Google Scholar]
- Li MD, Beuten J, Ma JZ, Payne TJ, Lou XY, Garcia V, Duenes AS, Crews KM, Elston RC. Ethnic- and gender-specific association of the nicotinic acetylcholine receptor alpha4 subunit gene (CHRNA4) with nicotine dependence. Hum Mol Genet. 2005;14(9):1211–9. doi: 10.1093/hmg/ddi132. [DOI] [PubMed] [Google Scholar]
- Lueders KK, Hu S, McHugh L, Myakishev MV, Sirota LA, Hamer DH. Genetic and functional analysis of single nucleotide polymorphisms in the beta2-neuronal nicotinic acetylcholine receptor gene (CHRNB2) Nicotine Tob Res. 2002;4(1):115–25. doi: 10.1080/14622200110098419. [DOI] [PubMed] [Google Scholar]
- Lustig LR, Peng H, Hiel H, Yamamoto T, Fuchs PA. Molecular cloning and mapping of the human nicotinic acetylcholine receptor alpha10 (CHRNA10) Genomics. 2001;73(3):272–83. doi: 10.1006/geno.2000.6503. [DOI] [PubMed] [Google Scholar]
- Mexal S, Jenkins PM, Lautner MA, Iacob E, Crouch E, Stitzel JA. alpha 7 nicotinic receptor gene promoter polymorphisms in inbred mice affect expression in a cell type-specific fashion. J Biol Chem. 2007 doi: 10.1074/jbc.M610694200. [DOI] [PubMed] [Google Scholar]
- Pomerleau OF, Pomerleau CS. Neuroregulators and the reinforcement of smoking: towards a biobehavioral explanation. Neurosci Biobehav Rev. 1984;8(4):503–13. doi: 10.1016/0149-7634(84)90007-1. [DOI] [PubMed] [Google Scholar]
- Purcell S, Neale B, Todd-Brown K, Thomas L, Ferreira MA, Bender D, Maller J, Sklar P, de Bakker PI, Daly MJ, et al. PLINK: a tool set for whole-genome association and population-based linkage analyses. Am J Hum Genet. 2007;81(3):559–75. doi: 10.1086/519795. [DOI] [PMC free article] [PubMed] [Google Scholar]
- Roztocil T, Matter-Sadzinski L, Gomez M, Ballivet M, Matter JM. Functional properties of the neuronal nicotinic acetylcholine receptor beta3 promoter in the developing central nervous system. J Biol Chem. 1998;273(24):15131–7. doi: 10.1074/jbc.273.24.15131. [DOI] [PubMed] [Google Scholar]
- Saccone N, Saccone S, Hinrichs A, Stitzel J, Duan W, Pergadia M, Agrawal A, Breslau N, Grucza R, Hatsukami D, et al. Multiple distinct risk loci for nicotine dependence identified by dense coverage of the complete family of nicotinic receptor subunit (CHRN) genes. Am J Med Genet B Neuropsychiatr Genet. doi: 10.1002/ajmg.b.30828. in press. [DOI] [PMC free article] [PubMed] [Google Scholar]
- Saccone SF, Hinrichs AL, Saccone NL, Chase GA, Konvicka K, Madden PA, Breslau N, Johnson EO, Hatsukami D, Pomerleau O, et al. Cholinergic nicotinic receptor genes implicated in a nicotine dependence association study targeting 348 candidate genes with 3713 SNPs. Hum Mol Genet. 2007;16(1):36–49. doi: 10.1093/hmg/ddl438. [DOI] [PMC free article] [PubMed] [Google Scholar]
- Schlaepfer IR, Hoft NR, Collins AC, Corley RP, Hewitt JK, Hopfer CJ, Lessem JM, McQueen MB, Rhee SH, Ehringer MA. The CHRNA5/A3/B4 Gene Cluster Variability as an Important Determinant of Early Alcohol and Tobacco Initiation in Young Adults. Biol Psychiatry. 2008a;63(11):1039–1046. doi: 10.1016/j.biopsych.2007.10.024. [DOI] [PMC free article] [PubMed] [Google Scholar]
- Schlaepfer IR, Hoft NR, Ehringer MA. The Genetic Components of Alcohol and Nicotine Co-Addiction: From Genes to Behavior. Curr Drug Abuse Rev. 2008b;1:124–134. doi: 10.2174/1874473710801020124. [DOI] [PMC free article] [PubMed] [Google Scholar]
- Sgard F, Charpantier E, Bertrand S, Walker N, Caput D, Graham D, Bertrand D, Besnard F. A novel human nicotinic receptor subunit, alpha10, that confers functionality to the alpha9-subunit. Mol Pharmacol. 2002;61(1):150–9. doi: 10.1124/mol.61.1.150. [DOI] [PubMed] [Google Scholar]
- Sherva R, Wilhelmsen K, Pomerleau CS, Chasse SA, Rice JP, Snedecor SM, Bierut LJ, Neuman RJ, Pomerleau OF. Association of a single nucleotide polymorphism in neuronal acetylcholine receptor subunit alpha 5 (CHRNA5) with smoking status and with ‘pleasurable buzz’ during early experimentation with smoking. Addiction. 2008;103:1544–1552. doi: 10.1111/j.1360-0443.2008.02279.x. [DOI] [PMC free article] [PubMed] [Google Scholar]
- Silverman MA, Neale MC, Sullivan PF, Harris-Kerr C, Wormley B, Sadek H, Ma Y, Kendler KS, Straub RE. Haplotypes of four novel single nucleotide polymorphisms in the nicotinic acetylcholine receptor beta2-subunit (CHRNB2) gene show no association with smoking initiation or nicotine dependence. Am J Med Genet. 2000;96(5):646–53. [PubMed] [Google Scholar]
- Swan GE, Carmelli D. Behavior Genetic Investigations of Cigarette Smoking and Related Issues in Twins. In: Blum K, Noble EP, editors. Handbook of Psychiatric Genetics. Boca Raton, New York, London, Tokyo: CRC Press Inc; 1997. pp. 387–406. [Google Scholar]
- Swan GE, Carmelli D, Cardon LR. Heavy consumption of cigarettes, alcohol and coffee in male twins. J Stud Alcohol. 1997;58(2):182–90. doi: 10.15288/jsa.1997.58.182. [DOI] [PubMed] [Google Scholar]
- Thorgeirsson TE, Geller F, Sulem P, Rafnar T, Wiste A, Magnusson KP, Manolescu A, Thorleifsson G, Stefansson H, Ingason A, et al. A variant associated with nicotine dependence, lung cancer and peripheral arterial disease. Nature. 2008;452(7187):638–42. doi: 10.1038/nature06846. [DOI] [PMC free article] [PubMed] [Google Scholar]
- Weiss RB, Baker TB, Cannon DS, von Niederhausern A, Dunn DM, Matsunami N, Singh NA, Baird L, Coon H, McMahon WM, et al. A candidate gene approach identifies the CHRNA5-A3-B4 region as a risk factor for age-dependent nicotine addiction. PLoS Genet. 2008;4(7):e1000125. doi: 10.1371/journal.pgen.1000125. [DOI] [PMC free article] [PubMed] [Google Scholar]
- Young SE, Rhee SH, Stallings MC, Corley RP, Hewitt JK. Genetic and environmental vulnerabilities underlying adolescent substance use and problem use: general or specific? Behav Genet. 2006;36(4):603–15. doi: 10.1007/s10519-006-9066-7. [DOI] [PubMed] [Google Scholar]
- Zeiger J, Haberstick BC, Schlaepfer I, Collins AC, Corley RP, Crowley TJ, Hewitt JK, Hopfer CJ, Lessem J, McQueen MB, et al. The neuronal nicotinic receptor subunit genes (CHRNA6 and CHRNB3) are associated with subjective responses to tobacco. Hum Mol Genet. 2008;17(5):724–734. doi: 10.1093/hmg/ddm344. [DOI] [PubMed] [Google Scholar]
Associated Data
This section collects any data citations, data availability statements, or supplementary materials included in this article.