Abstract
Overall survival (OS) has improved with increasing use of novel agents in multiple myeloma (MM). However, the disease course remains highly variable, and the heterogeneity largely reflects different genetic abnormalities. We studied the impact of the Mayo risk-stratification model of MM on patient outcome in the era of novel therapies, evaluating each individual component of the model—fluorescence in situ hybridization (FISH), conventional cytogenetics (CG), and the plasma cell labeling index—that segregates patients into high- and standard-risk categories. This report consists of 290 patients with newly diagnosed MM, predominantly treated with novel agents, who were risk-stratified at diagnosis and were followed up for OS. Of these patients, 81% had received primarily thalidomide (n=50), lenalidomide (n=199), or bortezomib (n=79) as frontline or salvage therapies. Our retrospective analysis validates the currently proposed Mayo risk-stratification model (median OS, 37 months vs not reached for high- and standard-risk patients, respectively; P=.003). Although the FISH or CG test identifies a high-risk cohort with hazard ratios of 2.1 (P=.006) and 2.5 (P=.006), respectively, the plasma cell labeling index cutoff of 3% fails to independently prognosticate patient risk (hazard ratio, 1.4; P=.41). In those stratified as standard-risk by one of the 2 tests (FISH or CG), the other test appears to be of additional prognostic significance. This study validates the high-risk features defined by FISH and CG in the Mayo risk-stratification model for patients with MM predominantly treated with novel therapies based on immunomodulatory agents.
CG = cytogenetics; CI = confidence interval; FISH = fluorescence in situ hybridization; HR = hazard ratio; IgH = immunoglobulin heavy chain; MM = multiple myeloma; mSMART = Mayo Stratification of Myeloma and Risk-Adapted Therapy; NR = not reached; PCLI = plasma cell labeling index; SCT = stem cell transplantation
Multiple myeloma (MM) is a clonal plasma cell disorder that has witnessed considerable therapeutic advances in recent times. This progress can be attributed to improved antimyeloma therapy along with a better understanding of the tumor biology and heterogeneity.1,2 Although a wide variation in overall survival (OS) of patients has been observed in studies analyzing the natural history of MM,3 only now are we beginning to associate the disparity in clinical outcomes with specific genetic abnormalities. Such chromosomal abnormalities are almost universally prevalent in the neoplastic plasma cells, typically occurring early in the disease process and dictating its course.4 Both cytogenetics (CG) and interphase fluorescence in situ hybridization (FISH) assays have played pivotal roles in the risk stratification of patients with newly diagnosed MM. Although still useful, conventional prognostic factors (β2-microglobulin, lactate dehydrogenase, serum albumin, C-reactive protein, etc)5 appear to be somewhat less discerning of the outcome compared with the genetic aberrations that drive the tumor biology.6-10
The Mayo Stratification of Myeloma and Risk-Adapted Therapy (mSMART) criteria use a combination of metaphase CG, FISH, and plasma cell labeling index (PCLI; a measure of the percentage of plasma cells in the S phase of the cell cycle)11 results to derive 2 composite risk categories (high-risk vs standard-risk) for prognostication of patients with newly diagnosed MM.12 Although the initial prognostication criteria were based on the evidence predominantly garnered from patients treated with conventional chemotherapy and/or stem cell transplantation (SCT), the recommendations are periodically revised as new data emerge. Less than a decade ago, melphalan-prednisone or combination chemotherapies along with SCT were the mainstays of treatment of MM. The introduction of newer therapies, immunomodulatory drugs (thalidomide and lenalidomide), and the first-in-class proteasome inhibitor bortezomib ushered in a period of remarkable progress as the profound impact of such novel agents became evident early in the disease course.1,13 Therefore, the Mayo prognostic model needed a formal assessment in the current era of expanded use of novel therapies. The objectives of our study were to evaluate the significance of the Mayo risk-stratification criteria since the integration of novel agents in the management of MM and to assess the independent prognostic value of each of the components (CG, FISH, and PCLI) in the model.
PATIENTS AND METHODS
We abstracted data from a cohort of 1556 consecutive patients who presented to Mayo Clinic in Rochester, MN, between January 1999 and March 2009 within 90 days of diagnosis of MM. High-risk MM was defined by the Mayo stratification model as the presence of any one or more of the following: CG: hypodiploidy, monosomy of chromosome 13, or deletion 13q; FISH: deletion of p53 (locus 17p13) or immunoglobulin heavy chain (IgH) translocations, t(4;14)(p16.3;q32), or t(14;16)(q32;q23); or PCLI of 3% or greater. Patients were considered standard-risk if they lacked all the aforementioned abnormalities. Because the IgH translocation signature on FISH studies of MM patients is conserved throughout the disease course, we used IgH translocation–related data from interphase FISH performed on patients at any time point during the course of the disease. However, the non–IgH translocation–related abnormalities on FISH (del 17p) were considered for stratification only if observed at diagnosis. The Mayo Clinic Institutional Review Board approved this study.
Survival estimates were created using the Kaplan-Meier method and compared by log-rank tests. Overall survival was defined as the time from initiation of therapy to death from any cause. Patients who were alive at the time of analysis were censored on the last date of follow-up. All statistical tests were performed using JMP 8 (SAS Institute, Cary, NC).
We attempted to validate the proposed mSMART criteria in patients with newly diagnosed MM predominantly treated with novel agents by comparing OS of high- vs standard-risk groups. In addition, we studied the prognostic value of the 3 tests separately and in a multivariable analysis using the Cox proportional hazards model. We then examined the additional prognostic contribution of FISH in patients classified as high- and standard-risk by CG, and vice versa.
RESULTS
The current analysis consists of 290 patients with symptomatic MM who had CG and PCLI performed within 90 days before and up to 7 days after initiation of antimyeloma therapy. In addition, interphase FISH results were available for all these patients. The median age of the patients at presentation was 64 years (range, 22-89 years), and 177 (61%) were men. Of the 290 patients, 236 (81%) had received novel agents, primarily thalidomide (n=50), lenalidomide (n=199), and bortezomib (n=79), as frontline or salvage therapies. A total of 185 patients (64%) had received a novel agent-based frontline therapy; 112 patients (39%) had undergone autologous SCT, 13 of whom underwent a second SCT. Allogeneic transplantation was performed as a salvage measure in 4 patients.
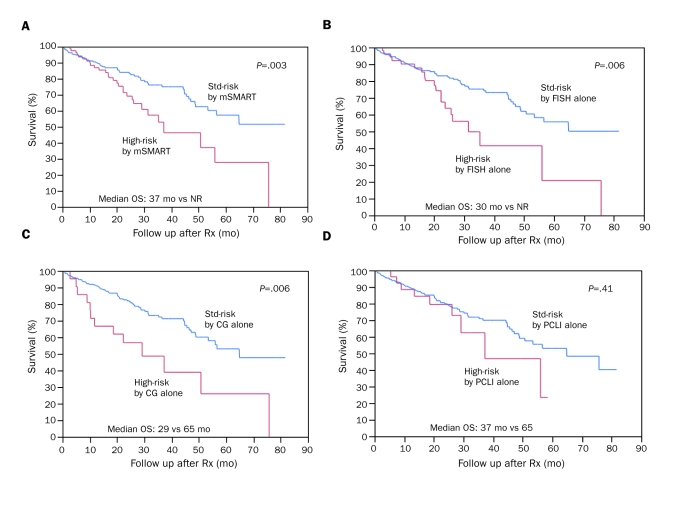
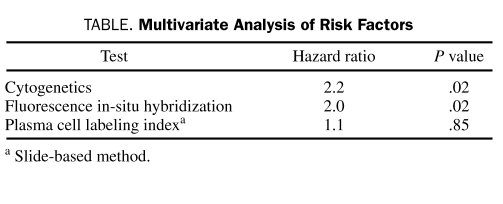
Of the 290 patients, 211 (73%) were alive at the time of analysis. The median estimated OS for the entire cohort was 65 months, and the median estimated follow-up was 29 months from initiation of therapy. Altogether, 80 patients (28%) were deemed high-risk by one or more of the 3 tests—CG, FISH, and/or PCLI—as described in the Patients and Methods section. Twenty-two patients (8%), 51 (18%), and 27 (9%) were considered high-risk by CG, FISH, and PCLI, respectively. The median OS of high-risk patients (n=80) was 37 months (95% confidence interval [CI], 29-58 months) vs not reached (NR) (95% CI, 53 months-NR) for the standard-risk group (n=210; P=.003; Figure 1, A). Patients classified as high-risk by FISH alone had a median OS of 30 months (95% CI, 22-56 months) vs NR (95% CI, 53 months-NR) for patients classified as standard-risk by FISH alone (hazard ratio [HR]=2.1; P=.006; Figure 1, B). Similarly, CG alone stratified patients into high- and standard-risk categories with a comparable HR of 2.5 (P=.006) (median survival, 29 months [95% CI, 10-57 months] vs 65 months [95% CI, 53-82 months]; Figure 1, C). In contrast, PCLI did not have a significant prognostic value (HR=1.4; P=.41; Figure 1, D). This was confirmed in a multivariate analysis including all 3 tests (Table).
FIGURE 1.
Overall survival (OS) of high-risk vs standard (std)-risk patients with newly diagnosed multiple myeloma. A, Patients classified by Mayo Stratification of Myeloma and Risk-Adapted Therapy (mSMART) criteria: median OS of high-risk patients (n=80) is 37 months vs not reached (NR) for std-risk patients (n=210). B, Patients classified by fluorescence in situ hybridization (FISH) alone: median OS of high-risk (n=51) vs std-risk (n=239) patients is 30 months vs NR, respectively. C, Patients classified by metaphase cytogenetics (CG) alone: median OS of high-risk (n=22) vs std-risk (n=268) patients is 29 months vs 65 months, respectively. D, Patients classified by plasma cell labeling index (PCLI) alone: median OS of high-risk (n=27) vs std-risk (n=263) patients is 37 months vs 65 months, respectively. Rx = therapy.
TABLE.
Multivariate Analysis of Risk Factors
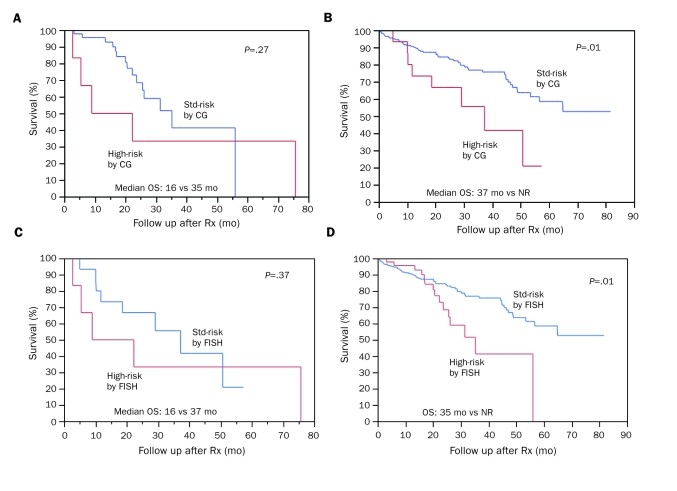
Patients classified as high-risk by FISH (n=51; 18%) were further categorized into 2 groups according to the presence or absence of high-risk features on CG (OS, 16 months [95% CI, 3-26 months] vs 35 months [95% CI, 24-37 months]; P=.27; Figure 2, A). Additional prognostic information was gained by obtaining CG in FISH-stratified standard-risk patients (n=239; 82%) (OS, 37 months [95% CI, 10-57 months] vs NR [95% CI, 57 months-NR] for high- and standard-risk features, respectively, on CG; P=.01; Figure 2, B).
FIGURE 2.
A, Cytogenetics (CG)-based risk stratification of patients with high-risk features by fluorescence in situ hybridization (FISH). When FISH-detected high-risk patients (n=51) are further subdivided into 2 groups based on presence (n=6) or absence (n=45) of high-risk features on CG, median overall survival (OS) is 16 months vs 35 months, respectively. B, CG-based risk stratification of patients with standard (std)-risk features by FISH. When std-risk patients by FISH (n=239) are further subdivided into 2 groups based on presence (n=16) or absence (n=223) of high-risk features on CG, median OS is 37 months vs not reached (NR), respectively. C, FISH-based risk stratification of patients with high-risk features by CG. When high-risk patients by CG (n=22) are further subdivided into 2 groups based on presence (n=6) or absence (n=16) of high-risk features on FISH, median OS is 16 months vs 37 months, respectively. D, FISH-based risk stratification of patients with std-risk features by CG. When std-risk patients by CG (n=268) are further subdivided into 2 groups based on presence (n=45) or absence (n=223) of high-risk features on FISH, median OS is 35 months vs NR, respectively. Rx = therapy.
Patients classified as high-risk by CG (n=22; 8%) were further categorized into 2 groups by FISH (median survival, 16 months [95% CI, 3-26 months] vs 37 months [95% CI, 10-57 months]; P=.37; Figure 2, C). Further prognostic information was gathered in those classified cytogenetically as standard-risk (n=268; 92%) by additional FISH-based stratification (median survival, 35 months [95% CI, 24-37 months] vs NR [95% CI, 57 months-NR]; P=.01; Figure 2, D).
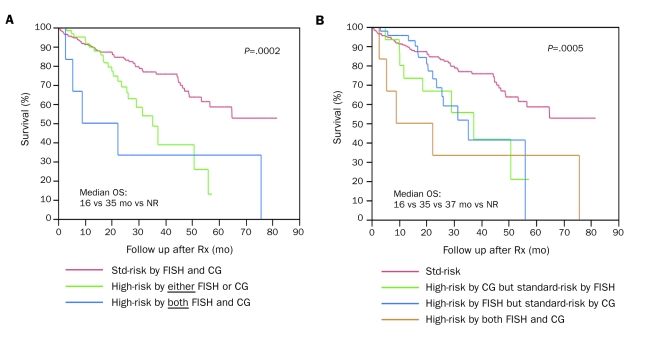
We then examined the outcome based on presence of high-risk features on either test (FISH or CG) or both. Patients with high-risk features on either test (OS, 35 months; 95% CI, 26-51) or both tests (OS, 16 months; 95% CI, 3-26) have inferior survival compared with standard-risk patients (OS, NR; 95% CI, 57 months-NR). Although the outcome of patients with high-risk features on both CG and FISH (OS, 16 months) was not statistically different from that of patients with high-risk features on either test alone (OS, 35 months), a clear separation of the survival curves of the 3 groups (including patients with standard-risk features on both tests) is visually appreciated (global P=.0002; Figure 3, A). The lack of statistical difference likely reflects the small number of patients with high-risk features on both tests. The adverse consequence of high-risk abnormality on either CG or FISH alone appears to be equivalent (Figure 3, B).
FIGURE 3.
Risk stratification based on presence of high-risk features on fluorescence in situ hybridization (FISH) or cytogenetics (CG) or both. A, Median overall survival (OS) is 16 months vs 35 months vs not reached (NR) for patients with high-risk features on both FISH and CG (n=6), either (n=61), or neither (standard [std]-risk; n=223), respectively; P=.0002. No difference in survival was noted between patients stratified as high-risk by either vs both, which likely reflects the small number of patients in the group with high-risk features on both FISH and CG. B, Median OS is 16 months vs 35 months vs 37 months vs NR for patients stratified as high-risk by both FISH and CG (n=6), high-risk by CG only (n=16), high-risk by FISH only (n=45), and std-risk (n=223), respectively. Note that the survival curves of patients stratified as high-risk by either FISH or CG are intertwined. Rx = therapy.
DISCUSSION
Metaphase cytogenetic abnormalities are seen in a minority of patients with MM because of slow division of neoplastic plasma cells; however, interphase FISH assay is independent of the plasma cell division and has a higher yield to detect genetic aberrations.4 Gene expression profiling is another valuable tool that has reproducibly demonstrated the usefulness of molecular classification of MM, but the lack of universal availability thus far has confined its role to research studies only.14,15 The mSMART model integrates risk assessment by 3 tests, 2 of which are increasingly being performed in the community as initial work-up of newly diagnosed MM. In contrast, the use of PCLI is constrained by its requirement of technical expertise and limited availability.
We attempted to avoid a selection bias by studying a cohort of patients treated sequentially since the introduction of novel agents, irrespective of the therapy they received. Our study validates high-risk features defined by FISH and CG in the risk-stratification model among patients treated since the introduction of novel therapies. Either test identifies a high-risk cohort with an HR of about 2. Particularly in patients stratified as standard-risk by 1 of the 2 tests, information provided by the other appears to be of additional prognostic value.
Our results indirectly attest to a survival benefit in standard-risk patients since the integration of novel therapies in the treatment paradigm of MM. However, caution must be exercised in this interpretation because the study did not individually assess the impact of thalidomide, bortezomib, or lenalidomide. Furthermore, patients with high-risk cytogenetic abnormalities have derived survival benefit from thalidomide-based Total Therapy 2.16 In addition, recent subset analyses of prospective studies demonstrating advantage of up-front bortezomib-based therapy in high-risk patients are paving the way for a risk-adapted therapeutic approach.17,18
In surprising contrast, the slide-based PCLI that had hitherto been an extremely powerful independent prognosticator in different settings (newly diagnosed, relapsed, pretransplantation or posttransplantation, and chronic stable plateau phase) was found to be a relatively ineffective prognosticator in patients with newly diagnosed MM receiving novel therapies.19-22 This important finding requires verification in a prospective manner but could have several implications. Although it may be imprudent to completely disregard the degree of proliferation of plasma cells measured by PCLI at diagnosis in a patient in whom a novel agent is initiated, it is particularly important to individually assess the magnitude of impact of each novel agent on PCLI. These findings are additionally corroborated by our recent analysis demonstrating the inability of thalidomide, but not lenalidomide, to overcome the adverse prognostic impact of PCLI at a cutoff of 1% or greater.23 Our study does not take into account the impact of individual novel agents.
A recent retrospective analysis of 100 patients with newly diagnosed MM who received lenalidomide as initial therapy demonstrated that those with high-risk features as defined by mSMART have a shorter progression-free survival compared with standard-risk patients (36 months vs 18 months). However, a lack of survival difference between the 2 groups could reflect the contribution of subsequent novel agent-based salvage therapies particularly initiated in the high-risk group.24
Despite the limitations of a retrospective analysis, our findings question the significance of observer-dependent slide-based PCLI as an independent prognosticator at a cutoff of 3% or greater with newer therapies. Whether adoption of a more sensitive flow cytometric determination of the proportion of actively proliferating plasma cells would be useful with such agents remains to be seen. Although increasing the PCLI discriminant factor to greater than the currently proposed 3% theoretically appears to be an option, its utility would be diminished because most patients with newly diagnosed MM have PCLI below the 3% cutoff. However, these findings also do not rule out any long-term impact of the PCLI and require further follow-up.
Our study has reinforced the importance of using CG and FISH, both of which appear to be independent prognosticators at diagnosis and complement each other for risk analysis. Although the karyotypic abnormalities are extremely useful in determining the ploidy status and chromosomal 13 abnormalities (both monosomy and interstitial deletion), interphase FISH assays have been particularly helpful in assessing IgH translocations, 17p13 deletions in addition to the numeric chromosomal abnormalities. The impact of each high-risk feature has been extensively evaluated individually in previous studies and therefore was not reassessed in the current study.
CONCLUSION
Our results indicate that, in patients with newly diagnosed MM predominantly treated with immunomodulator-based initial therapy, the best assessment of prognosis is achieved by performing both metaphase CG and FISH. Despite the introduction of novel agents, FISH and CG remain independent prognostic tools in the current model. Our model identifies a group of “high-risk” patients who, on the basis of recent studies, require bortezomib-based initial therapy targeting sustained complete response as a treatment goal. In contrast, “standard-risk” patients identified in this model can be treated with either immunomodulator- or bortezomib-based initial therapy.18,25-28 We advocate the use of both CG and FISH for risk assessment of patients with newly diagnosed MM until high-risk signatures defined by gene expression profiling become more widely available for clinical practice.29 However, given the fact that FISH allows identification of a larger proportion of high-risk patients compared with CG, the former should be given priority if only one of the tests can be performed for any reason.
Footnotes
This work was supported by grants CA107476 and CA62242 from the National Cancer Institute, National Institutes of Health, Bethesda, MD.
REFERENCES
- 1.Kumar SK, Rajkumar SV, Dispenzieri A, et al. Improved survival in multiple myeloma and the impact of novel therapies. Blood 2008;111:2516-2520 [DOI] [PMC free article] [PubMed] [Google Scholar]
- 2.Stewart AK, Bergsagel PL, Greipp PR, et al. A practical guide to defining high-risk myeloma for clinical trials, patient counseling and choice of therapy. Leukemia 2007;21:529-534 [DOI] [PubMed] [Google Scholar]
- 3.Kyle RA, Gertz MA, Witzig TE, et al. Review of 1027 patients with newly diagnosed multiple myeloma. Mayo Clin Proc. 2003;78:21-33 [DOI] [PubMed] [Google Scholar]
- 4.Fonseca R, Barlogie B, Bataille R, et al. Genetics and cytogenetics of multiple myeloma: a workshop report. Cancer Res. 2004;64:1546-1558 [DOI] [PubMed] [Google Scholar]
- 5.Greipp PR, San Miguel J, Durie BG, et al. International staging system for multiple myeloma. J Clin Oncol. 2005;23:3412-3420 [DOI] [PubMed] [Google Scholar]
- 6.Dispenzieri A. An internationally recognized uniform cytogenetic classification system is needed for multiple myeloma. Leukemia 2007;21:9-11 [DOI] [PubMed] [Google Scholar]
- 7.Avet-Loiseau H. Role of genetics in prognostication in myeloma. Best Pract Res Clin Haematol. 2007;20:625-635 [DOI] [PubMed] [Google Scholar]
- 8.Gutierrez NC, Castellanos MV, Martin ML, et al. Prognostic and biological implications of genetic abnormalities in multiple myeloma undergoing autologous stem cell transplantation: t(4;14) is the most relevant adverse prognostic factor, whereas RB deletion as a unique abnormality is not associated with adverse prognosis. Leukemia 2007;21:143-150 [DOI] [PubMed] [Google Scholar]
- 9.Rajkumar SV, Buadi F. Multiple myeloma: new staging systems for diagnosis, prognosis and response evaluation. Best Pract Res Clin Haematol. 2007;20:665-680 [DOI] [PubMed] [Google Scholar]
- 10.Rajkumar SV, Fonseca R, Dewald GW, et al. Cytogenetic abnormalities correlate with the plasma cell labeling index and extent of bone marrow involvement in myeloma. Cancer Genet Cytogenet. 1999;113:73-77 [DOI] [PubMed] [Google Scholar]
- 11.Greipp PR, Kumar S. Plasma cell labeling index. Methods Mol Med. 2005;113:25-35 [DOI] [PubMed] [Google Scholar]
- 12.Dispenzieri A, Rajkumar SV, Gertz MA, et al. Treatment of newly diagnosed multiple myeloma based on Mayo Stratification of Myeloma and Risk-adapted Therapy (mSMART): consensus statement. Mayo Clin Proc. 2007;82:323-341 [DOI] [PubMed] [Google Scholar]
- 13.Kastritis E, Zervas K, Symeonidis A, et al. Improved survival of patients with multiple myeloma after the introduction of novel agents and the applicability of the International Staging System (ISS): an analysis of the Greek Myeloma Study Group (GMSG). Leukemia 2009;23:1152-1157 [DOI] [PubMed] [Google Scholar]
- 14.Zhan F, Barlogie B, Mulligan G, Shaughnessy JD, Jr, Bryant B. High-risk myeloma: a gene expression based risk-stratification model for newly diagnosed multiple myeloma treated with high-dose therapy is predictive of outcome in relapsed disease treated with single-agent bortezomib or high-dose dexamethasone. Blood 2008;111:968-969 [DOI] [PMC free article] [PubMed] [Google Scholar]
- 15.Zhan F, Huang Y, Colla S, et al. The molecular classification of multiple myeloma. Blood 2006;108:2020-2028 [DOI] [PMC free article] [PubMed] [Google Scholar]
- 16.Barlogie B, Pineda-Roman M, van Rhee F, et al. Thalidomide arm of total therapy 2 improves complete remission duration and survival in myeloma patients with metaphase cytogenetic abnormalities. Blood 2008;112(8):3115-3121 [DOI] [PMC free article] [PubMed] [Google Scholar]
- 17.Jagannath S, Richardson PG, Sonneveld P, et al. Bortezomib appears to overcome the poor prognosis conferred by chromosome 13 deletion in phase 2 and 3 trials. Leukemia 2007;21:151-157 [DOI] [PubMed] [Google Scholar]
- 18.San Miguel JF, Schlag R, Khuageva NK, et al. Bortezomib plus melphalan and prednisone for initial treatment of multiple myeloma. N Engl J Med. 2008;359:906-917 [DOI] [PubMed] [Google Scholar]
- 19.Greipp PR, Katzmann JA, O'Fallon WM, Kyle RA. Value of β2-microglobulin level and plasma cell labeling indices as prognostic factors in patients with newly diagnosed myeloma. Blood 1988;72:219-223 [PubMed] [Google Scholar]
- 20.Greipp PR, Lust JA, O'Fallon WM, Katzmann JA, Witzig TE, Kyle RA. Plasma cell labeling index and β2-microglobulin predict survival independent of thymidine kinase and C-reactive protein in multiple myeloma. Blood 1993;81:3382-3387 [PubMed] [Google Scholar]
- 21.Kapoor P, Snozek C, Colby CL, et al. Incorporation of the plasma cell labeling index into the international staging system of multiple myeloma: impact on prognostic value [abstract 8591]. J Clin Oncol. 2008;26(May 20 suppl). [Google Scholar]
- 22.Steensma DP, Gertz MA, Greipp PR, et al. A high bone marrow plasma cell labeling index in stable plateau-phase multiple myeloma is a marker for early disease progression and death. Blood 2001;97:2522-2523 [DOI] [PubMed] [Google Scholar]
- 23.Kapoor P, Kumar S, Greipp PR, et al. Prognostic impact of the plasma cell labeling index (LI) in newly diagnosed myeloma patients treated with thalidomide-dexamethasone (Thal/Dex) or lenalidomide-dexamethasone (Len/Dex) [abstract 1729]. Blood 2008;112 17890457 [Google Scholar]
- 24.Kapoor P, Kumar S, Fonseca R, et al. Impact of risk stratification on outcome among patients with multiple myeloma receiving initial therapy with lenalidomide and dexamethasone. Blood 2009;114:518-521 [DOI] [PMC free article] [PubMed] [Google Scholar]
- 25.Barlogie B, Anaissie E, Haessler J, et al. Complete remission sustained 3 years from treatment initiation is a powerful surrogate for extended survival in multiple myeloma. Cancer 2008;113:355-359 [DOI] [PubMed] [Google Scholar]
- 26.Haessler J, Shaughnessy JD, Jr, Zhan F, et al. Benefit of complete response in multiple myeloma limited to high-risk subgroup identified by gene expression profiling. Clin Cancer Res. 2007;13:7073-7079 [DOI] [PubMed] [Google Scholar]
- 27.Pineda-Roman M, Zangari M, Haessler J, et al. Sustained complete remissions in multiple myeloma linked to bortezomib in total therapy 3: comparison with total therapy 2. Br J Haematol. 2008;140:625-634 [DOI] [PMC free article] [PubMed] [Google Scholar]
- 28.Shaughnessy JD, Zhou Y, Haessler J, et al. TP53 deletion is not an adverse feature in multiple myeloma treated with total therapy 3. Br J Haematol. 2009;147:347-351 [DOI] [PMC free article] [PubMed] [Google Scholar]
- 29.Shaughnessy JD, Jr, Zhan F, Burington BE, et al. A validated gene expression model of high-risk multiple myeloma is defined by deregulated expression of genes mapping to chromosome 1. Blood 2007;109:2276-2284 [DOI] [PubMed] [Google Scholar]


