Abstract
Human Epithelial Ovarian Cancer (EOC) is the most lethal neoplasm affecting the female genital tract, characterized by overexpression of vascular endothelial growth factor (VEGF) and growth as ascites. Anti-VEGF strategies are currently used in EOC therapy with promising results; however, molecular targeting of specific VEGF receptors on the cancer cells themselves has not been explored to date. We previously demonstrated activation of a VEGF/VEGFR2 signaling loop in EOC cells supports their survival in suspension, and short-term pharmacological inhibition of this loop increased EOC cell apoptosis in vitro. Here, we stably knocked down VEGFR2 in OVCAR-3 and SKOV-3 EOC cells using short hairpin RNA, an RNA interference strategy that could potentially overcome chemoresistance arising with angiogenic inhibitors. Unexpectedly, we observed an induction of more aggressive cellular behavior in transfected cells, leading to increased growth in mouse xenografts, enhanced accumulation of ascites, increased VEGF and neuropilin-1 (NRP-1) expression and decreased expression of adhesion proteins, notably cadherins and integrins. Sonic hedgehog (SHH) pathways do not appear to be involved in the upregulation of NRP-1 message in VEGFR2 knockdown cells. Supporting our mouse model, we also found a significant increase in the ratio between NRP-1 and VEGFR2 with increasing tumor grade in 80 cases of human EOC. The change in EOC behavior we report here occurred independent of the angiogenic response and speaks to the direct impact of VEGF blockade on the cancer cells themselves. Our findings highlight the possible confounding events that may impact the usefulness of RNAi in a therapeutic setting for disrupting EOC cell survival in ascites.
Keywords: Adhesion, Ascites, Cadherin, Integrin, neuropilin-1, shRNA, VEGFR2
INTRODUCTION
Epithelial Ovarian Carcinoma (EOC) is the most prevalent form of ovarian cancer, accounting for nearly 90% of all ovarian tumors (1). EOC has an overall poor survival rate, primarily because the majority of patients are diagnosed at an advanced stage and most patients relapse and develop chemoresistance (2, 3). The angiogenic molecule vascular endothelial growth factor (VEGF) is more highly expressed in malignant versus benign ovarian tumors and associated with tumorigenicity and cancer progression (3–5). Anti-VEGF therapies reduce tumor growth and ascites burden and enhance survival in murine models of EOC (6–8), and treatment with the VEGF antagonist bevacizumab (Avastin) prolonged survival in mice when used as maintenance therapy after a complete response to cisplatin-based chemotherapy (9). Several human Phase II trials demonstrated significant activity in EOC when bevacizumab was used as a single agent, suggesting that the blockade of VEGF signaling may prove effective in clinical disease. However, response rates were variable. For example Cannistra et al. (11) evaluated bevacizumab in a highly resistant patient population and reported a clinical response rate of approximately 16% while other groups report a response rate of 21% (10–12). Recent pre-clinical studies demonstrate that anti-angiogenic inhibitors can cause opposing effects on tumor growth and metastasis, depending on tumor stage and treatment duration (13–15). Taken together, these findings highlight the potential for undesirable outcomes under prolonged VEGF signaling blockade in EOC.
VEGF molecules have overlapping abilities to interact with their cell surface receptors, a family of receptor tyrosine kinases of which VEGFR2 is considered the main angiogenic receptor via its mediation of the growth and permeability actions of VEGF (16). Neuropilin-1 (NRP-1) and 2 are co-receptors for VEGFR2 help to enhance the angiogenic signal (17). Higher levels of NRP-1 expression by cancer cells directly correlated with increasing malignancy and oncogenesis in ovarian cancer, and suppressing NRP-1 using RNAi reduced cell growth and invasion of SKOV-3 cells in vitro (18). NRP-1 is also a receptor for L1 adhesion molecule, which might support the growth and proliferation of ovarian cancer cells in ascites and solid tumors (19). Gene silencing with RNA interference is a promising new anti-neoplastic approach via its ability to target important genes and it has been used to specifically knock down VEGF isoforms in ID8 malignant mouse epithelial ovarian cells (20).
We recently showed that short term pharmacological inhibition of VEGFR2 signaling in EOC cells reduced survival in suspension cultures in vitro (21) which motivated us to examine the impact long term dampening of this signal pathway by stable reduction in the expression of VEGFR2. Here we used the human chemoresistant EOC cell lines OVCAR-3 and SKOV-3 to generate stable transfected clones employing two different short hairpin RNA sequences targeting KDR. Contradictory to what has been reported with VEGF/VEGFR2 inhibitors and to what we expected, EOC cells with RNAi induced VEGFR2 knockdown showed overexpression of VEGF in suspension, and grew more successfully as intrapertitoneal ascites and as subcutaneous tumors in immune deficient mice. They also displayed altered cell adhesion and adhesion molecule expression and an inverse relationship between levels of VEGFR2 and its co-receptor NRP-1. Sonic hedgehog (SHH) pathways do not appear to be involved in this upregulation of NRP-1 message in VEGFR2 knockdown cells. Supporting our mouse model, we found a significant increase in the ratio between NRP-1 and VEGFR2 expression with increasing tumor grade in 80 cases of human EOC. Our results reveal additional evidence for the interaction between VEGF pathway molecules in ovarian cancer cells, and demonstrate potential limitations of applying specific VEGFR molecular blockade in a therapeutic setting.
MATERIALS AND METHODS
Cell Culture
The human epithelial ovarian cancer cell lines, NIH: OVCAR-3 and SKOV3 were purchased from American Type Culture Collection (Manassas, VA, USA). Cells were grown in DME medium (Sigma-Aldrich, Oakville, ON, Canada) supplemented with 10% heat-inactivated fetal bovine serum, 50 μg/mL gentamicin and 1 mmol/L sodium pyruvate, at 37°C in a humidified atmosphere containing 5% CO2.
Suspension cultures and ELISA
For survival in suspension as single cells, cells were plated on 100 mm dishes coated with 1% agarose. (Fisher, Toronto, ON, Canada) at a very low density (~ 50 cells/10 cm plate) in 5 ml of growth media, and kept without disruption for up to 7 days in three independent experiments. For anchorage-independent culture of spheroids, 5 × 10⁶ cells were seeded in flat-bottomed, 48 well plates previously coated with 1% agarose and cultured for 4–5 days in DME medium supplemented with 10% FBS. Conditioned media from suspension cultures was collected and subjected to quantification by ELISA for human specific VEGF-A following the manufacturer’s protocol (R & D Systems, Minneapolis, MN, USA).
Short-term inhibition of VEGFR2
For short-term inhibition of VEGFR2 signaling, the small molecule tyrosine kinase inhibitor ZM323881 hydrochloride (Tocris Bioscience, Ellisville, MS, USA) was used as previously reported (21). ZM inhibitor was diluted in DMSO and added in a final concentration of 5 nM; identical volumes of DMSO were added as control. The media were changed and fresh inhibitor was added every three days. Conditioned media samples were collected after 5 and 10 days and were used to quantify VEGF produced by the cells using VEGF ELISA as described above. Samples from at least two independent experiments were tested in triplicates or quadruplicates.
VEGFR2 Transient Knockdown
We used two different RNAi sequences: siRNAKDR1, a sequence which has shown efficient knockdown of VEGFR2 in endothelial cells in a previous report (22) and siRNAKDR5, a sequence which was designed specifically for human KDR gene (accession number NM002253). Both RNAi sequences were purchased from Dharmacon (Chicago, IL, USA). The two sequences were:
siRNA KDR1 5′-GCGGCTACCAGTCCGGATA-3′
siRNA KDR5 5′-GGAAATCTCTTGCAAGCTA-3′.
Ten thousand OVCAR-3 cells were grown for 24 hours on sterile round glass coverslips in a 12 well plate in 1 ml of complete growth media. The cells were washed with PBS and 900 μl of Opti-MEM Reduced Serum Medium (GIBCO-BRL, Burlington, ON, Canada) were added to each well, a 100 μl mixture siRNA duplex mixed with Lipofectamine-2000 (Invitrogen, Burlington, ON, Canada) was added in different concentrations, and Lipofectamine without siRNA duplexes was used as negative control. The cells were incubated for 48 hours, and coverslips were removed gently and placed on slides for immunofloresence staining.
shRNA Cloning and Transfection
OVCAR-3 cells were initially transfected with plasmid expressing enhanced green fluorescence protein pEGFP-N1 (BD Biosciences, Mississauga, ON, Canada) as a reporter for successful stable transfection and to locate transfected cells in vivo. Stable shRNA transfections of OVCAR-3 and SKOV-3 with shRNA sequences were designed and cloned according to pSilencer 4.1-CMV hygro kit from Ambion RNA company (Austin, TX, USA). shRNA sequences were: shRNAKDR1:
Top strand: 5′GATCCGCGGCTACCAGTCCGGATATTCAAGAGATATCCGGACTGGTAGCCGCTTA-3′.
Bottom strand:5′AGCTTAAGCGGCTACCAGTCCGGATATCTCTTGAATATCCGGACTGGTAGCCGCG-3′
shRNAKDR5:
Top strand: 5′GATCCGGAAATCTCTTGCAAGCTATTCAAGAGATAGCTTGCAAGAGATTTCCCAA-3′.
Bottom strand:5′AGCTTTGGGAAATCTCTTGCAAGCTATCTCTTGAATAGCTTGCAAGAGATTTCCG-′3.
Single stranded shRNA sequences were annealed and ligated to the CMV-driven siRNA expression vector pSilencer4.1-CMV with ampicillin and hygromycin resistance genes (Ambion), transformed to DH5a E. coli. Positive clones were selected for growth by adding 150 mg/ml ampicillin to the bacterial broth media, and the plasmids were isolated using Qiagen purification kit (Mississauga, ON, Canada), and sequenced. Plasmids were then transfected into OVCAR-3 cells using Lipofectamine 2000 reagent (Invitrogen) according to the manufacturer’s protocol and stable tranfectants resistant to 40 mg/ml hygromycin selecting OVCAR-3 and 100 mg/ml to select SKOV-3, single clones were selected by limited dilution cloning.
Indirect Immunofluorescence
Frozen sections were fixed in 4% paraformaldehyde for 12 minutes at room temperature and washed with PBS. For VEGFR2 detection, slides were washed 3 times with 0.1% Triton-X-100 solution, blocked with 2% BSA (Sigma-Aldrich) and 4% normal goat serum for 30 minutes, and incubated overnight at 4°C with an anti-VEGFR2 antibody (1:100 cell Signaling Technology Boston MA, U.S.A). After PBS wash, slides were incubated for 30 minutes in a 1:400 dilution of either Alexa Fluor 488 (Invitrogen) or Cy3-conjugated secondary antibody (Jackson ImmunoResearch Laboratories, Inc. West Grove, PA, USA) followed by a nuclear counter-staining with DAPI (4′,6-diamidino-2-phenylindole), and mounted in DakoCytomation Fluorescent Mounting Medium (Dako; Warrington, PA, USA).
Immunohistochemistry
Tissue samples were fixed in 10% neutral buffered formalin, and embedded in paraffin. Sections were cut, mounted, deparaffinized, and rehydrated prior to immunostaining. Endogenous peroxidase was quenched by incubating the slides in 3% H2O2 for 10 min. After blocking with 4% normal goat serum the sections were incubated with the primary antibody solution (1:800 dilution for GFP; Cell Signaling Technology; 1:100 dilution of both VEGFR2 and NRP1; or 1:100 dilution of goat anti-CD31; Santa Cruz Biotechnology, Santa Cruz, CA, USA) at 4°C overnight. After washing in PBS and incubation with biotinylated secondary antibody (1:200 goat anti-rabbit or 1:100 horse anti-goat; Vector Laboratories, Burlingame, CA, USA) for 1 h at room temperature, slides were rinsed and treated with R.T.U. Vectastain Elite ABC reagent (Vector), and the reaction product was developed by incubating slides with 3,3-diaminobenzidine (DAB) for 5 min followed by counterstaining with Mayer’s hematoxylin solution (Sigma-Aldrich). The slides were dehydrated and mounted. Primary antibodies were replaced with PBS as negative control
Western Blotting
Cell lysates were evaluated for protein expression using western blots of native or immunoprecipitated samples. Antibodies to the following were used: VEGFR2, p-AKT, p-ERK, p-MAPK, MAPK, p- FAK, FAK, SHH, Gli-1, E-Cadherin, β-actin and α-tubulin; (Cell Signaling Technology), VEGFR1 (Abcam, Cambridge, MA, USA) NRP-1 Santa Cruz Biotechnology, CA, USA), phosphVEGFR1 (Upstate, Billerica, MA, USA) β3, β1, α5 integrins, N- cadherin and β-catenin (BD Biosciences, Mississauga, ON, Canada) POD conjugated secondary antibody and BM Chemiluminescence Western Blotting Substrate was used to visualize bands.
Quantitative and Semiquantitative PCR
Total RNA was isolated from the different cell lines using Tri-pure reagent (Roche, Madison, WI, U.SA) Reverse transcription was performed using the SuperScript III First-Strand Synthesis System (Invitrogen), and semiquantitative PCR reactions were conducted to ensure that the PCR conditions were at the logarithmic phase of the reaction for each set of primers, Actin amplification was used as a reference gene for equal loading and the resulting PCR products were analyzed by agarose gel electrophoresis. Quantitative real-time PCR was performed with LightCycler FastStart DNA Master SYBR Green I kit, using the LightCycler 3 (Roche). The PCR conditions were as follows: 95°C for 10 min, followed by 45 cycles of denaturation at 95°C for 10 s, annealing at 60°C for 10 s, and elongation at 72°C for 10 s. After the end of the last cycle, the melting curve was generated by beginning fluorescence acquisition at 72°C and taking measurements every 0.1°C until 95°C was reached. Samples were run in triplicate and the experiment was repeated twice with two different c-DNA samples generated from two RNA isolations. The relative fold change 2 −ΔΔCT method was used to determine the relative quantitative gene expression compared with beta-Actin. The sequence of primers used were NRP-1(23):
HNRP-F:′5-GCACGTGATTGTCATGTTCC-3′.
HNRP-R:′5-GGTGGATGAATGTGATGACG-′3
And the primers used for beta Actin were:
HBETA-ACTINF′5-AAGATCAAGATCATTGCTCCTC-′3
HBETA-ACTINR ′5CAACTAAGTCATAGTCCGCC-′3.
In Vivo Experiments
All animal studies were performed according to guidelines of the Canadian Council for Animal Care (CACC) and supervised by the University of Guelph local Animal Care Committee. Female RAG1 null mice (24) were inoculated intraperitoneally with 1 × 10⁷ OVCAR-3 shRNA cells. After 90 days, the mice were euthanized, and the ascites fluid and suspended cells were collected for further analysis. 5 × 10⁶ cells were injected subcutaneously into additional female RAG1 null mice, and the tumors measured twice weekly. Animals were euthanized by CO2 asphyxia and cervical dislocation and tissues collected for further analysis.
Ovarian Cancer Tissue Microarray and Immunostaining
Tissue microarray slides (US Biomax Rockville, MD, USA) had 80 cores, (single core per case), including 63 cases of serous papillary cystadenocarcinoma, 13 mucous papillary cystadenocarcinoma, 3 endometrioid adenocarcinoma and 1 clear cell carcinoma. The slides were de-paraffinized and IHC staining with VEGFR2 and NRP-1 was performed as described above. A score from 1 to 10 was assigned in a blinded fashion to describe the intensity of staining of the epithelial cancer cells in each core, and the ratio between NRP-1 score and VEGFR2 score calculated for each tissue core. Cells and tissues were immunostained according to standard protocols using the following primary antibodies from Cell Signaling Technology: anti-GFP; anti-VEGFR2 and anti-NRP-1, followed by fluorochrome or enzyme labeled secondary antibodies.
AlamarBlue Proliferation Assay
Cell proliferation was determined using alamarBlue Assay (BioSource Invitrogen), following the manufacturers’ protocol. Briefly, 1.5–3 × 10⁴ cells were seeded in 96 well plates in normal growth medium. 24 hrs later, cells were washed twice with DMEM, then 100 μl serum-free DME medium was added to each well. After 24 hrs, alamarBlue reagent was added to each well in a final concentration of 10%. After incubation, the absorbance at 570 and 630 nm was determined, and alamarBlue reduction was calculated based on manufacturer’s instructions. Each experiment was repeated at least twice in quadruplicates.
Statistical Analysis
Statistically significant differences were determined by two-tailed unpaired Student’s t test and one-way ANOVA and were defined as p < 0.05. All experiments were repeated independently at least three times.
RESULTS
Inverse Relationship between VEGFR2 Expression and NRP-1 in EOC Cells
siRNA duplexes targeting VEGFR2 knocked down protein levels in transient transfection (Figure 1a). Stable shRNA transfected clones (5 per construct) were screened for VEGFR2 expression via western blot. All shRNAKDR1 clones were effective in silencing the expression of KDR while some shRNAKDR5 clones showed less knockdown efficacy compared to controls (Figure 1b). We consistently used clone shRNAKDR1-1 (95% VEGFR2 knockdown) and clone shRNAKDR5-3 (50% VEGFR2 knockdown) in order to evaluate the effect of different levels of VEGFR2 on cell function. The VEGFR2 co-receptor NRP-1 is weakly expressed in OVCAR-3 cells, but was up-regulated (mRNA and protein) in shRNAKDR clones, at a level inversely proportional to the VEGFR2 knockdown (Figure 1c and d). NRP-2 was also expressed by OVCAR-3 cells, but levels did not alter with VEGFR2 knockdown (not shown).
Figure 1.
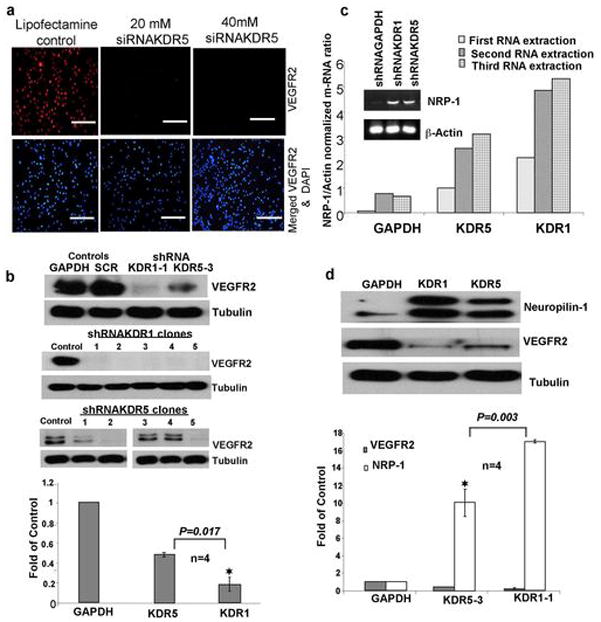
VEGFR2 Knockdown and its Consequences. (a) Immunofluorescence staining of OVCAR-3 cells transiently transfected with 21 nucleotide siRNAKDR, scale bars = 100 μm. (b) Upper Western blot shows stable knockdown of VEGFR2 in OVCAR-3/GFP cells transfected with stable shRNA against two KDR sequences (KDR1, KDR5) and both controls (GAPDH and scrambled SRC), middle and lower panels: western blots showing VEGFR2 levels in 5 clones from each shRNA construct. Graph shows Mean (SEM) for densitometry readings from four different independent blots from clone 3 of shRNAKDR5 and clone 1 of shRNAKDR1. These clones were used for the subsequent experiments. (c) Ethidium bromide stained agarose gel of semi-quantitative RT-PCR reveals barely detectable levels of NRP-1 in parent OVCAR-3 cells, and enhanced levels in both KDR transfected shRNA cells. Graph of quantitative RT-PCR confirms that shRNAKDR cells express increased levels of NRP-1 compared to GAPDH control. (d) Western blot showing NRP-1 protein expression levels are higher in shRNAKDR knockdown OVCAR-3 cells inversely proportional to the extent of VEGFR2 knockdown compared to GAPDH control. The graph shows the inverse relationship between the expression of VEGFR2 and NRP-1; results are the Mean ± SEM of densitometry readings representing the knockdown of VEGFR2/NRP-1 from three different blots.
The Consequences of VEGFR2 Knockdown on Down Stream Signaling Proteins
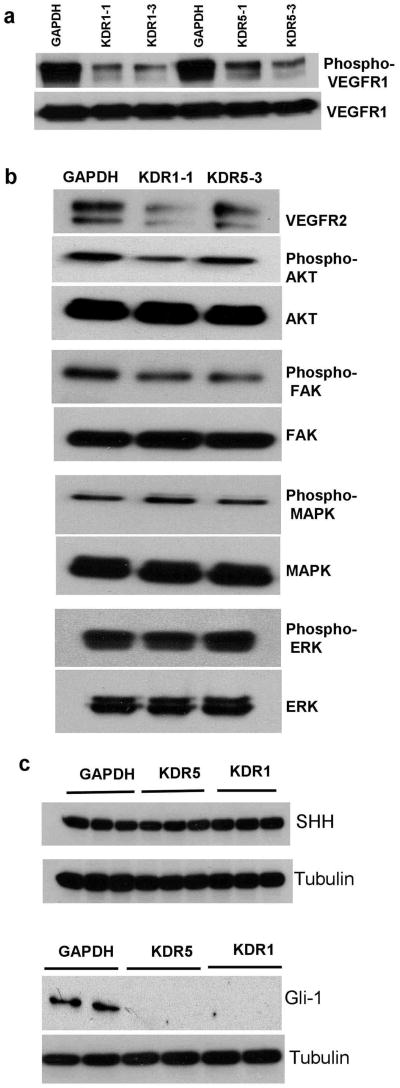
Throughout this study we used control cells containing shRNA targeting GAPDH or the scrambled sequence to test for off target effects upon VEGFR2 reduction by shRNA, and we found no change on VEGFR1 or any other examined protein in both cell lines. shRNA VEGFR2 knockdown had no effect on VEGFR1 protein levels, but reduced the levels of VEGFR1 phosphorylation (Figure 2a). VEGFR2 knockdown with transient siRNA transfection is reported to not influence the abundance of VEGFR1 in normal bovine aortic endothelial cells (25). VEGFR3 expression at the protein level was weak in the parental cells, and did not increase with VEGFR2 knockdown (not shown). We found a slight alteration in phosphorylation of protein kinase B (AKT) and focal adhesion kinase (FAK), but no change in phosphorylated mitogen-activated protein kinase (MAPK) nor externally regulated kinase (ERK) levels upon VEGFR2 knockdown in these cells (Figure 2b). This is consistent with previous reports that the AKT and MAPK pathways are constitutively activated in OVCAR-3 cells.
Figure 2.
Changes in the expression of downstream signaling proteins and Gli-1 transcriptional factor upon KDR blockade. (a) Western blot showing expression levels and phosphorylation status of VEGFR1. VEGFR2 knockdown produced no change in VEGFR1 levels but concomitant decreases in its phosphorylation, compared to shRNAGAPDH controls. Two clones of each transfection are shown. (b) Western blot showing that VEGFR2 knockdown reduced levels of phosphorylated AKT and FAK, but did not change levels of phosphorylated ERK nor phosphorylated MAPK. (c) Upper panel: western blot showing no change in SHH protein expression in three clones of each KDR knockdown and control cells. The lower panel of western blot for Gli-1 transcription factor shows down regulation in two different clones of each shRNA transfection without any change in the control transfected shRNAGAPDH cells.
Neuropilin-1 Increase in the shRNAKDR Cells is not Related to Sonic Hedgehog Pathway
In an attempt to delineate the molecular pathway involved in NRP-1 up regulation we examined the sonic hedgehog (SHH) pathway, shown to be activated in renal carcinoma and EOC, since NRP-1 is a known SHH gene target in these cells (26). We observed that while SHH protein was not affected by VEGFR2 levels its downstream transcriptional factor glioma-associated antigen-1 (Gli1) was greatly reduced upon knockdown of VEGR2 (Figure 2c). These results suggest that transcription factors other than Gli1 are behind the changes in NRP-1 levels we see, which opens new areas of investigation into the relationship between Gli-1 and the VEGF signaling pathway.
VEGFR2 Knockdown Affects EOC Growth and Survival
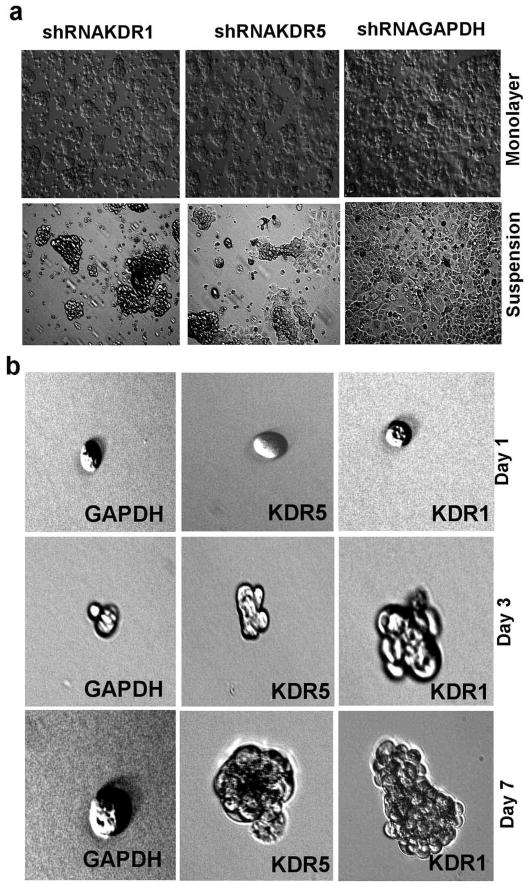
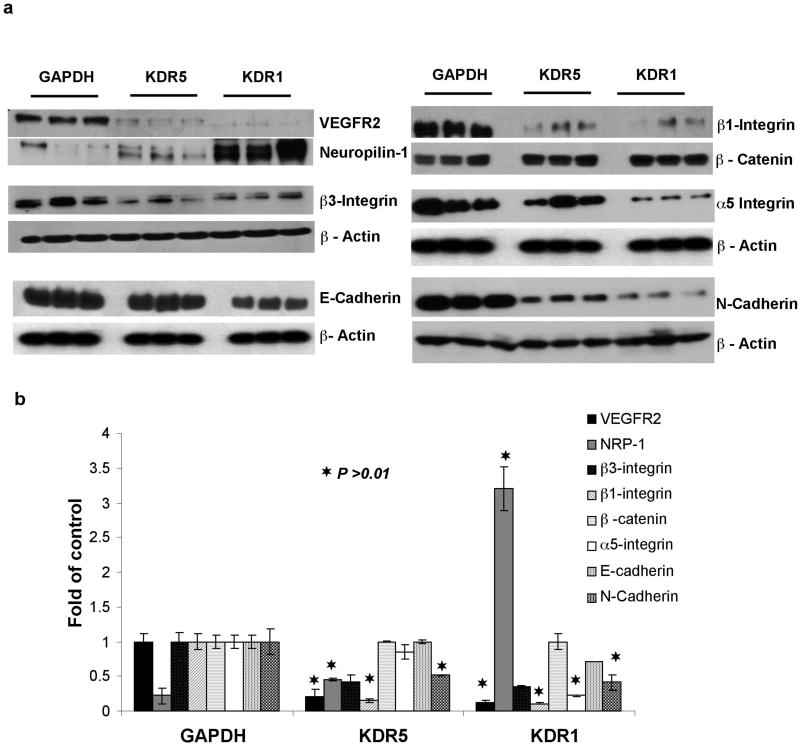
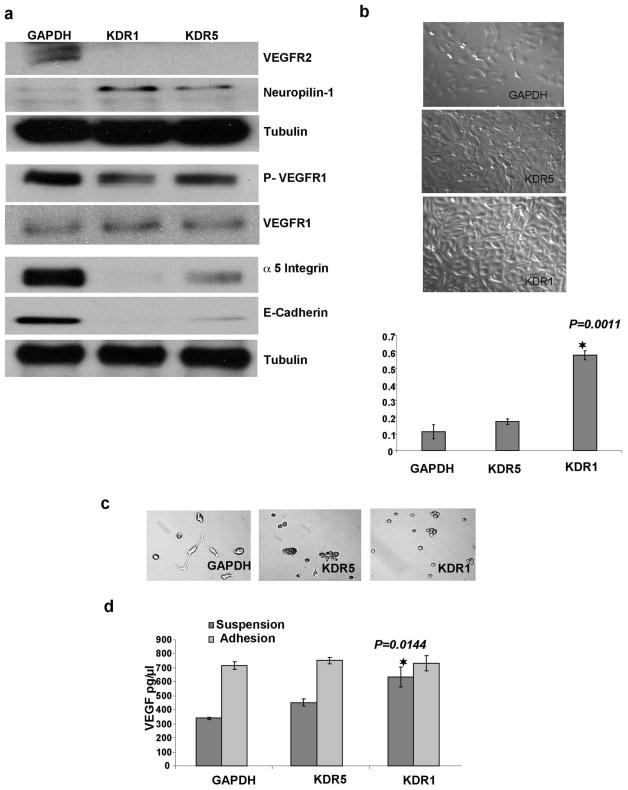
We noticed that shRNAKDR1 and shRNAKDR5 cells showed delayed/reduced attachment to cell culture dishes when compared to shRNAGAPDH cells (Figure 3a). There were no differences in apoptosis (as detected by flow cytometry) between VEGFR2 deficient cells grown as monolayer or in suspension for 48 hours over control transfected cells (Supplementary Material). However, shRNAKDR1 cells showed enhanced survival in clusters during long term culture in suspension, while shRNAKDR5 showed less survival and shRNAGAPDH cells could not survive prolonged loss of adhesion (Figure 3b). This suggests modification of cell-cell and/or cell-matrix adhesion in these knockdown cells. We thus examined the expression levels of adhesion proteins known to be expressed by OVCAR-3 cells (11) and found an inverse relationship between the levels of VEGFR2 and α5, β1, and β3 integrin (Figure 4a and b). There was also an extensive reduction in N-Cadherin and a smaller decrease in E-Cadherin protein upon VEGFR2 knockdown, but no detectable changes in the levels of β-catenin (Figure 4a and b). Another EOC cell line, SKOV-3 subjected to identical VEGFR2 shRNA transfection revealed similar patterns of knockdown and changes in adhesion proteins and NRP-1 gene expression observed in OVCAR-3 cells (Figure 5a–d).
Figure 3.
Change in the expression of adhesion proteins upon the loss of VEGFR2. (a) Phase contrast images of transfected OVCAR-3 cells growing as monolayers in adhesive plates and in flat bottom suspension plates. Images were captured 48 h after cell passage. (b) Single cells growing under suspension conditions for up to 7 days.
Figure 4.
Quantification of adhesion protein changes upon VEGFR2 knockdown. (a) Western blots showing that knockdown of VEGFR2 in OVCAR-3 cells leads to increased NRP-1 protein and concomitant decreased expression of cell-matrix adhesion (β3, β1 and α5 integrins) and cell-cell adhesion (E-cadherin and N-cadherin) proteins compared to GAPDH RNAi cells. (b) Densitometry readings of three independent experiments detecting the expression of the eight proteins in three clones for each construct. Results are shown as Mean ± SEM (n=3). Asterisks indicate significantly different protein levels from GAPDH control cells (p ≤ 0.05).
Figure 5.
shRNA knockdown of VEGFR2/KDR in SKOV-3 EOC cell line has the same effect on cell proliferation and gene expression observed in OVCAR-3 cells. (a) Western blots show increased NRP-1, decrease in p-VEGFR1, no change in native VEGFR1 and decrease in both α5 integrin and E-Cadherin in KDR knockdown cells. (b) Phase contrast images of transfected SKOV-3 grown in monolayer on adhesive plates for 24 hours after passage, shows the enhanced proliferation in KDR knockdown clones. SKOV-3 shRNAKDR1 cells show the highest proliferation and this was confirmed by Alamarblue assay data from three independent replicates (Mean ± SEM). (c) Phase contrast images of SKOV-3 cells grown in low density over 1% agarose (non-adhesive surface). shRNAGAPDH control cells are able to both attach and spread on agarose while adhesion is reduced in shRNAKDR5 and lost in shRNAKDR1. (d) Graph of VEGF ELISA (Mean ± SEM) demonstrates higher VEGF production by SKOV-3 shRNAKDR1 in suspension and not in adhesion compared to shRNAKDR5 and shRNAGAPDH.
VEGF Production in VEGFR2 Knockdown Cells and the Influence of Knockdown on Cell Proliferation
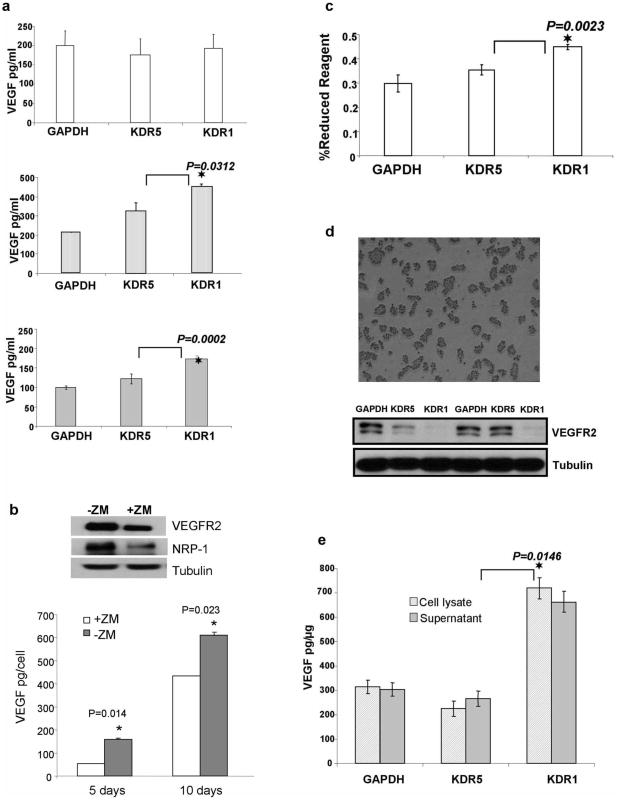
Since stable reduction in VEGFR2 did not result in the expected enhanced anoikis in these EOC cells when grown in suspension, we aimed to see whether this change led to altered VEGF production. There were no significant changes in VEGF secretion for cells growing in adhesion, while cells lacking VEGFR2 growing in single cell suspension and as spheroids secreted significantly more VEGF than control cells (Figure 6a). Short-term pharmacological blockade of VEGFR2 signaling had the opposite effect on VEGF production (Figure 6b). shRNAKDR1 cells also showed a significant increase in proliferation compared to other shRNA clones (Figure 6c).
Figure 6.
Increased VEGF-A production in suspension conditions by VEGFR2 OVCAR-3 knockdown cells. (a) ELISA for VEGF-A (Mean ± SEM) detected no change in the amount of VEGF produced by the three OVCAR-3 transfected constructs growing in adhesive monolayer culture. The middle graph shows a significant increase in the production of VEGF-A by shRNAKDR1 clones growing in suspension and the bottom graph shows a significant increase in VEGF-A production by spheroids formed from shRNAKDR1 cells compared shRNAKDR5 and shKDRGAPDH. (b) Short term blockade of VEGFR2 signaling in OVCAR-3 cells with pharmacological inhibitor ZM323881 lead to reduced expression of VEGFR2, NRP-1 and VEGF. (c) Proliferation assay using AlamarBlue (Mean ± SEM) demonstrates significant cell growth in shRNAKDR1 cells compared to other clones. (d) Upper panel shows ascites (OVCAR-3 cells) collected from the intraperitoneal cavity of mice; bottom panel shows western blot of collected cells, demonstrating the stability of VEGFR2 knockdown in the recovered ascites cells. (e) ELISA results (Mean ± SEM) showing higher VEGF-A production in shRNAKDR1 ascites supernatant and lysed cells recovered from intraperitoneal cavities of injected mice, compared to samples from other stable lines.
VEGFR2 Knockdown Enhanced EOC Intraperitoneal Implantation and Ascites Growth
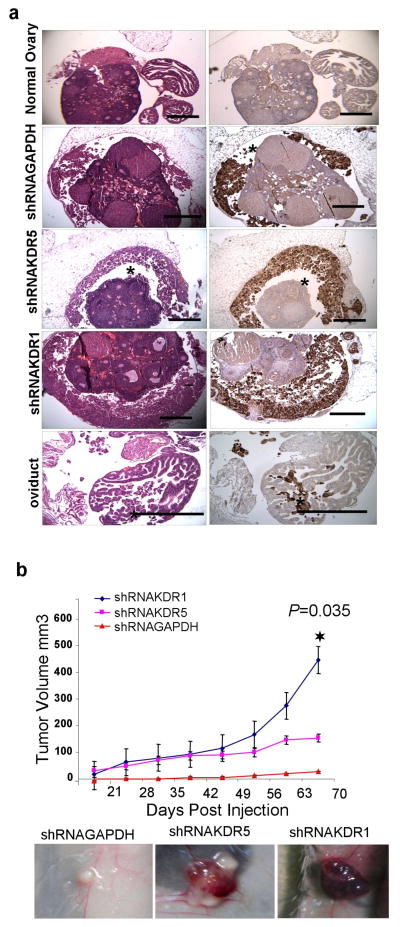
Mice implanted i.p. with OVCAR-3 cells were euthanized after 90 days and ascites fluid and cells collected. Approximately 800 μl/mouse was collected from shRNAKDR1 cell injected mice, 500 μl/mouse from shRNAKDR5 cell injected mice, and 300 μl/mouse from shRNAGAPDH cell injected mice; in all cases, clusters of viable EOC cells with no evidence of apoptotic or necrotic cells were obtained from each ascites (Figure 6d). Lysates of cells from ascites demonstrated the stability of the VEGFR2 knockdown (Figure 6d). We found that ascites from shRNAKDR1 cell injected mice contained 3.6 fold more VEGF compared to that produced by shRNAKDR5 and shRNAGAPDH cells; lysates of recovered cells had similar VEGF levels to supernatant, supporting the concept that the injected OVCAR-3 cells were the main source of the enhanced VEGF produced in the ascitic fluid (Figure 6e). Immunostaining with anti-GFP (to localize transfected OVCAR-3 cells) demonstrated cancer cells surrounding the ovary, located beneath the ovarian bursa, and infiltrating the oviduct in ascites bearing mice (Figure 7a). Mice injected with VEGFR2 knockdown clones showed more extensive sub-bursal infiltration and growth than mice injected with control shRNAGAPDH transfected OVCAR-3 (Figure 7a). These findings suggest that KDR knockdown enhances ascites production and increases the ability of EOC cells to seed the reproductive tract in these mice.
Figure 7.
Effect of KDR knockdown on the malignancy of OVCAR-3 cells in vivo. (a) Adjacent sections of ovaries stained with H&E, and immunostained for GFP to identify injected EOC cells. shRNAGAPDH cells showed modest colonization of ovary bursal space while shRNAKDR5 and shRNAKDR1 cells showed extensive colonization of ovarian bursal space (asterisks). Occasionally, injected EOC cells also infiltrated the oviduct of shRNAKDR1 injected mice. These observations were consistent in all five mice injected per cell type. Reproductive tracts from uninjected mice showed no evidence of cellular infiltration or GFP staining. Scale bar = 500 μm. (b) Tumor growth curves for EOC subcutaneous xenografts, graph showing Mean, ± SEM. During the 12 weeks of the trial, all shRNA KDR injected mice grew tumors (N=5 per group) and tumors from cells with the most extensive KDR knockdown (shRNAKDR1) grew significantly larger than tumors generated from shRNAKDR5. In contrast, when shRNAGAPDH control cells were injected (N=5), only one slow growing tumor formed. Inserts are representative images of the subcutaneous xenografts in situ prior to dissection.
VEGFR2 Knockdown Enhanced EOC Subcutaneous Implantation and Tumor Growth
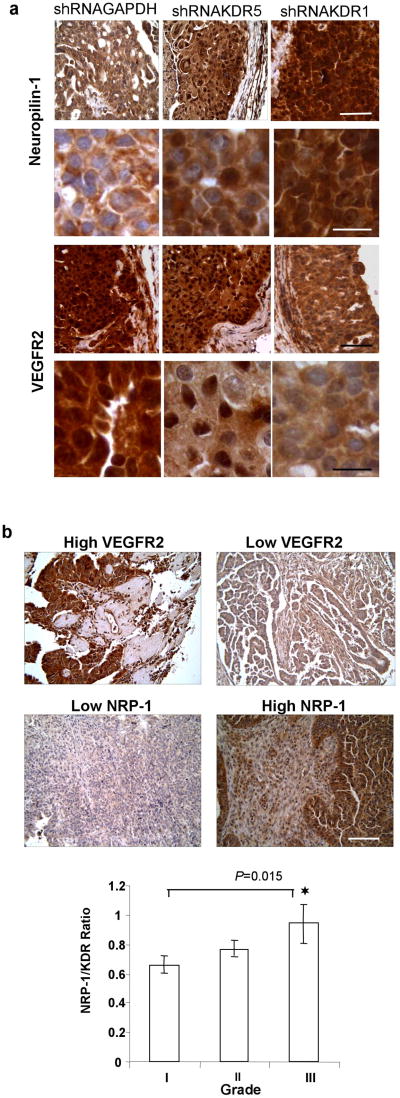
When grown as subcutaneous xenografts OVCAR-3 shRNA clones were characterized by fluid filled cystic tumors. shRNAKDR1 cells produced significantly larger tumors than shRNAGAPDH cells, while tumors produced by shRNAKDR5 cells were intermediate in their growth rate (Figure 7b). Blood vessels density as assessed by CD31 positive vessels was low and did not differ between tumor type (mean ± SD/mm2; shRNAGAPDH tumor: 6.29; shRNAKDR5 tumors: 5.54 ± 3.23; shRNAKDR1 tumors: 5.75 ± 4.3). Immunostaining for NRP-1 and VEGFR2 confirmed that the knockdown phenotype of injected cells was still present in xenograft tumors in vivo. High NRP-1 nuclear and cytoplasmic staining was seen in shRNAKDR1 tumors, with no detectable VEGFR2 staining. Intermediate nuclear and cytoplasmic NRP-1, with nuclear VEGFR2 staining was seen in the shRNAKDR5 tumors, and low cytoplasmic NRP-1 staining combined with robust nuclear and cytoplasmic VEGFR2 staining was seen in the control shRNAGAPDH xenografts (Figure 8a).
Figure 8.
NRP-1 and VEGFR2 immunohistochemistry (a) Tumor sections from shRNAKDR1 xenografts reveal significantly increased staining of NRP-1 and reduced VEGFR2 staining. Upper panels: Low power (top row) and high power (bottom row) images of EOC xenografts stained for NRP-1. Note that tissue from xenografts created from both shRNA transfected cell lines (KDR1 and KDR5) have higher levels of NRP-1 expression compared to control tumor, which shows slight cytoplasmic staining (Scale bar: top row 20 μm; bottom row, 50 μm). Lower panels: Low power (top row) and high power (bottom row) images of EOC xenografts stained for VEGFR2. Note the shift in the expression of VEGFR2 from both cytoplasmic and nuclear in control tumors, to nuclear only in KDR5 tumors to weakly cytosolic in KDR1 tumors. (Scale bar: top row 20 μm; bottom row, 50 μm). (b) Higher NRP-1/VEGFR2 ratio in 80 human clinical EOC biopsies. Representative tissues from Human EOC tissue microarray stained with VEGFR2 or NRP-1 showing the range of expression in human tumor samples. Scale bar = 50 μm. Graph shows ratio of NRP-1:VEGFR2 score from 80 EOC specimens and reveals significantly increasing ratio between tumor grade I and III.
Ratio of NRP-1:VEGFR2 levels increased with Tumor Grade in Human EOC
We found that the ratio between NRP-1 and VEGFR2 staining increased with tumor grade in 80 clinical EOC specimens, and that Grade III tumors had significantly higher NRP-1:VEGFR2 ratios than Grade I tumors (Figure 8b), suggesting that higher NRP-1 expression is directly related to malignancy in our VEGFR2 knockdown OVCAR-3 cells. To the best of our knowledge this is the first demonstration of a correlation between NRP-1:VEGFR2 ratio and human EOC tumor grade. Using the same semi-quantitative scoring system on OVCAR-3 subcutaneous xenografts yielded NRP-1:VEGFR2 ratios of 0.33 (GAPDH cells; N = 1), 1.25 (KDR5 cells; N = 5) and 3.6 (KDR1 Cells; N = 5).
DISCUSSION
Due to the importance of angiogenesis in tumor progression, several therapeutic strategies have been developed to block VEGF signaling; however, the molecular approach of targeting expression of specific VEGF receptors in cancer cells has not been well explored to date. Pharmacological blockade of VEGFR2 shows inhibitory effects on ovarian tumor growth in mice (27), and our recent studies demonstrate an important role of the VEGF/VEGFR2 autocrine loop in protecting EOC cells growing in suspension from anoikis caused by the loss of adhesion (21). Considering that drug resistance as a common problem in EOC and other cancers in general (13), in the present study we examined the effects of permanently disrupting this autocrine loop by abolishing KDR expression in EOC cells.
Peritoneal ascites accumulation in ovarian carcinoma is enhanced by the production of vascular permeability agents, including VEGF (28). Cell survival under conditions of ascites accumulation in the intraperitoneal cavity may be an important contributor to disease progression in patients with EOC. Surprisingly, we found that once KDR was stably knocked down in EOC cells there was a compensatory mechanism supporting cell survival and viability, consistent with the idea that pathways facilitating EOC survival in suspension play an important role in ascites formation.
VEGF, VEGFR2 and NRP-1 drive physiological and pathological angiogenesis and their disruption may inhibit EOC growth. Treatment of mice with a VEGF neutralizing antibody reduced subcutaneous tumor growth of SKOV-3 cells (7). Human KDR specific antibody and/or murine VEGFR2 specific antibody both significantly reduced EOC tumor growth in a mouse model (27). However, suppression of NRP-1 expression using RNAi showed a decrease in the malignant characteristics of transfected SKOV-3 cells, and a reduction in cell proliferation, indicating that persistently high expression of NRP-1 in ovarian cancer enhances proliferation, possibly through evasion of contact inhibition (18). Hence, the enhanced tumorigenicity seen in our VEGFR2 knockdown cells is possibly related to the greatly increased NRP-1 expression, rather than loss of VEGFR2 signaling per se.
NRP-1 is a 130-kDa transmembrane receptor for semaphorins first described in the developing nervous system and expressed on axons of dorsal root ganglia, sensory, and motor neurons (29). The NRP-1 extracellular domain has heparin binding capacity, and heparin enhances the binding of semaphoring 3A and VEGF165 to NRP-1 (30). A soluble form of NRP-1 secreted by PC3 prostate carcinoma, heart, and placental cells can bind VEGF165 but not VEGF121 (17). Although the exact function of NRP-1 in cancer cells is unknown, its expression in different tumors can result in increased malignancy by stimulating angiogenesis through its activation of cell signaling via a PI3-K dependent pathway (31). OVCAR-3 and SKOV-3 cells also express semaphorin 3A (results not shown), thus there may be alternative signaling and binding pathways involving the increased NRP-1 and VEGF expressed and VEGF by our VEGFR2 knockdown cells.
NRP-1 expression was previously detected in 105 epithelial ovarian cancer samples, and levels in carcinomas were significantly greater than in benign tumors (32). Our results are consistent with this; we also found a relationship between the ratio of expression of both NRP-1 and VEGFR2 and human tumor progression. Although NRP-1 acts as a co-receptor for VEGFR2 in tumor angiogenesis, blocking NRP-1 using a specific peptide corresponding to the NRP-1-binding site on VEGF165 induced apoptosis of murine and human breast carcinoma cells, whereas a peptide directed against VEGFR2 had no effect, reflecting the multifunctional role that NRP-1 plays in autocrine anti-apoptotic signaling by VEGF in tumor cells (33).
Another interesting consequence of KDR knockdown in our study was the altered expression of several adhesion molecules. Epithelial-mesenchymal transition contributes to cancer cell plasticity by increasing cell invasiveness and metastatic potential, and is characterized by loss or relocalization of epithelial markers (e.g. E-cadherin, β-catenin) and gain of mesenchymal markers (e.g. N-cadherin, smooth muscle actin) (34). Cadherins are known regulators of cell differentiation, and E-cadherin is the prime mediator of cell-cell adhesion among epithelial cells, including the oviductal, endometrial and cervical epithelia (35). The ovarian surface epithelium (OSE) is a major target tissue for ovarian carcinoma formation and pre-neoplastic ovarian surface epithelial cells are cohesive, non-migratory and express E-cadherin (36). In contrast to most carcinomas that lose E-cadherin expression early in progression, E-cadherin is abundant in primary differentiated EOCs but subsequently decreases during progression to metastasis (37). Thus, loss of E-cadherin expression in our VEGFR2 knockdown cells may also contribute to the increased cellular malignancy we see here. The dual role for N- and E-cadherin and their relationship with VEGFR2 in EOC is unknown and requires further investigation.
The fact that FAK autophosphorylation on tyrosine residue 397 occurs upon its binding to integrins (38) can explain the slight reduction in p-FAK observed in our shRNAKDR cells once integrins are downregulated. Integrins play a major role in tumor growth and metastasis by transducing signals between the ECM and the cell interior. Interaction between VEGFR2 and αvβ3 integrin is necessary for VEGF to signal stress-activated protein kinase-2/p38 in normal endothelial cells undergoing angiogenesis (39). Expression of VEGFR2 and αvβ3 was detected in endothelial cells in SKOV-3 EOC xenografts (40), but to our knowledge, this is the first report of a relationship between VEGFR2 and integrin expression in EOC cells themselves. Our shRNAKDR OVCAR-3 cells showed altered survival in suspension, which was reflected in their ability to form ascites and subcutaneous cystic tumors in vivo. The cells with the greatest VEGFR2 knockdown generated more extensive ascites and specifically colonized the ovarian surface more aggressively. Since VEGFR2 knockdown was proportional to NPR-1 upregulation, it is tempting to speculate that this enhanced malignancy is due, at least in part, to NRP-1 mediated effects.
Tumorigenicity was also inversely correlated with the level of adhesion molecules expressed by each transfected clone. NRP-1 is a receptor for semaphorin 3A, VEGF-A, Galectin-1 and hepatocyte growth factor, and is required for efficient activation of c-Met-dependent pathways that promote cell invasiveness (29, 41). Thus NRP-1 may be a key molecule holding promise for effective EOC therapy. Regulatory elements for NRP-1 transcriptional control are specific and cell-type dependant. For example, in HeLa cells NRP-1 expression is controlled by SP1, AP1 and CCAAT box transcription factors (42), while in neurons E2F1 factor binds directly to the endogenous NRP-1 promoter to positively regulate it expression (43). Production of sonic SHH ligand and pathway activity is related to NRP-1 expression, and NRP-1 knockdown leads to reduced SHH, Gli-1, and E-cadherin production in renal carcinoma cells (26). Similarly, blockade of the SHH pathway leads to reduced expression of E-cadherin, β1 integrin and VEGF in EOC cells (44). In contrast, we found no relationship between SHH levels and NRP-1 expression, and decreased Gli-1, E-cadherin and β1 integrin (but increased VEGF) production associated with NRP-1 upregulation, suggesting a more complex relationship between these pathways in VEGFR2 knockdown EOC cells.
Overall, our findings reveal unique and unanticipated aspects of EOC cell behavior under prolonged molecular blockade of VEGF/VEGFR2 signaling in these cells. Recent pre-clinical studies demonstrate that while VEGF blockade may provide effective control of primary tumors, it can contribute to cancer progression via enhanced invasiveness and hence metastasis (13, 14). RNA interference approaches are currently being tested as potential anti-angiogenic and anti-cancer strategies (45). Our findings highlight possible confounding events that may impact the usefulness of RNAi in a therapeutic setting for disrupting EOC cell survival in ascites.
Acknowledgments
We thank Kanwal Minhas, Steven Patten, Kristen Lacombe, Mackenzie Smith, Christine Hamilton, Karolina Skowronski and Dr. Siranoush Shahrzad for technical assistance, and help in manuscript preparation. We also thank Dr. Alicia Viloria-Petit for helpful advice with manuscript preparation. This study was supported by grants to BLC from the Canadian Institutes of Health Research (grant # MOP 81213) and the Ontario Institute for Cancer Research (grant # 06NOV00232). IS was a recipient of a Canadian Institutes of Health Research postdoctoral fellowship.
GRANT NUMBERS AND SOURCES OF SUPPORT: This study was supported by grants to BLC from the Canadian Institutes for Health Research (grant # MOP 81213) and the Ontario Institute for Cancer Research (grant # 06NOV00232). IS was a recipient of a Canadian Institutes of Health Research postdoctoral fellowship.
NONSTANDARD ABBREVIATIONS
- AKT/PKB
protein kinase B
- DAPI
4′,6-diamidino-2-phenylindole
- EOC
epithelial ovarian cancer
- FAK
focal adhesion kinase
- Gli-1
transcriptional factor glioma-associated antigen-1
- GFP
green fluorescence protein
- KDR
kinase insert domain protein receptor
- MAPK
mitogen activated protein kinase
- NRP-1
Neuropilin 1
- SHH
sonic hedgehog
- VEGF
vascular endothelial growth factor
- VEGFR2
vascular endothelial growth factor receptor- 2
References
- 1.Dinulescu DM, Ince TA, Quade BJ, et al. Role of K-ras and pten in the development of mouse models of endometriosis and endometrioid ovarian cancer. Nat Med. 2005;11:63–70. doi: 10.1038/nm1173. [DOI] [PubMed] [Google Scholar]
- 2.Look M, Chang D, Sugarbaker PH, et al. Long-term results of cytoreductive surgery for advanced and recurrent epithelial ovarian cancers and papillary serous carcinoma of the peritoneum. Int J Gynecol Cancer. 2003;13:764–770. doi: 10.1111/j.1525-1438.2003.13319.x. [DOI] [PubMed] [Google Scholar]
- 3.Bergers G, Hanahan D. Modes of resistance to anti-angiogenic therapy. Nat Rev Cancer. 2008;8:592–603. doi: 10.1038/nrc2442. [DOI] [PMC free article] [PubMed] [Google Scholar]
- 4.Akutagawa N, Nishikawa A, Iwasaki M, et al. Expression of vascular endothelial growth factor and E-cadherin in human ovarian cancer: Association with ascites fluid accumulation and peritoneal dissemination in mouse ascites model. Jpn J Cancer Res. 2002;93:644–651. doi: 10.1111/j.1349-7006.2002.tb01302.x. [DOI] [PMC free article] [PubMed] [Google Scholar]
- 5.Wey JS, Stoeltzing O, Ellis LM, et al. Vascular endothelial growth factor receptors: Expression and function in solid tumors. Clin Adv Hematol Oncol. 2004;2:37–45. [PubMed] [Google Scholar]
- 6.Heuser LS, Taylor SH, Folkman J, et al. Prevention of carcinomatosis and bloody malignant ascites in the rat by an inhibitor of angiogenesis. J Surg Res. 1984;36:244–250. doi: 10.1016/0022-4804(84)90094-5. [DOI] [PubMed] [Google Scholar]
- 7.Mesiano S, Ferrara N, Jaffe RB, et al. Role of vascular endothelial growth factor in ovarian cancer: Inhibition of ascites formation by immunoneutralization. Am J Pathol. 1998;153:1249–1256. doi: 10.1016/S0002-9440(10)65669-6. [DOI] [PMC free article] [PubMed] [Google Scholar]
- 8.Bamberger ES, Perrett CW. Angiogenesis in epithelian ovarian cancer. Mol Pathol. 2002;55:348–359. doi: 10.1136/mp.55.6.348. [DOI] [PMC free article] [PubMed] [Google Scholar]
- 9.Mabuchi S, Terai Y, Morishige K, et al. Maintenance treatment with bevacizumab prolongs survival in an in vivo ovarian cancer model. Clin Cancer Res. 2008;14:7781–7789. doi: 10.1158/1078-0432.CCR-08-0243. [DOI] [PubMed] [Google Scholar]
- 10.Garcia AA, Hirte H, Fleming G, et al. Phase II clinical trial of bevacizumab and low-dose metronomic oral cyclophosphamide in recurrent ovarian cancer: A trial of the california, chicago, and princess margaret hospital phase II consortia. J Clin Oncol. 2008;26:76–82. doi: 10.1200/JCO.2007.12.1939. [DOI] [PubMed] [Google Scholar]
- 11.Cannistra SA, Matulonis UA, Penson RT, et al. Phase II study of bevacizumab in patients with platinum-resistant ovarian cancer or peritoneal serous cancer. J Clin Oncol. 2007;25:5180–5186. doi: 10.1200/JCO.2007.12.0782. [DOI] [PubMed] [Google Scholar]
- 12.Han ES, Lin P, Wakabayashi M. Current status on biologic therapies in the treatment of epithelial ovarian cancer. Curr Treat Options Oncol. 2009;10:54–66. doi: 10.1007/s11864-009-0100-x. [DOI] [PubMed] [Google Scholar]
- 13.Ebos JM, Lee CR, Cruz-Munoz W, et al. Accelerated metastasis after short-term treatment with a potent inhibitor of tumor angiogenesis. Cancer Cell. 2009;15:232–239. doi: 10.1016/j.ccr.2009.01.021. [DOI] [PMC free article] [PubMed] [Google Scholar]
- 14.Paez-Ribes M, Allen E, Hudock J, et al. Antiangiogenic therapy elicits malignant progression of tumors to increased local invasion and distant metastasis. Cancer Cell. 2009;15:220–231. doi: 10.1016/j.ccr.2009.01.027. [DOI] [PMC free article] [PubMed] [Google Scholar]
- 15.Loges S, Mazzone M, Hohensinner P, et al. Silencing or fueling metastasis with VEGF inhibitors: Antiangiogenesis revisited. Cancer Cell. 2009;15:167–170. doi: 10.1016/j.ccr.2009.02.007. [DOI] [PubMed] [Google Scholar]
- 16.Kim KJ, Li B, Winer J, et al. Inhibition of vascular endothelial growth factor-induced angiogenesis suppresses tumour growth in vivo. Nature. 1993;362:841–844. doi: 10.1038/362841a0. [DOI] [PubMed] [Google Scholar]
- 17.Soker S, Takashima S, Miao HQ, et al. Neuropilin-1 is expressed by endothelial and tumor cells as an isoform-specific receptor for vascular endothelial growth factor. Cell. 1998;92:735–745. doi: 10.1016/s0092-8674(00)81402-6. [DOI] [PubMed] [Google Scholar]
- 18.Baba T, Kariya M, Higuchi T, et al. Neuropilin-1 promotes unlimited growth of ovarian cancer by evading contact inhibition. Gynecol Oncol. 2007;105:703–711. doi: 10.1016/j.ygyno.2007.02.005. [DOI] [PubMed] [Google Scholar]
- 19.Stoeck A, Schlich S, Issa Y, et al. L1 on ovarian carcinoma cells is a binding partner for neuropilin-1 on mesothelial cells. Cancer Lett. 2006;239:212–226. doi: 10.1016/j.canlet.2005.08.005. [DOI] [PubMed] [Google Scholar]
- 20.Zhang L, Conejo-Garcia JR, Yang N, et al. Different effects of glucose starvation on expression and stability of VEGF mRNA isoforms in murine ovarian cancer cells. Biochem Biophys Res Commun. 2002;292:860–868. doi: 10.1006/bbrc.2002.6710. [DOI] [PubMed] [Google Scholar]
- 21.Sher I, Adham SA, Petrik J, et al. Autocrine VEGF-A/KDR loop protects epithelial ovarian carcinoma cells from anoikis. Int J Cancer. 2009;124:553–561. doi: 10.1002/ijc.23963. [DOI] [PubMed] [Google Scholar]
- 22.Murga M, Fernandez-Capetillo O, Tosato G, et al. Neuropilin-1 regulates attachment in human endothelial cells independently of vascular endothelial growth factor receptor-2. Blood. 2005;105:1992–1999. doi: 10.1182/blood-2004-07-2598. [DOI] [PubMed] [Google Scholar]
- 23.Fiedler J, Leucht F, Waltenberger J, et al. VEGF-A and PlGF-1 stimulate chemotactic migration of human mesenchymal progenitor cells. Biochem Biophys Res Commun. 2005;334:561–568. doi: 10.1016/j.bbrc.2005.06.116. [DOI] [PubMed] [Google Scholar]
- 24.Mombaerts P, Iacomini J, Johnson RS, et al. RAG-1-deficient mice have no mature B and T lymphocytes. Cell. 1992;68:869–877. doi: 10.1016/0092-8674(92)90030-g. [DOI] [PubMed] [Google Scholar]
- 25.Kou R, SenBanerjee S, Jain MK, et al. Differential regulation of vascular endothelial growth factor receptors (VEGFR) revealed by RNA interference: Interactions of VEGFR-1 and VEGFR-2 in endothelial cell signaling. Biochemistry. 2005;44:15064–15073. doi: 10.1021/bi0509898. [DOI] [PubMed] [Google Scholar]
- 26.Cao Y, Wang L, Nandy D, et al. Neuropilin-1 upholds dedifferentiation and propagation phenotypes of renal cell carcinoma cells by activating akt and sonic hedgehog axes. Cancer Res. 2008;68:8667–8672. doi: 10.1158/0008-5472.CAN-08-2614. [DOI] [PMC free article] [PubMed] [Google Scholar]
- 27.Spannuth WA, Nick AM, Jennings NB, et al. Functional significance of VEGFR-2 on ovarian cancer cells. Int J Cancer. 2008;124:1045–1053. doi: 10.1002/ijc.24028. [DOI] [PMC free article] [PubMed] [Google Scholar]
- 28.Nagy JA, Masse EM, Herzberg KT, et al. Pathogenesis of ascites tumor growth: Vascular permeability factor, vascular hyperpermeability, and ascites fluid accumulation. Cancer Res. 1995;55:360–368. [PubMed] [Google Scholar]
- 29.He Z, Tessier-Lavigne M. Neuropilin is a receptor for the axonal chemorepellent semaphorin III. Cell. 1997;90:739–751. doi: 10.1016/s0092-8674(00)80534-6. [DOI] [PubMed] [Google Scholar]
- 30.De Wit J, De Winter F, Klooster J, et al. Semaphorin 3A displays a punctate distribution on the surface of neuronal cells and interacts with proteoglycans in the extracellular matrix. Mol Cell Neurosci. 2005;29:40–55. doi: 10.1016/j.mcn.2004.12.009. [DOI] [PubMed] [Google Scholar]
- 31.Neufeld G, Kessler O. The semaphorins: Versatile regulators of tumour progression and tumour angiogenesis. Nat Rev Cancer. 2008;8:632–645. doi: 10.1038/nrc2404. [DOI] [PubMed] [Google Scholar]
- 32.Osada R, Horiuchi A, Kikuchi N, et al. Expression of semaphorins, vascular endothelial growth factor, and their common receptor neuropilins and alleic loss of semaphorin locus in epithelial ovarian neoplasms: Increased ratio of vascular endothelial growth factor to semaphorin is a poor prognostic factor in ovarian carcinomas. Hum Pathol. 2006;37:1414–1425. doi: 10.1016/j.humpath.2006.04.031. [DOI] [PubMed] [Google Scholar]
- 33.Barr MP, Byrne AM, Duffy AM, et al. A peptide corresponding to the neuropilin-1-binding site on VEGF(165) induces apoptosis of neuropilin-1-expressing breast tumour cells. Br J Cancer. 2005;92:328–333. doi: 10.1038/sj.bjc.6602308. [DOI] [PMC free article] [PubMed] [Google Scholar]
- 34.De Wever O, Pauwels P, De Craene B, et al. Molecular and pathological signatures of epithelial-mesenchymal transitions at the cancer invasion front. Histochem Cell Biol. 2008;130:481–494. doi: 10.1007/s00418-008-0464-1. [DOI] [PMC free article] [PubMed] [Google Scholar]
- 35.Wong AS, Maines-Bandiera SL, Rosen B, et al. Constitutive and conditional cadherin expression in cultured human ovarian surface epithelium: Influence of family history of ovarian cancer. Int J Cancer. 1999;81:180–188. doi: 10.1002/(sici)1097-0215(19990412)81:2<180::aid-ijc3>3.0.co;2-7. [DOI] [PubMed] [Google Scholar]
- 36.Sundfeldt K. Cell-cell adhesion in the normal ovary and ovarian tumors of epithelial origin; an exception to the rule. Mol Cell Endocrinol. 2003;202:89–96. doi: 10.1016/s0303-7207(03)00068-6. [DOI] [PubMed] [Google Scholar]
- 37.Imai T, Horiuchi A, Shiozawa T, et al. Elevated expression of E-cadherin and alpha-, beta-, and gamma-catenins in metastatic lesions compared with primary epithelial ovarian carcinomas. Hum Pathol. 2004;35:1469–1476. doi: 10.1016/j.humpath.2004.09.014. [DOI] [PubMed] [Google Scholar]
- 38.Schaller MD, Hildebrand JD, Shannon JD, et al. Autophosphorylation of the focal adhesion kinase, pp125FAK, directs SH2-dependent binding of pp60src. Mol Cell Biol. 1994;14:1680–1688. doi: 10.1128/mcb.14.3.1680. [DOI] [PMC free article] [PubMed] [Google Scholar]
- 39.Masson-Gadais B, Houle F, Laferriere J, et al. Integrin alphavbeta3, requirement for VEGFR2-mediated activation of SAPK2/p38 and for Hsp90-dependent phosphorylation of focal adhesion kinase in endothelial cells activated by VEGF. Cell Stress Chaperones. 2003;8:37–52. doi: 10.1379/1466-1268(2003)8<37:ivrfva>2.0.co;2. [DOI] [PMC free article] [PubMed] [Google Scholar]
- 40.Willmann JK, Lutz AM, Paulmurugan R, et al. Dual-targeted contrast agent for US assessment of tumor angiogenesis in vivo. Radiology. 2008;248:936–944. doi: 10.1148/radiol.2483072231. [DOI] [PMC free article] [PubMed] [Google Scholar]
- 41.Matsushita A, Gotze T, Korc M. Hepatocyte growth factor-mediated cell invasion in pancreatic cancer cells is dependent on neuropilin-1. Cancer Res. 2007;67:10309–10316. doi: 10.1158/0008-5472.CAN-07-3256. [DOI] [PubMed] [Google Scholar]
- 42.Rossignol M, Pouyssegur J, Klagsbrun M, et al. Characterization of the neuropilin-1 promoter; gene expression is mediated by the transcription factor Sp1. J Cell Biochem. 2003;88:744–757. doi: 10.1002/jcb.10384. [DOI] [PubMed] [Google Scholar]
- 43.Jiang SX, Sheldrick M, Desbois A, et al. Neuropilin-1 is a direct target of the transcription factor E2F1 during cerebral ischemia-induced neuronal death in vivo. Mol Cell Biol. 2007;27:1696–1705. doi: 10.1128/MCB.01760-06. [DOI] [PMC free article] [PubMed] [Google Scholar]
- 44.Liao X, Siu MK, Au CW, et al. Aberrant activation of hedgehog signaling pathway in ovarian cancers: Effect on prognosis, cell invasion and differentiation. Carcinogenesis. 2009;30:131–140. doi: 10.1093/carcin/bgn230. [DOI] [PMC free article] [PubMed] [Google Scholar]
- 45.Castanotto D, Rossi JJ. The promises and pitfalls of RNA-interference-based therapeutics. Nature. 2009;457:426–433. doi: 10.1038/nature07758. [DOI] [PMC free article] [PubMed] [Google Scholar]


