Abstract
Electrostatic effects in nanosystems are understood via a physical picture built on their multiscale character and the distinct behavior of mobile ions versus charge groups fixed to the nanostructure. The Poisson–Boltzmann equation is nondimensionalized to introduce a factor λ that measures the density of mobile ion charge versus that due to fixed charges; the diffusive smearing and volume exclusion effects of the former tend to diminish its value relative to that from the fixed charges. We introduce the ratio σ of the average nearest-neighbor atom distance to the characteristic size of the features of the nanostructure of interest (e.g., a viral capsomer). We show that a unified treatment (i.e., λ∝σ) and a perturbation expansion around σ=0 yields, through analytic continuation, an approximation to the electrostatic potential of high accuracy and computational efficiency. The approach was analyzed via Padé approximants and demonstrated on viral system electrostatics; it can be generalized to accommodate extended Poisson-Boltzmann models, and has wider applicability to nonequilibrium electrodiffusion and many-particle quantum systems.
INTRODUCTION
A nanostructure is strongly influenced by electrostatic effects. For example, the capsid of many viruses may undergo structural transition due to changes in pH and salinity. These effects are the result of the strength of Coulomb interactions, but also reflect channeling of the electrical field due to contrasts in dielectric constant ε between the host aqueous medium or membranes and the nanosystem.
The Poisson–Boltzmann (PB) equation has traditionally been used to compute the electrostatic potential around a macromolecule. However, a PB model ignores the volume of ions in the medium. Therefore, the PB equation is only valid for dilute ionic solutions and several angstroms away from the fixed charges on the nanosystem of interest (i.e., concentration ≤0.15 M). While the PB equation has been used to model these systems, the million or more atoms in a virus or other nanosystem and its surroundings makes direct PB simulation a challenge. Parameter studies, e.g., to determine virus stability for a range of pH, salinity, and temperature, is made possible via approximations to the complete PB solution.1 However, our goal is to construct a formalism that allows such parameter studies while retaining the accuracy of a full nonlinear all-atom analysis.
Several approaches and software packages for solving the linear and nonlinear PB equation have been presented throughout the past decade. An overview of numerical techniques commonly applied to PB type equations is provided in Ref. 2. For the linear PB, in one approach the electrostatic potential is expressed as a superposition of basis functions.3 The electrostatic energy functional is then minimized with respect to the expansion coefficients subject to total charge conservation. The boundary element method utilizes analytical solutions obtained in terms of Green’s functions and discretization on domain surfaces (molecular surfaces) are used to compute the potential in the whole domain for a linear problem.4, 5 One of the most common approaches used to solve the linear and the nonlinear PB equation is the finite difference formulation, where spatial derivatives are approximated using neighboring points.6, 7, 8 A successive over-relaxation method yields rapid convergence in solving the linear systems obtained from finite difference discretization.6 A finite difference domain decomposition scheme with local correction is used to solve the problem in two dimensions. However, a straightforward extension to three dimensions required O(N3 log N3) computer operations.9 In comparison, a hybrid of boundary element and finite difference methods combined advantages of both techniques and has been used to study nucleic acid structures.10 An indirect way of solving the equation is by reformulating the elliptic PB equation as the long-time solution of an advection-diffusion equation.11 Adaptive finite element techniques have been used to solve the PB equation for large systems. Potentials in specific regions within a system are calculated using boundary conditions derived from a coarse-grained PB solution over the entire system. This has been implemented in the adaptive PB solver (APBS) using standard focusing techniques with the Bank–Holst algorithm.12 In this approach, dielectric discontinuity across the molecular surface is captured using a dense adaptive mesh of tetrahedral elements. However, one might argue that in a physically relevant model, the dielectric discontinuity is not present; rather, ε gradually increases to its unperturbed bulk value with distance from the molecule-medium boundary.8 This allows application of regular grids leading to simple numeric schemes with multigrid implementations.13
Multiscale analysis is a powerful methodology that has been applied to a broad spectrum of complex classical14, 15, 16, 17, 18, 19, 20, 21, 22, 23, 24, 25 and quantum26, 27, 28, 29, 30 many-body systems, and to reaction∕transport∕mechanical phenomena in porous media.31, 32, 33, 34, 35, 36, 37 The problems to which it has been applied are usually governed by linear equations, although nonlinear reacting-deforming porous media have been treated through this approach.36 Multiscale analysis has been used to derive rigorous stochastic equations for nanosystem dynamics starting from the classical Liouville equation.38, 39, 40, 41 In this paper, we explore an analogous multiscale approach to the PB problem designed for nanosystem applications. Through our formalism, dielectric channeling, and a coarse-grained PB equation, coupling of electrostatic effects across scales in space are captured. We identify characteristic charge densities and lengths which enable the evaluation of various effects as they influence dielectric channeling and coarse-grained electrostatics. For example, coarse-grained potential profiles affect small scale potential fluctuations and conversely. A new effect coarse-grained dielectric anisotropy is identified. The main objective of this paper is to outline our mathematical and conceptual framework. However, implementation of an implied multiscale numerical algorithm is used to validate the theory and shows promise for efficient PB simulation.
We consider a formulation in terms of two parameters σ and λ. The first is the ratio of the average nearest-neighbor atom distance to a characteristic length of a nanoscale feature in the system of interest. The second, λ, is the ratio of a typical single mobile ion charge density at infinity to the average charge density within a charged group fixed to the nanostructure. Our procedure is to recast the σ, λ-parametrized problem in to one, wherein λ∝σ, and then develop a unified perturbation scheme starting from σ=0 and continuing to the value σ equal to the value of λ of interest. In the following, we reformulate the PB problem in a multiscale fashion and explore a method to construct solutions in the limit of small σ, demonstrating both numerically and analytically the accuracy of this approach.
MULTISCALE FORMULATION
Let be position in the system expressed in units such that as one traverses an average nearest-neighbor atom distance, moves a distance of about one (about 1 Å). As traverses the whole nanosystem, it moves a distance of O(σ−1). By definition, σ is the ratio of the average atomic nearest-neighbor distance to the size of the nanosystem. It is natural to introduce a scaled position . As one traverses the whole nanosystem, moves a distance of about 1 in its unit (about several nanometers). We construct the electrical potential Φ by making the ansatz that it simultaneously depends on and , and show the smallness of σ allows one to construct the and dependencies simultaneously.
Consider the PB model expressed in the spatial variable
| (2.1) |
where ε is the dielectric constant and f is the charge density. Both f and ε depend on position, reflecting the underlying spatial variation in the atomic scale structure, while they also account for the nanoscale variation in structure (e.g., the size of the nanosystem is roughly σ−1). In our formulation, f is divided into fd due to discrete charges fixed to the nanosystem and a contribution fc from mobile charges.
A nondimensionalization of the PB equation reveals a factor that enables the development of a novel approximation scheme. rc is a length characteristic of the Φ profile. A stationary charge density within the region excluded by a typical fixed ion fx, a single mobile ion charge density at infinity f∞, the dielectric constant of free space ε0, and kBT∕e are other characteristic quantities. With this we define a new set of dimensionless variables indicated by a
As Φ depends on both and by our multiscale ansatz, the chain rule implies, upon letting and be and gradients, respectively,
| (2.2) |
Some details on the derivation of Eq. 2.2 are provided in Appendix A. With this, the multiscale ansatz Eq. 2.2 and introduction of the dimensionless variables, the multiscale PB equation becomes
| (2.3) |
where and .
Dropping the “∼” for simplicity, this yields
| (2.4) |
The objective is to construct via parameter unification and analytic continuation. Typical values of factors in the expression for λ at biological conditions (see Table 1) imply that λ ranges from 10−2 to 10−3. For many nanosystems, σ lie in the same range. Therefore, we suggest a methodology where λ is set equal to σ to achieve a unified perturbation methodology. We proceed in a perturbative fashion to construct Φ along the line λ=σ, continuing perturbatively from the (σ,λ) origin to the λ value of interest. With this, we seek a small σ perturbative solution to the following equation:
| (2.5) |
Table 1.
List of universal and system-specific parameters used in calculation.
| Universal parameters | Values | Equation | Reference |
|---|---|---|---|
| Maximum dielectric εm | 4 | 4.6 | 11, 56 |
| Minimum dielectric εatom | 80 | 4.6 | 11, 56 |
| Dielectric transition width | 5 Å | 4.5, 4.6 | 8, 11, 56 |
| System specific parameters | |||
| pH | 7 | 11, 56 | |
| fx | 10−2eÅ−3 | 4.3, 4.4 | This paper, 64 |
| Fine grid spacing | 0.3–0.9 Å | 2.2, 2.3, 2.4 | This paper |
| Coarse grid spacing | 20–22 Å | 2.2, 2.3, 2.4 | This paper |
| Temperature T | 298.5 K | 2.2, 2.3, 2.4 | This paper |
| Salinity | 0.125 M | 3.2, 3.6 | 65 |
The above decomposition of charge is based on the notion that the fixed charges are well-localized and thereby creates a high charge density. In contrast, the mobile ions are highly fluctuating and thereby have an effectively more diffuse charge distribution and correspondingly lower charge density. In addition, the excluded volume effect on mobile ion distribution around fixed charges prevents excessive counter-ion accumulation. In contrast, if there were no excluded volume then the counter-ion charge density would mirror that of the fixed charges. However, observations of correlation functions in dense media support the notion that mobile ion density is diffusive in nature for a large number of problems with 1:1 electrolyte and hence can be treated perturbatively (as discussed further in Sec. 6).
While the original PB Eq. 2.1 masks the multiscale character of the nanosystem problem, the reformulated one makes σ explicit. For a million-atom nanosystem such as a small virus, σ is roughly 10−2. Hence, one expects that solutions to Eq. 2.5 can be constructed as a Taylor series in σ
| (2.6) |
This theme is developed in Sec. 3.
MULTISCALE PERTURBATION ANALYSIS
Consider details of the development of the potential as a Taylor series in σ as suggested in the previous section. Using Eq. 2.6 and analyzing the multiscale PB equation order-by-order, we construct Φ. For arbitrary -dependent function A, we define the linear operator such that
| (3.1) |
To O(σ0) in the multiscale perturbation series, one obtains . This implies Φ0 can be obtained in the form , where θ satisfied . Since fd is independent of Φ, θ can readily be obtained via a linear numerical solver. Note that Φ and Φ0 vanishes for the isolated nanosystem in an infinite medium as . Here, Φ* captures the dependent variations in the zeroth order solution. It stays constant over changes on the angstrom scale. Hence, . The behavior of the contribution Φ* to Φ0 is addressed via an analysis of the problem to higher order.
To O(σ), one obtains
| (3.2) |
where fc(0) is the coefficient of order O(σ0) when expanding fc in σ and depends on Φ0 as shown in Sec. 4.
We define to be the solution of
| (3.3) |
where bα and rα are the αth Cartesian components of and . It arises in a manner similar to the formulation of flow in porous media where the analog to yields the permeability tensor.42 Linearity of Eq. 3.2 and the definition of implies the equation , where ψ is a solution to
| (3.4) |
A more detailed derivation of the above is shown in Appendix B.
Let bα=cα−rα. Then
| (3.5) |
Since Φ1 must be bound as , bα must be bound there for a nanosystem in an infinite medium. Thus, the auxiliary quantity cα→rα as . This provides the asymptotic condition needed to determine cα, and thus bα. For the class of problems of interest, Φ→0 as and go to infinity, which is ensured to O(σ) via the above asymptotic conditions. Finally, ψ vanishes as and bα is nonzero and has angstrom scale variations near and within the nanosystem in response to variations in ε. This completes the O(σ) analysis.
To O(σ2)
| (3.6) |
where fc(1) is the coefficient of O(σ) when expanding fc in σ about σ=0. As a consequence, fc(1) depends on both Φ0 and Φ1, as shown in Sec. 4.
An equation for Φ* is obtained as follows. First, a weight is introduced that samples space in the vicinity of a point . Equation 3.6 is multiplied by , integrated over , and using the boundary conditions at infinity, one finds
| (3.7) |
where
| (3.8) |
| (3.9) |
| (3.10) |
N is a normalization constant. The coarse-grained dielectric factor is a tensor. Its profile across the nanosystem, and the directionality it creates because of its tensorial character, accounts for large-scale channeling. This anisotropy follows from an averaging of the potential response to short-scale dielectric variations as shown above. bα serves as a response function underlying the effective dielectric tensor. In arriving at this result, we have ignored via arguments provided in Appendix C. The coarse-grained PB Eq. 3.7 yields the long-scale background potential profile Φ* across the system.
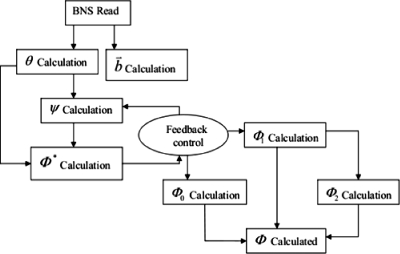
The resolution of the coarse-grained PB equation is determined by the width Δσ−1∕2 of W. The width of W is taken to be much greater than the short length scale (i.e., the average nearest-neighbor atom distance of about 1 Å) but much smaller than the size of the features we wish to resolve (e.g., a viral capsomer), allowing the function to die out beyond the integrating volume, i.e., at distances of several nanometers away from . The form of W is discussed further in Appendix C. As Φ0 captures all the short-scale features directly related to the nanosystem via θ, and Φ1 captures them via and ψ, our multiscale approach retains both short-scale and long-scale behaviors. Thus, our approach is not a semiphenomenological method that requires recalibration with each new application. While the auxiliary quantities , ψ, and θ must be computed at atomic resolution, the linearity of the equations they satisfy, unlike for the original PB equation, is readily solved numerically. This adds to the great efficiency of our methodology which retains both long-scale and short-scale variations, relegating the nonlinearity to a coarse-grained equation for Φ*. Even though the coarse-grained potential Φ* is only -dependent, the charge density remains multiscale in nature and hence, short-scale structure of the potential is accounted for in θ and Φ1. Φ1, in particular, accounts for local correction to the smooth background potential Φ*. Solutions to Eqs. 3.4, 3.7 are essentially coupled, yielding an interscale feedback loop that computes the smooth background potential Φ* and the local correction Φ1 simultaneously. We validate the perturbation scheme via computational implementation, and in particular show that Φ0>σΦ1⪢σ2Φ2. The interscale feedback relationship implied by the above development is summarized in Fig. 1.
Figure 1.
Interscale feedback loop implied by the perturbation analysis.
DETAILED PHYSICAL FORMULATION
The detailed physical formulation of the PB model adopts integrated notions from our earlier work11 and that of others.43 Mobile ion concentrations are assumed to be at equilibrium. Let Cl and μl be the concentration and chemical potential of mobile ions of type l, l=1,2,⋯,L. We adopt the phenomenological model
| (4.1) |
for activity coefficient and reference potential of l, , and Faraday constant F. Given that far from the nanosystem Φ→0 and , and that μl is constant across the system at equilibrium, then
| (4.2) |
With this, the charge density from the mobile ions is given by
| (4.3) |
To simulate the excluded volume effect that prohibits the unphysical overlap of the mobile ions with the nanosystem atoms, γl is taken to be one except near an atom fixed to the nanosystem (i=1,2,⋯,N). is the identity of the nanosystem atom closest to and is the location of the atom . With this,
| (4.4) |
where Λil is a dimensionless transition width parameter for the i, l pair.
| (4.5) |
where , ai is the radius of nanosystem atom i, and bl is the radius of mobile ion l. With this the mobile ion excluded layer has a thickness of (ai+bl). This phenomenology describes a smooth transition in ion accessibility from 0 to 1 is suggested in other studies,44, 45, 46, 47, 48 the basis of which is fluctuating positions of the fixed and mobile ions, as well as the continuous profile of electron density around a given ion. The mean displacement of an ion from an equilibrium position was considered to be >0.1(ai+bl) Å.49 This displacement decides the choice of transition width parameter Λil. In this way, the charge density around the fixed ions is taken to be Gaussian in form. The half-width of the Gaussian is the atomic radius of the fixed ion.
The continuous charge density is expressed as a Taylor expansion of fc in σ about σ=0.
Nondimensionalizing the above implied
Thus and .
Dropping “∼”, the above expressions for and were used in Eqs. 3.2, 3.6. Unlike methods where the partitioning of charges is according to their spatial locations,10 in our method it is according to the order in σ to which they contributed to charge density. Developing an algorithm with spatial partitioning might lead to more efficient computation as fewer grid points can be considered for solving the linear equations, although this was not attempted in this study. The mobile ion charge densities and are multiscale in nature, i.e., they simultaneously account for rapidly varying short-scale fluctuations and a slowly varying background potential.
The dielectric constant distribution ε (τ,Λil) is calculated using the formula
| (4.6) |
where εm and εatom are the dielectric constants of the host medium and an nanosystem atom, respectively, and as being the solvent atom radius .11
MULTISCALE COMPUTATIONS
The algorithm of the previous sections was implemented as a software package denoted PBms. The utility of our multiscale PB approach depended on the computational requirements for determining , θ, ψ, and Φ*. The quantities , θ, and ψ satisfied linear equations with Dirichlet conditions, i.e., , θ, and ψ were zero at the boundary of the simulation domain, assumed far from the nanosystem. Thus, solving for these variables did not require the costly iteration needed to solve the original nonlinear PB problem. However, solving the interscale equations to simultaneously calculate Φ* and ψ was found to require some iteration. Additional overhead arose from the computation of and θ. In our workflow, the solution to the linear PB equation was used as a guess for Φ0 to initialize the multiscale iterations. Though reasonable for biomolecular systems,50, 51 this slightly added to the time overhead.
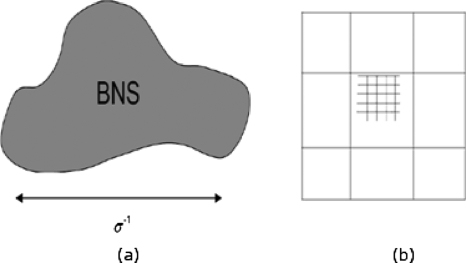
The two-grid method used to implement the interscale iteration is suggested in Fig. 2. The coarse-grained PB equation for Φ* involves a characteristic length, i.e., the nanosystem size, and not the atomic scale. For a small virus [e.g., cowpea chlorotic mottle virus (CCMV), human rhinovirus, poliovirus, and human papillomavirus], the large scale is roughly 100 times larger in length than the size of an atom. Thus, one could simulate the system with a factor of roughly 106 fewer grid points when using the coarse-grained equation for Φ* than for the full PB equation. It is shown below that the central processing unit time for our multiscale method increased more slowly with the number of grid points than did current PB approaches.
Figure 2.
(a) A nanostructure (nanosystem) of size of O(σ−1) containing millions of atoms is shown. A multiscale approach that accounts for the distinct length scales involved is developed for solving the PB problem. (b) Schematic discretization showing the coarse grid on which the coarse-grained potential profile Φ* is solved, and the fine grid on which , θ, and ψ are solved.
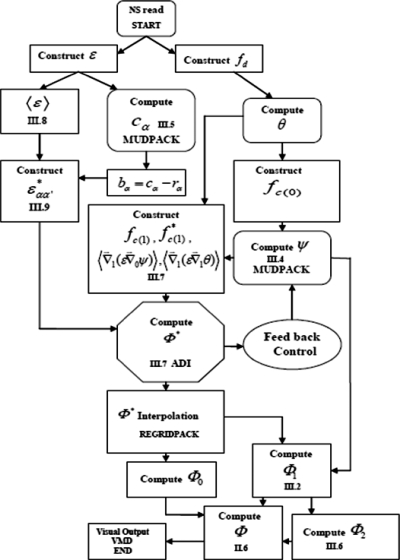
In Fig. 3, a schematic flowchart of our multiscale PB simulation approach is presented. To implement this workflow, we used the MUDPACK software to solve the linear equations for , θ, and ψ and to initialize the multiscale iteration using Gauss–Seidel pointwise relaxation followed by the deferred correction scheme.52 Modules were written to use to construct the coarse-grained dielectric constant tensor and set up the nonlinear coarse-grained PB equation, solved with the alternating direction implicit (ADI) method.11 A list of parameters used in the course of the simulation is shown in Table 1. There are universal parameters that are applicable over a large array of nanosystems. In addition, there are system-specific parameters that must be tailored to the system of interest. In this study, nanosystem atom radius ai and partial charge were assigned using the CHARMM22 force field.
Figure 3.
Flow chart showing steps involved in the multiscale computational algorithm.
RESULTS AND DISCUSSIONS
We have demonstrated the accuracy of PBms via numerical experiments, comparison with analytical solution, and results from another solver. Analytical solution is available for the case of a charged planer electrode in 1:1 electrolyte. Here,
| (6.1) |
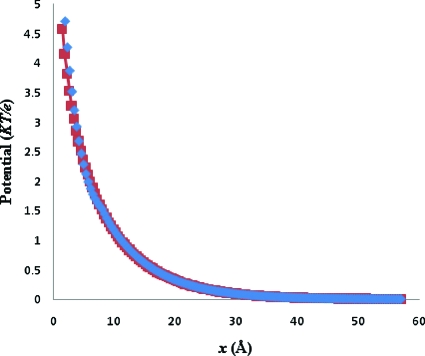
ζ is the surface potential on the plate and u=kx, where x is the distance along the normal to the plate and k−1 is the Debye length. The plate is located at x=0. Since Eq. 6.1 holds for an infinite plate and the simulation was carried out for a finite one, the comparison was made along a normal in the X-direction emanating from the center of the plate to avoid edge effects. Figure 4 shows the PBms generated potential profile along with the analytical solution at ζ=10KT∕e, and grid spacing of 0.5 Å for a square plate with sides of 100 Å. The PBms generated profile is in excellent agreement with the analytical solution. However, one expects deviations from observed near surface profiles because the model used does not account for the Stern layer.
Figure 4.
The PBms generated potential profile (◆) along with the analytical solution (◼) for a 100×100 Å2 charged plate in 0.125 M 1:1 electrolyte, ζ=10KT∕e and with 0.5 Å grid spacing.
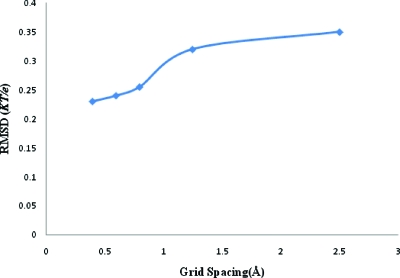
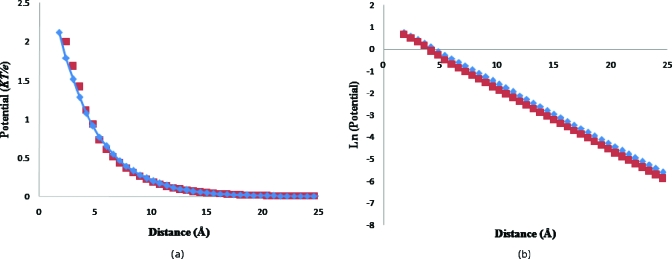
A uniformly charged solid spherical particle of 100 Å radius and a total charge of +750e was considered immersed in a 0.125 M 1: 1 electrolyte. To validate our algorithm, we compared our results for this simple system with that of APBS.12 To minimize differences from numerical schemes in solving the linear equations, APBS was used as a linear solver instead of MUDPACK. Similarly to maintain consistency in the underlying physical model, the dielectric constant ε (using pdie: 4; sdie: 80; and srfm: smol) and nanosystem charge distribution fd (using chgm: spl2) were also taken from APBS for both calculations. The ion accessibility was considered smoothly transitional as in Eq. 4.5 for both programs due to reasons mentioned later in this section. The multiscale modified charge density arrays for appearing in Eq. 3.4 were read back into APBS via the OpenDX format (using “read” and “usemap” options). However, our ADI software was used to solve Eq. 3.7 in PBms. Finally the potential was taken to be zero at the boundary of the domain for both the programs. The root mean square deviation (RMSD) between potentials from direct and multiscale methods is shown in Fig. 5. It is small and decreases with grid spacing. The PBms and APBS-generated potential profiles across the ions accessible region where γl≠0 (about 25 Å wide) at 0.6 Å grid spacing (4493 grid size) is shown in Fig. 6a. The profiles are in good agreement. The ions accessible region (in Fig. 6) begins at a distance of 1.8 Å from the sphere surface due to reasons mentioned below. The boundaries were set at a distance of about 25 Å from the sphere and the potential at the boundary was set to zero since the latter was much greater than the Debye length from the edge of the sphere. The potential showed a continuous transition across the sphere-solution interphase even without imposing continuity there. This is attributable to the second-order differential nature of the PB equation and the smooth nature of the ions accessibility transition (Sec. 4) used for the comparison.11 The model, and hence the comparison, therefore, does not account for the counter-ions in the Stern (tight bound) layer, i.e., the Stern Layer (of thickness equal to the bare ion radius53 1.81 Å for Cl− ion) is considered ion excluded with γl=0.53, 54 In fact, as discussed later, under conditions where counter-ion concentration in Stern layer becomes important the perturbation series tend to diverge. The formalism is applicable to diffusive counter-ions. However, negligible tight binding is expected under conditions chosen for the comparison (a relatively low stationary charge density and 1:1 electrolyte).47 Our software can be implemented for nonzero surface boundary conditions with minimal alteration. To magnify differences, the potential profiles in Fig. 6a are replotted on a logarithmic scale in Fig. 6b. Even on the latter scale, PBms and APBS-generated profiles are seen to be in excellent agreement.
Figure 5.
rms deviations between the PBms and APBS calculated potential distributions for a spherical particle of 100 Å radius and +750e charge in 0.125 M 1:1 electrolyte at different grid spacings.
Figure 6.
(a) Potential profile from the surface of the spherical particle (zero on X-axis) to the boundary of the domain (∼25 Å form the surface) using APBS (◆) and PBms (◼) at 0.6 Å grid spacing along a ray through the center of the sphere. (b) Profile of ln(Φ) along the ray as in frame (a) within the same ions accessible region using APBS (◆) and PBms (◼).
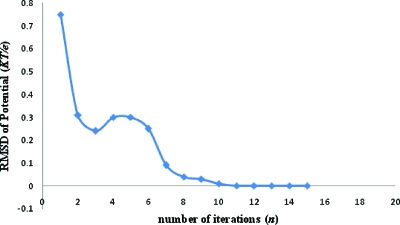
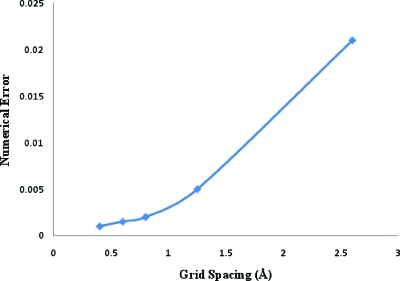
Another important aspect of our algorithm is the rapid convergence of multiscale iterations. This is because , being a coarse-grained potential, is smoother in nature than fine-scale potentials like θ or ψ. This facilitated the convergence of solutions to the coupled Eqs. 3.4, 3.7, avoiding cascade error. The long-scale character of is also attributable to the “low frequency” global coupling of the elliptic problem and hence, solving for can be accomplished on a coarse grid.43 To illustrate this, define the error in Eq. 3.4 from the nth iteration as . The equation is solved if E(ψn)=0. ψn and fc(0),n are potential and modified continuous charge density at the nth iteration, respectively. In Fig. 7, we plot RMSD of ψn from successive multiscale iterations for the solid sphere in solution at 0.6 Å resolution under physical conditions same as those in the previous paragraph. The RMSD after the 15th loop was on the order of 10−3KT∕e with E(ψn) on the order of 10−4. The average ψ15 was many orders of magnitude higher, reaching a maximum value of approximately 104KT∕e in regions close to the center. Thus, after 15 iterations, the solution was extremely well converged for this system. Numerical error in solving the equation is plotted as a function of grid spacing in Fig. 8. Errors decreased with reduction in grid spacing. The convergence test of the perturbation series was done to the second-order and it was found that Φ0>σΦ1⪢σ2Φ2, validating our approach. Like all perturbation schemes, global convergence is not guaranteed. Only under suitable conditions the series converges. However, the limits of convergence are found to be within the limits of applicability of the physical model (as shown below).
Figure 7.
rms deviation of ψ between consecutive multiscale iterations (n and n+1) as a function of n for the sphere in solution.
Figure 8.
Numerical error in solving the O(σ0) equation vs grid spacing.
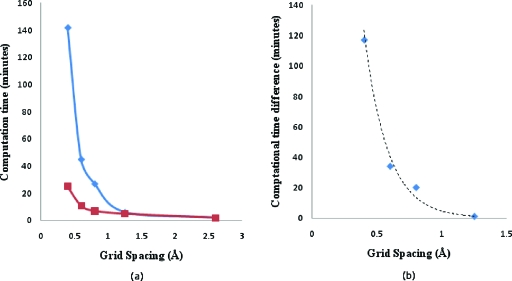
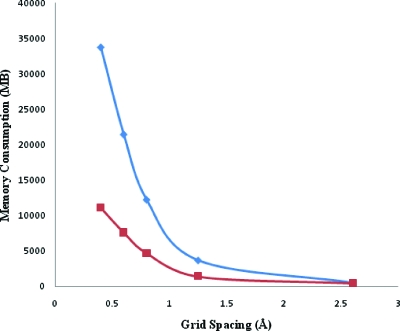
Our multiscale numerical algorithm yielded a highly efficient approach for solving the PB equation. The speed-up over APBS obtained for our algorithm is shown as a function of grid spacing in Fig. 9a. Comparisons of calculation time for the spherical particle with that of APBS was done on a single Xeon processor using a Dell Power edge system. For 5133 grids, the PBms solver was found to be approximately seven times faster than APBS. Figure 9b shows the absolute difference in computational times between APBS and PBms as a function of grid spacing. The numbers were fitted to an exponential trend line y=1122e−5.51x. This shows the PBms efficiency increases nonlinearly with decrease in grid spacing. A comparison of memory consumption is shown in Fig. 10. This implies that our PBms implementation requires much lesser memory than APBS and is attributable to differences in numerical schemes (i.e., our integration of MUDPACK solver into the multiscale algorithm). Figures 910 show that as grid spacing decreases, PBms performance relative to APBS increases. This is realized because a great deal of iterative nonlinear PBms computations occurs at the coarse-grained level. This is somewhat offset by our need for interscale iterations. However, there is a net improvement in performance relative to carrying out nonlinear iterations at the fine grid level only. Another advantage is discussed below in the context of parameter studies.
Figure 9.
(a) Plot of computation time vs grid spacing for a spherical particle of 100 Å radius and +750e charge in 0.125 M 1:1 electrolyte using APBS (◆) and PBms (◼). (b) Absolute difference in computation time vs grid spacing (<1.5 Å) for computations as in frame (a).
Figure 10.
Memory footprint comparison for Fig. 9a.
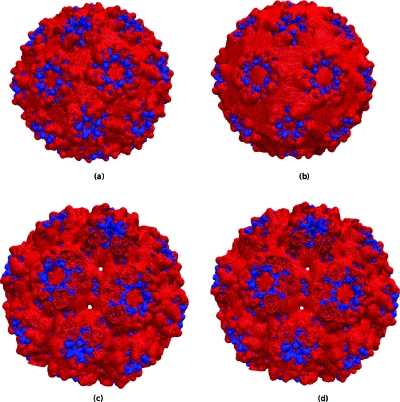
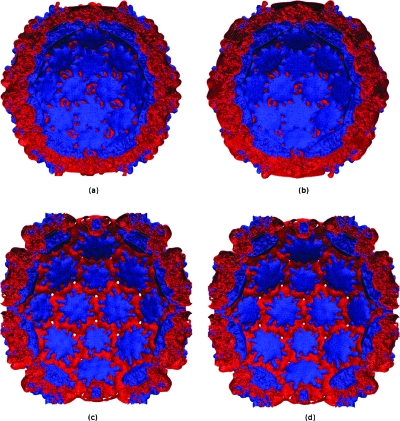
PBms with MUDPACK and ADI was used to determine the electrostatic potential of CCMV capsid with its 432 210 atoms. Figures 1112 show the +1KT∕e and −1KT∕e electrostatic potential isosurfaces for native and swollen CCMV capsid in 0.125 M NaCl solution at 0.7 Å resolution. These isosurfaces were essentially identical to their APBS-generated counterparts shown in the same figure. To obtain an unambiguous comparison, the nanosystem charge and dielectric distribution were obtained from APBS (as before), and boundary values of the potential in both cases were set to zero. The electrostatic potential isosurface residing near the outer surface of the capsid was predominantly negative except for positive zones concentrated at the margins of hexameric and pentameric subunits, and clearly showed the icosahedral symmetry of the capsid. Cut-away views of the swollen and native states showed the inner surface is primarily positive in nature. This is due to basic amino acid residues that facilitate complexing to the negatively charged RNA. However, in the swollen state, negative patches appeared on the inner surface. This latter electrostatic distribution promotes RNA release from the capsid core. The physical picture is in agreement with previous results on CCMV,55, 56 but PBms took less computation time. The APBS-generated isosurfaces shown in this paper, though similar, are not identical to those reported by Konecny et al.55 This is attributable to differences in grid size, boundary conditions, ions accessibility, and ionic strength used for our APBS calculations. However, such differences did not affect the comparison shown in Figs. 1112.
Figure 11.
+1KT∕e (blue) −1KT∕e (red) potential isosurfaces for the native and swollen state of the 432 120 atom CCMV capsid immersed in 0.125 M NaCl at 0.7 Å resolution, computed via rigorous multiscaling; external view native [(a) PBms; (b) APBS] and swollen [(c) PBms; (d) APBS].
Figure 12.
As in Fig. 11, except for cut-away view.
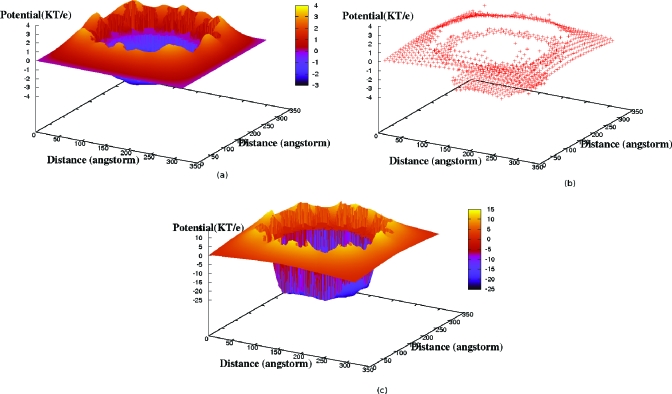
To illustrate how the multiscale perturbation technique worked, the contributions to the potential of various orders in σ were considered. Two-dimensional potential profiles on an equatorial slice through CCMV for σψ, Φ*, and (Φ*+σΦ1) constructed by first multiplying these variables with γl to remove fixed ion core variations for illustrative purposes are shown in Fig. 13. σψ, and Φ* are plotted on the same scale in Figs. 13a, 13b, respectively, to identify the smoothness in variation in the latter. It is seen that σΦ1 dresses the coarse-grained potential Φ* variation with atomic scale details to yield a full multiscale counter-ion potential [Fig. 13c].
Figure 13.
Potential profiles on an equatorial slice through CCMV for (a) σψ, (b) Φ* (plotted on the same scale as σψ), and (c) (Φ*+σΦ1) under same conditions as Figs. 1112.
A quantitative analysis of the above results is shown in Table 2. The rms deviations between PBms and APBS calculated potentials observed for native and swollen CCMV were an order of magnitude smaller then the corresponding ⟨Φ0⟩, showing the PBms calculated results are close to those of APBS. The rms deviations were found to become even smaller, about 10−2KT∕e, when the APBS linear solver was used with multiscaling. This RMSD was smaller than that of the spherical particle at the same grid size validating that the multiscale ansatz worked better as the system grew in size, making the two scales more distinct, as one might have expected. In accordance with results for the simple case of a sphere in solution, differences were expected to further diminish at finer grid spacing.
Table 2.
Quantitative comparison showing RMSD of PBms results with those of APBS, along with the absolute value of arithmetic mean (|⟨ ⟩|) of O(σ0), O(σ), and O(σ2) PBms solutions for three different systems.
| System | RMSD(KT∕e) | |⟨Φ0⟩|(KT∕e) | |⟨σΦ1⟩|(KT∕e) | |⟨σ2Φ2⟩|(KT∕e) |
|---|---|---|---|---|
| CCMV (Swollen) | 0.387 | 6.773 | 0.0341 | 5.077×10⁻³ |
| CCMV (Native) | 0.457 | 10.04 | 0.0901 | 7.439×10⁻³ |
| Ubiquitin | 0.371 | 0.528 | 0.0613 | 4.072×10⁻⁵ |
Table 2 shows that for CCMV |⟨Φ0⟩|>σ|⟨Φ1⟩|⪢σ2|⟨Φ2⟩|, demonstrating the rapid convergence of the multiscale perturbation series. PBms was also used to calculate the electrostatic potential for ubiquitin. Being small, in this system the two scales were less widely separated, making σ≈0.1. Under such conditions, the multiscale ansatz failed as expected, i.e., ⟨Φ0⟩ is comparable to the RMSD between PBms and APBS. In addition, the rate of convergence also decreased relative to that for the CCMV results. In summary, the multiscale algorithm is ideal for accurate, efficient simulation of large, complex systems. Only to allow a fare comparison for all the above examples, APBS-generated dielectric distribution was used. Henceforth all calculations are done using the continuous dielectric model in Eq. 4.6 as suggested in Refs. 8, 11, 56.
Consider the effect of ions accessibility γl on the behavior of the method. Omnipresent fluctuations in the atomic configuration imply that γl should be transitional, and notably should involve a transition width, as mentioned in Sec. 4. However, to assess the robustness of our method, we explored varying the transition width from 0 to 2.5 Å, finding that the method did not converge when the transition width is less than a cut-off value, roughly 0.5 Å. It did converge for a transition width of 1 Å, the value used in all the above simulations, and certainly for higher transition widths. This issue is closely related to the tight binding of counter-ions and becomes more relevant in regions of high fixed ion charge density, e.g., in nucleic acids or ribosomal electrostatics. Accurate description of such tightly binding counter-ions (Stern layer) is beyond the scope of PB or other mean field theory.49 However, previous studies showed nucleic acids in dilute NaCl solution did not display tight binding of counter-ions.49 Thus, the entire counter-ion charge density was diffusive, even for such systems. This diffusive nature of mobile ions permitted incorporation of a transition width in ions accessibility and allowed application of the perturbative approach to nucleic acid electrostatics in dilute 1:1 electrolyte. In a 2:1 electrolyte, tight binding of counter-ions to nucleic acid was significant; hence, application of PB theory was not appropriate. PB theory was also known to fail in accurately describing the electrostatics of triplex DNA in 1:1 electrolyte for similar reasons.57
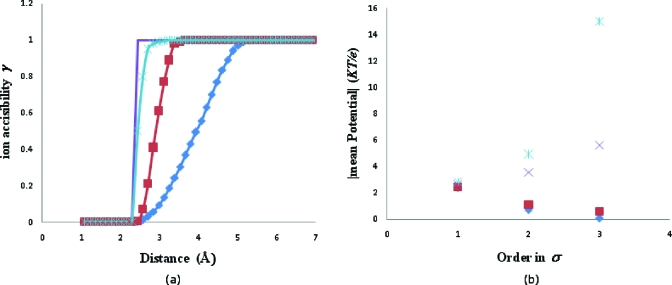
To investigate this idea, the RNA part of satellite tobacco mosaic virus (STMV)-RNA complex was chosen. Figure 14 shows the different modes of ions accessibility transition and their corresponding effect on the convergence of the perturbation series calculated to third order for 0.125 M NaCl solution at 0.3 Å grid spacing. Convergence failed when the transition width was less than 0.5 Å. As is independent of γl and is insensitive to small scale changes in transition width, the zeroth order solution Φ0 varied negligibly with γl. Hence, it is not incorporated in Fig. 14. Since the fluctuations in ions occurred over a length scale of >0.1(ai+bl) Å (>0.7 Å in the present case), a transition width of 1 Å could safely characterize the diffusive counter-ion charge distribution for STMV-RNA electrostatics. To illustrate this, we calculated the total diffusive counter-ion charge per nucleotide over a solvent accessible volume defined by Chen et al.49 using 1 Å transition width, 0.125 M NaCl solution, and 0.3 Å grid spacing. We found a net Na+ charge of +0.82e. This was in fair agreement with the reported value of 0.76e.49 Inclusion of higher order terms will enhance the agreement. This number became +0.46e per nucleotide when the potential for the entire complex was calculated, signifying partial neutralization of the negatively charged RNA by the positively charged capsid core. The maximum counter-ion concentration reached 23.7 M which lies within the reported cut-off of 20–30 M for RNA simulation.58
Figure 14.
Effect of ions accessibility transition width (a) 2.5 Å, Λil=1 (◆); 1 Å, Λil=10 (◼); 0.5 Å, Λil=1000 (×); and 0 Å (line) on (b) convergence of perturbation series implied by changes in |⟨σΦ1⟩|, |⟨σ2Φ2⟩|, and |⟨σ3Φ3⟩|, where |⟨Φ0⟩|=21.92KT∕e.
Comparison of predictions of our methodology on large protein assemblies (i.e., viral capsids), as discussed above, illustrated the viability of the approach in a given range of the ions accessibility transition width. However, to explore the potential breakdown of our approach, reformulating our results as the Padé approximants was considered.59 Padé approximants have been used to detect anomalous behavior in perturbative solutions of various problems (e.g., phase transitions and nonlinear reaction-diffusion phenomena). Padé approximants were traditionally ratios of polynomials, but other analytical forms have been used.17, 60 In the present context, we used information from the small σ perturbative analysis to seek anomalies in .
For example, we constructed Φ in the form
| (6.2) |
for factors a0, a1, b0, and b1. However, examination of the multiscale PB equation for large σ showed that Φ must vanish as σ−1 as σ→∞; this implied a1 is 0. Without loss of generality, we took b0=1. Comparison with the σ expansion from the perturbation series of Sec. 2, we obtained
| (6.3) |
With this, we found that the Padé approximant had no anomalous behavior for the physical regime of small σ, when σΦ1<Φ0, implying σb1<1.
More general approximants should be examined in the search for possible anomalous behavior. Consider the approximant
| (6.4) |
which has the correct large σ behavior as σ→∞
To compute the four a, b coefficients, the σ perturbation series was carried out to third order. This yielded
| (6.5) |
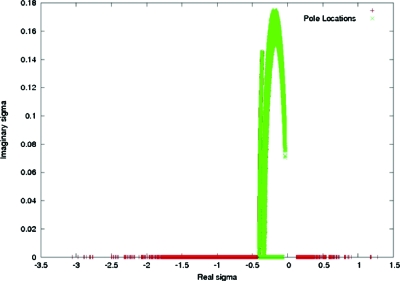
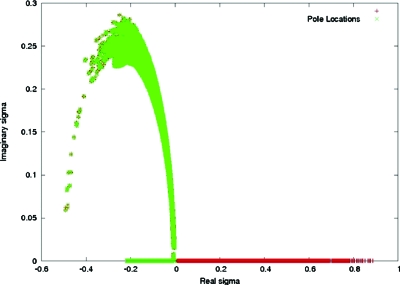
Setting the denominator of Eq. 6.4 to zero, one find poles at locations σ± given by . We examined this result for RNA in the STMV-RNA complex. Expressions from Eq. 6.5 were used with our computed numerical values of Φ0, Φ1, Φ2, and Φ3 for the RNA. The location of the poles in the complex σ plane for two different transition widths and all grid nodes in the simulation domain are summarized in Figs. 1516. For a transition width of 1 Å, the nearest pole residing on the positive real σ axis was at σ±=0.128. For zero transition width, the nearest real positive pole was shifted to about 10−6. Thus, for the former case, poles were absent in the range σ=0 to σ→λ. This validated analytic continuation of Φ over the chosen range of σ which was further implied by convergence of the perturbation series. Whereas for zero width, poles existed around σ=λ, implying Φ could not be analytically continued over the same σ range. Physically, this means counter-ion overcrowding due to a zero transition width in ion accessibility lead to perturbative corrections as large as the zeroth order potential, suggesting a divergence.
Figure 15.
Location of poles σ± in the complex σ plane using 1 Å ions accessibility transition width to determine Φ.
Figure 16.
Location of poles σ± in the complex σ plane using 0 Å ions accessibility transition width to determine Φ.
Padé approximants also set a range for the choice of electrolyte concentrations over which the methodology can be applied. The real positive pole nearest to the origin limits the maximum value of to . For one find poles along the real positive σ axis to the left of λ so that analytic continuation from the complex σ origin breaks down. Using σ±=0.128 (from the RNA simulation with ions accessibility transition width 1 Å), . At this high concentration neither PB theory nor analytic continuation are applicable. The present multiscale methodology directly couples the choice of length scales with the choice of salinity. Extent of local averaging is correlated with salinity via the σ dependence of W. Thus physical conditions (e.g., salinity and temperature) fix the coarse-grained dielectric distribution and interscale feed-back, so that the multiscale PB analysis is carried out self-consistently with automated implementation. Single PBms calculation efficiency at fixed grid spacing facilitates parameter study (e.g., salinity dependence of nanosystem electrostatics). For comparable computational cost of one APBS calculation, multiple PBms runs is possible over a permissible range of salinity. This is achievable due to the advantages of a multiscale algorithm over that of a single scale.
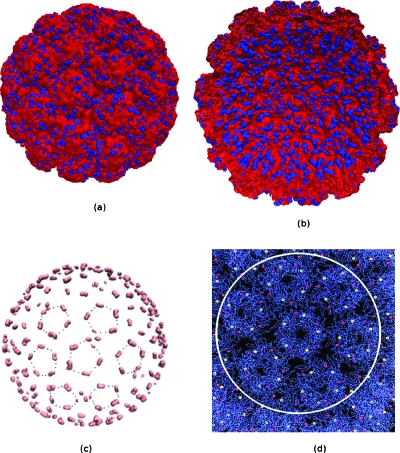
To demonstrate the viability of PBms on an even bigger system, we calculated the electrostatic potential isosurfaces of Simian virus 40 (SV40). It had 1 908 060 atoms and a diameter of about 500 Å. Isosurfaces of ±1KT∕e obtained at a 0.9 Å resolution for this virus are shown in Fig. 17. In experimental studies, it was found SV40 has seven pentamers forming a cluster with a hexavalent one surrounded by six others.61 This symmetry was reflected in the location of Glu330 and Glu160 at the Ca2+ binding sites. Figure 17c shows the −35KT∕e isosurface of SV40. This electrostatic potential distribution is consistent with the observed distribution of Ca2+ binding sites shown in Fig. 17d.61 The highly negative electrostatic potential in these sites supports strong cation binding there, which suggests that PBms facilitated the discovery of electrostatic interaction sites.
Figure 17.
+1KT∕e (blue) −1KT∕e (red) potential isosurfaces for SV40 capsid immersed in 0.125 M NaCl computed using PBms; (a) external view; (b) cut-away view; (c) the −35KT∕e (pink) isosurface, black dots are used to represent the hexavalent symmetry of the potential distribution; and (d) Ca2+ binding sites on the SV40 surface.
CONCLUSIONS
An efficient numerical method for calculating the electrostatic potential based on multiscale analysis was validated. Our methodology enabled the simulation of large supramolecular assemblies, making electrostatic simulation of complex systems such as nucleic acids and viruses possible in reasonable time and using limited computational resources. The accuracy of our results to O(σ2) justified the multiscale ansatz and the decomposition of the charge density. We demonstrated convergence and probed conditions under which the theory breaks down using a Padé approximant analysis to reveal anomalies in the complex length scale ratio (σ) plane. The approach was demostrated on CCMV, STMV, and SV40. As with other field theoretic approaches, the method is expected to break down for tight binding problems such as involving complexes of divalent ions and RNA. However, the scaling approach could be applied to extended PB models which incorporate corrections for tight binding (Stern layer)49 and finite ion size.62 Accuracy and efficiency of the method are realized for systems with well separated characteristic lengths (e.g., the average nearest-neighbor atom distance versus the overall size of a nanostructure). One of the advantages of the approach is that it automatically generates the σ (and hence salinity) dependence of the potential, thereby allowing for efficient parameter studies. The theory revealed biologically relevant details on structural features such as the location of calcium binding sites on SV40 pentamers.
Even though the theory was developed and implemented for two scales, it can be generalized to account for additional scales. We believe our PBms solver is a valuable asset for solving a variety of bionanosystem electrostatics problems. For example, it could be used to solve Poisson’s equation coupled to reaction transport laws for the mobile ions to simulate time-dependent phenomena. The speed-up of PBms could be improved via use of other linear solvers63 to compute , θ, and ψ and by optimizing various aspect of the PBms workflow (notably parallelization). PBms will be compatible with standard graphics and molecular manipulation codes.
ACKNOWLEDGMENTS
We appreciate of the efforts of the JCP editor and reviewers whose suggestions greatly improved the manuscript. We thank Professor H. Kasamatsu for allowing us to use Fig. 17d to illustrate calcium binding effects. This project is supported in part by DOE (Grant No. DE-FG02-05ER25676), NIH NIBIB (Grant No. R21 EB008951), the NSF CRC Program (Grant No. CHE-082651), and Indiana University College of Arts and Sciences and METAcyt through the Center of Cell and Virus Theory.
APPENDIX A: DERIVATION OF THE MULTISCALE PB EQUATION
For simplicity, first consider the PB equation in one dimension. Equation 2.1 in one dimension becomes
| (A1) |
In light of the argument given in Sec. 2, the dependence of Φ is assumed to be Φ(X,x), where X=σx. Therefore
As X=σx,
| (A2) |
Making similar calculations for the PB equation, one obtains the multiscale PB equation in one dimension
| (A3) |
Since the total charge density f can be written as a sum of discrete fd and continuous fc densities, Eq. A3 becomes
| (A4) |
Extending Eq. A4 in three dimensions yields Eq. 2.2
| (A5) |
where
for , where and .
APPENDIX B: ANALYSIS OF THE FIRST ORDER EQUATIONS
To O(σ) in the perturbation series, one obtains
| (B1) |
To solve this equation, define a variable as in Eq. 3.3 that is the solution of
| (B2) |
Here, α designates the direction x, y, or z.
Since Eq. B1 is linear in Φ1, Φ1 can be written as a sum of two terms. Define ψ such that
| (B3) |
This implies
| (B4) |
Since Φ* is independent of , . Therefore,
| (B5) |
Inserting Eq. B5 in Eq. B1 implies
| (B6) |
That and implies
| (B7) |
Collecting the above results implies
| (B8) |
Using Eq. B2 yields
| (B9) |
This justifies Eq. 3.4.
Let bα=cα−rα. With Eq. B2, this implies
As , this yields , justifying Eq. 3.5.
APPENDIX C: PROPERTIES OF SAMPLING FUNCTION W
A motivation for the properties of the weighting function W is as follows. Define an averaging ⟨…⟩
| (C1) |
When A is of the form , e.g., for ,
| (C2) |
Using implies
| (C3) |
Using the divergence theorem, the first term becomes , where is a unit vector normal to the surface of integration S, taken at infinity when considering nanosystem to be immersed in a virtually infinite medium. Since the integrand is zero far from the nanosystem, the integral is zero.
The second term is of the form . We choose W to be nonzero in a zone of diameter O(σ−1∕2) and to only have spatial variations on a scale of O(σ−1∕2) within this zone, allowing W to mediate local averaging. For example, one may choose
| (C4) |
to sample space in the vicinity of a point . With this is O(σ). When written in this way, W enables averaging over a zone of intermediate size, i.e., much greater than O (σ0) and much less than O(σ−1).
Thus multiplying both sides of Eq. 3.6 with W and integrating over imply that all the integrands being O(σ0), their volume of integration is O(σ−3) yielding contributions of the O(σ−3). However, in accordance with the previous set of arguments, is reduced to . being becomes O(σ−2) and therefore can be neglected in comparison to the other terms as σ→0. This justifies Eq. 3.7. A particular choice of Δ is nearest-neighbor distance between atoms in the nanosystem, i.e., a few angstrom. This makes the averaging distance σ−1∕2Δ to be a few nanometers and mediates local averaging.
References
- Fenley A. T., Gordon J. C., and Onufriev A., J. Chem. Phys. 129, 075101 (2008). 10.1063/1.2956497 [DOI] [PMC free article] [PubMed] [Google Scholar]
- Lu B. Z., Zhou Y. C., Holst M. J., and McCammon J. A., Comm. Comp. Phys. 3, 973 (2008). [Google Scholar]
- David L. and Field M. J., J. Comput. Chem. 18, 343 (1997). [DOI] [Google Scholar]
- Vorobjev Y. and Scheraga H. J., J. Comput. Chem. 18, 569 (1997). [DOI] [Google Scholar]
- Bordner A. J. and Huber G. A., J. Comput. Chem. 24, 353 (2003). 10.1002/jcc.10195 [DOI] [PubMed] [Google Scholar]
- Nicholls A. and Honig B. J., J. Comput. Chem. 12, 435 (1991). 10.1002/jcc.540120405 [DOI] [Google Scholar]
- Bruccoleri R. E., Novotony J., Davis M. E., and Sharp K. A., J. Comput. Chem. 18, 268 (1997). [DOI] [Google Scholar]
- Grant J. A., Pickup B., and Nicholls A., J. Comput. Chem. 22, 608 (2001). 10.1002/jcc.1032 [DOI] [Google Scholar]
- Balls G. T. and Colella P., J. Comput. Phys. 180, 25 (2002). 10.1006/jcph.2002.7068 [DOI] [Google Scholar]
- Boschitsch A. H. and Fenley M. O., J. Comput. Chem. 25, 935 (2004). 10.1002/jcc.20000 [DOI] [PubMed] [Google Scholar]
- Sayyed-Ahmad A., Tuncay K., and Ortoleva P., J. Comput. Chem. 25, 1068 (2004). 10.1002/jcc.20039 [DOI] [PubMed] [Google Scholar]
- Baker N. A., Sept D., Joseph S., Holst M. J., and McCammon J. A., Proc. Natl. Acad. Sci. U.S.A. 98, 10037 (2001). 10.1073/pnas.181342398 [DOI] [PMC free article] [PubMed] [Google Scholar]
- Holst M. and Saied F., J. Comput. Chem. 14, 105 (1993). 10.1002/jcc.540140114 [DOI] [Google Scholar]
- Chandrasekhar S., Astrophys. J. 97, 255 (1943). 10.1086/144517 [DOI] [Google Scholar]
- Bose S. and Ortoleva P., J. Chem. Phys. 70, 3041 (1979). 10.1063/1.437790 [DOI] [Google Scholar]
- Bose S. and Ortoleva P., Phys. Lett. A 69, 367 (1979). 10.1016/0375-9601(79)90435-3 [DOI] [Google Scholar]
- Bose S. and Ortoleva P., J. Chem. Phys. 72, 4258 (1980). 10.1063/1.439718 [DOI] [Google Scholar]
- Bose S., Medina-Noyola M., and Ortoleva P., J. Chem. Phys. 75, 1762 (1981). 10.1063/1.442254 [DOI] [Google Scholar]
- Deutch J. M. and Oppenheim I., Faraday Discuss. Chem. Soc. 83, 1 (1987). 10.1039/dc9878300001 [DOI] [Google Scholar]
- Ortoleva P., Nonlinear Chemical Waves (Wiley, New York, 1992). [Google Scholar]
- Shea J. E. and Oppenheim I., J. Phys. Chem. 100, 19035 (1996). 10.1021/jp961605d [DOI] [Google Scholar]
- Shea J. E. and Oppenheim I., Physica A 247, 417 (1997). 10.1016/S0378-4371(97)00407-X [DOI] [Google Scholar]
- Peters M. H., J. Chem. Phys. 110, 528 (1999). 10.1063/1.478176 [DOI] [Google Scholar]
- Peters M. H., J. Stat. Phys. 94, 557 (1999). 10.1023/A:1004533421777 [DOI] [Google Scholar]
- Coffey W. T., Kalmykov Y. P., and Waldron J. T., The Langevin Equation with Applications to Stochastic Problems in Physics, Chemistry and Electrical Engineering (World Scientific, River Edge, 2004). [Google Scholar]
- Ayala P. Y., Scuseria G. E., and Savin A., Chem. Phys. Lett. 307, 227 (1999). 10.1016/S0009-2614(99)00498-4 [DOI] [Google Scholar]
- Almlof J., Chem. Phys. Lett. 181, 319 (1991). 10.1016/0009-2614(91)80078-C [DOI] [Google Scholar]
- Cramer C. J., Essentials of Computational Chemistry: Theories and Models, 2nd ed. (Wiley, New York, 2004). [Google Scholar]
- Gogonea V., Westerhoff L. M., and K. M.Merz, Jr., J. Chem. Phys. 113, 5604 (2000). 10.1063/1.1290608 [DOI] [Google Scholar]
- Lin H. and Truhlar D., Theor. Chem. Acc. 117, 185 (2007). 10.1007/s00214-006-0143-z [DOI] [Google Scholar]
- Araki H., Ehlers J., Hepp K., Kippenhahn R., Weidenmuller A. H., Weiss J., and Zittartz J., Homogenization Techniques for Composite Media (Springer-Verlag, Berlin, 1987). [Google Scholar]
- Bensoussan A., Lyons J. L., and Papanicolnon G., Asymptotic Analysis for Periodic Structures (North-Holland, Amsterdam, 1978). [Google Scholar]
- Ene H., Dynamics of Fluid in Hierarchical Porous Media (Academic, Kent, 1990). [Google Scholar]
- Hornung U., Composite Media and Homogenization Theory: An International Center for Theoretical Physics Workshop, Trieste, Italy, January 1990. (Birkhauser, Boston, 1991). [Google Scholar]
- Keller J., Statistical Mechanics and Statistical Method in Theory and Application (Plenum, New York, 1977). [Google Scholar]
- Ortoleva P., Basin Compartments and Seals (AAPG, Tulsa, 2002). [Google Scholar]
- Tuncay K. and Ortoleva P., Probability Functionals, Homogenization and Comprehensive Reservoir Simulators. Resource Recovery, Confinement, and Remediation of Environmental Hazards, Institute of Mathematics and its Application (Springer-Verlag, New York, 2002). [Google Scholar]
- Ortoleva P., J. Phys. Chem. B 109, 21258 (2005). 10.1021/jp051381b [DOI] [PubMed] [Google Scholar]
- Miao Y. and Ortoleva P., J. Chem. Phys. 125, 044901 (2006). 10.1063/1.2218838 [DOI] [PubMed] [Google Scholar]
- Miao Y. and Ortoleva P., J. Chem. Phys. 125, 214901 (2006). 10.1063/1.2400858 [DOI] [PubMed] [Google Scholar]
- Pankavich S., Miao Y., Ortoleva J., Shrif Z., and Ortoleva P., J. Chem. Phys. 128, 234908 (2008). 10.1063/1.2931572 [DOI] [PMC free article] [PubMed] [Google Scholar]
- Burridge R. and Keller J. B., J. Acoust. Soc. Am. 70, 1140 (1981). 10.1121/1.386945 [DOI] [Google Scholar]
- Holst M., Baker N., and Wang F., J. Comput. Chem. 21, 1319 (2000). [DOI] [Google Scholar]
- Lindermann F. A., Z. Phys. 11, 609 (1910). [Google Scholar]
- Zhou Y., Karplus M., Ball K. D., and Berry R. E., J. Chem. Phys. 116, 2323 (2002). 10.1063/1.1426419 [DOI] [Google Scholar]
- Truskett T. M., Torquato S., Sastry S. Debenedetti P. G., and Stillinger F. H., Phys. Rev. E 58, 3083 (1998). 10.1103/PhysRevE.58.3083 [DOI] [Google Scholar]
- Eaton A. C., Goodyear G., and Haymet A. D. J., Phys. Chem. Chem. Phys. 3, 3778 (2001). 10.1039/b103910p [DOI] [Google Scholar]
- Biggin S. and Enderby J. E., J. Phys. C 15, L305 (1982). 10.1088/0022-3719/15/11/001 [DOI] [Google Scholar]
- Tan Z. and Chen S., J. Chem. Phys. 122, 044903 (2005). 10.1063/1.1842059 [DOI] [Google Scholar]
- Fogolari F., Zuccato P., Esposito G., and Viglino P., Biophys. J. 76, 1 (1999). 10.1016/S0006-3495(99)77173-0 [DOI] [PMC free article] [PubMed] [Google Scholar]
- Chapot D., Lydéric B., and Emmanuel T., J. Colloid Interface Sci. 285, 609 (2005). 10.1016/j.jcis.2004.11.059 [DOI] [PubMed] [Google Scholar]
- Adams J., Appl. Math. Comput. 34, 113 (1989). 10.1016/0096-3003(89)90010-6 [DOI] [Google Scholar]
- Blackburn J. C. and Kilpatrick P. K., Ind. Eng. Chem. Res. 35, 2823 (1996). 10.1021/ie950343j [DOI] [Google Scholar]
- Wang M. and Chen S., Comm. Comp. Phys. 3, 1087 (2008). [Google Scholar]
- Konecny R., Trylska J., Tama F., Zhang D., Baker N. A., C. L.BrooksIII, and McCammon J. A., Biopolymers 82, 106 (2006). 10.1002/bip.20409 [DOI] [PMC free article] [PubMed] [Google Scholar]
- Ahmad A., Miao Y., and Ortoleva P., Comm. Comp. Phys. 3, 1100 (2008). [Google Scholar]
- Ojha R. P. and Tiwari R. K., Nucleic Acids Res. 31, 6373 (2003). 10.1093/nar/gkg796 [DOI] [PMC free article] [PubMed] [Google Scholar]
- Gruziel M., Grochowski P., and Trylska J., J. Comput. Chem. 29, 1970 (2008). 10.1002/jcc.20953 [DOI] [PMC free article] [PubMed] [Google Scholar]
- Baker G. A. and Morris P. G., Padé Approximants (Encyclopedia of Mathematics and its Applications) (Cambridge University Press, Cambridge, 1996). [Google Scholar]
- Ortoleva P., J. Chem. Phys. 69, 300 (1978). 10.1063/1.436353 [DOI] [Google Scholar]
- Li P., Naknanishi A., Tran M. A., Ishizu K. I., Phillips M., Hiroshi H., Liddington R. C. and Kasamatsu H., J. Virol. 77, 7527 (2003). 10.1128/JVI.77.13.7527-7538.2003 [DOI] [PMC free article] [PubMed] [Google Scholar]
- Chu V. B., Bai Y., Jan L., Herschlag D., and Doniach S., Biophys. J. 93, 3202 (2007). 10.1529/biophysj.106.099168 [DOI] [PMC free article] [PubMed] [Google Scholar]
- Holst M. J. and Saied F., J. Comput. Chem. 16, 337 (1995). 10.1002/jcc.540160308 [DOI] [Google Scholar]
- Rouzina I. and Bloomfield A., Biophys. J. 74, 3152 (1998). 10.1016/S0006-3495(98)78021-X [DOI] [PMC free article] [PubMed] [Google Scholar]
- McQuarrie D. A., Statistical Mechanics (Harper Collins, New York, 1976). [Google Scholar]


