1. Introduction
The conundrum of modality selection in clinical diagnostic imaging is that modalities with the highest sensitivity have relatively poor resolution, while those with high resolution have relatively poor sensitivity. In recent years, the idea of using multiple modalities in conjunction has gained in popularity and researchers have come to realize that the complementary abilities of different imaging modalities could be harnessed to great effect by using them in tandem. The idea of combining imaging technologies moved to the mainstream with the advent of the first successful commercial fused instruments. The first fused PET/CT instrument, developed in 1998 by Townsend and colleagues in collaboration with Siemens Medical, was available commercially in 2001. The “Biograph” was named as one of the “Inventions of the Year” in 2000 by Time magazine, and its success was such that by 2003 fused PET/CT instruments were available from all of the major clinical instrument manufacturers, GE, Philips, CTI, and Siemens.1 Over the ensuing years, PET/CT sales increased with such vigor that by the year 2006 there were virtually no sales of standalone PET instruments; all PET sales were as part of multimodality systems.2–4 The next wave of innovation has been in PET/MRI-fused instruments, which have generated much hope for improved patient safety and imaging capability over PET/CT. Although research on PET/MRI instruments was initiated around the same time as PET/CT, the economic and engineering challenges of merging the two modalities slowed development, and the first commercial PET/MRI prototype for a human scale hybrid scanner was not unveiled until 2007.5,6 With hybrid technology clearly on the rise, the excitement over these new instruments has triggered a tumult of activity in probe design and development as investigators seek to boost the clinical benefits of hybrid instrument technology.
As the preponderance of recent reviews and increase in attention at scientific meetings will attest, there has been a surge in research on multimodal contrast agent development over the past few years.5,7–17 For molecular imaging, particularly, the rise in multimodal instrumentation has sparked hopes for new ways to track multiple molecular targets simultaneously, or to use different imaging methods in combination to more clearly delineate localization and expression of biochemical markers. In the best of situations, the combined imaging methods and probes work synergistically to allow high-resolution, high-sensitivity investigation of biological activity. For example, with dual function probes for PET/MRI, the high sensitivity of PET can be used as a whole body screen to identify regions of interest, thereby reducing the volume of tissue that needs to be scanned; this reduces scan time required for high-resolution imaging by MRI.5,18 However, probe design and development has sometimes preceded the identification of clear applications that merit use of the multimodal principle. There are many literature examples of probes that are “all dressed up with nowhere to go”; they possess unique physical properties that have yet to find a clear province in medicine or biology. Nonetheless, it is not unusual for technology to sometimes presage the need, and it is these advances that can spur imaginative solutions to problems that had been intractable with the previously existing technology. The goal of multimodal functionality has already reaped benefits by driving innovation in many areas of chemical synthesis, most notably in nanotechnology.
While combining multimodal detectability in the same probe is not necessitated by all applications, there can be advantages to this arrangement. A single probe helps to ensure the same pharmacokinetics and colocalization of signal for each modality if that is a concern. It also can avoid putting the additional stress on the body’s blood clearance mechanisms that can accompany administration of multiple doses of agents. The caveat is that because the sensitivities of different imaging modalities can vary by 3 orders of magnitude, it may not be practical to simply add all functionalities to one molecule, although we will see that is a common design, because the requirements for contrast agent concentrations can be vastly different between modalities. In this review, we provide an overview of the many strategies that have been applied to achieve multimodal functionality in a single probe unit. These span the range from small molecule to nanoparticulate systems and vary in complexity from facile encapsulation or conjugation of commercially available probes to de novo synthesis. This review is limited to reports from the last approximately 5 years that deal with agents that carry two or more species of contrast enhancers. Tables summarizing the physical properties from cited articles are included with each major category of probe to facilitate “browsing” by the reader.
2. Lipid-Based Approaches
Lipid-based vehicles loaded with contrast agents were one of the earliest explored for multimodal applications and have been summarized in many recent reviews.19–23 For delivery to the bloodstream, the lipid carrier system would have a hydrophilic surface and some combination of internal hydrophobic domains. The dual-phase character of these vehicles allows one to position contrast agent payloads in either hydrophobic or hydrophilic compartments, as part of the lipid framework or free in the aqueous core, respectively. In this section, we provide an overview for both types of approaches and combinations thereof.
2.1. Liposome as Carriers
2.1.1. Contrast Agent in Aqueous Core: Encapsulation
One of the conceptually simplest approaches to generating multimodal contrast agents is to encapsulate more than one type of contrast agent into the aqueous phase of liposomes (Table 1). Liposomes are hollow spheres of lipids that range in structure from unilamellar bilayers or monolayers to multilamellar onion-like formulations to multicompartment configurations with smaller vesicles contained in a larger sphere.19 Common methods for synthesis include mechanical dispersion, solvent dispersion, emulsion preparation, or detergent solubilization.24 Each approach relies on some method to disperse the lipid in a solution, typically after drying the lipids, so that the lipids may self-assemble into various forms of lipid spheres with aqueous centers. Any soluble molecule can be encapsulated to the core of the liposomes by inclusion in the aqueous solution during liposome formation. This allows generation of various combinations of contrast agents in the same nanocarrier, without requiring any structural modification of the original contrast agent, in ratios proportional to their concentrations in the initial solution. This method works well if the agents of interest are water-soluble but relies on the absence of leakage of the free probes from the liposome core.
Table 1.
| probes | modalities | size (nm) | imaging properties | ref |
|---|---|---|---|---|
| Lipid Encapsulation | ||||
| iohexol and gadoteridol | CT/MRI | 74 | 36 HU/(mg iodine and 0.2 mg Gd3+) in 1 mL of HBS; 120 kV, 300 mA; r1 = 1.2 mM−1 s−1, r2 = 1.5 mM−1 s−1 (1.5 T) | 25, 26 |
| Ferridex (Magnevist), rhodaDOPE, FITC or DY647-siRNA | MRI/optical | 162–304 | tissue T1 and T2 (9.4 T) | 28 |
| perfluorocarbon | 19F-MRS/ultrasound | 150–6000 | 6 dB; T1 and T2 only (9.4 T, rt), 13.5 dB | 34 |
| perfluoropolyether and FITC, or Alexa647 or BODIPy-TR | 19F-MRS/optical | 160–190 | 19F-MRS at 470 MHz, shift at −90.58 ppm (to TFA); λem = 625 nm | 36 |
| Lipid-Linked | ||||
| Gd–lipid rhoda-PE, fluorescein–lipid | MRI/optical | 85 | r1 = 3.9, r2 = 6.5 mM−1 s−1 (4.7 T, rt); λem = 570 nm | 44 |
| 250, 100 | T1 at single concentration (4.7 T); λem = 585 nm | 43 | ||
| 150 | T1 at single concentration (6.3 T) | 328 | ||
| 5–15 × 250 | r1 = 13–18 mM−1 s−1 (0.47 T) | 45 | ||
| GdAcAc (membrane) and/or GdDTPA and 166Ho or 99mTc DTPA | MRI/therapy/SPECT | 123–138 | 1.2–5 mM−1 s−1 (1.5 T); 0.6–3 mM−1 s−1 (3 T) | 50 |
| hydrophobic CdSe and CaCl2 | optical/cargo delivery | 1000–50000 20–100 |
λem ≈ 540 nm | 51 |
| Lipid-Linked and Encapsulation | ||||
| Gd–lipid plus perfluorocarbon | MRI/ultrasound | 250 | T1 only (1.5 T) | 55 |
| Gd–lipid, perfluorocarbon and 99mTc DTPA | SPECT/CT/MRI | 270 | imaging only precedence SPECT–CT; 120 keV; 3 T | 57 |
| Gd–lipid, rhoda-DOPE, calcein | MRI/optical/sensor | 120–150 | 5.5 mM−1 s−1 (1.5 T, rt) 5.2 mM−1 s−1 (7 T, rt) | 46 |
| Lipoprotein as Carrier | ||||
| LDL surface: Gd–lipid, NIRF LDL core: NIRF, chlorin or phthalocyanine |
MRI/optical/therapy | 22 | 100–500 Gd3+ per LDL, 6.5 mM−1 s−1 for 180 Gd3+/LDL (4.7 T) | 20 |
| HDL core: gold, FeO, QD HDL surface: GD–lipid, rhod-DMPE |
MRI/optical/CT | 12–20 | MR imaging only; λem = 623 nm; 2.5 HU/mM Au, 110 keV; 9.4 T | 58 |
For example, in recent work, the CT-visible iodohexol (Omnipaque, Nycomed Imaging AS, Norway) and MRI-visible gadoteridol (ProHance, Bracco Diagnostics, NJ) were encapsulated into unilamellar bilayer liposomes using an extrusion process.25,26 The combination of CT and MRI are cited to be desirable for image-guided radiotherapy procedures where CT is used to perform radiation dose mapping and MRI provides soft tissue contrast to identify target tissues. The use of a hybrid probe allows co-registration without the use of invasive fiducial markers. Liposomes of ~70–85 nm diameter were generated, with a starting Omnipaque/ProHance volume ratio of 4:1 and final incorporation of 1:1.8 iodine/lipid and 1:35 gadolinium/lipid. The probes were applied to mice for pharmacokinetic characterization26 and to rabbits to assess efficiency for in vivo imaging.25 Amusingly, the latter work claims in the abstract to also have performed multimodal imaging on a lupine model; this is assumed to be a typo for lapine (rabbit) as there do not appear to be any images of wolves in the paper. Of note is that encapsulation efficiency is low, <20%, so that much of the original material is not incorporated to liposomes. This is not unexpected because the core volume for the liposomes would not represent a substantial fraction of the total volume unless the lipid density in solution was near gel-like concentrations, but it is something to be noted if the agent to be encapsulated is rare or expensive, so that reclamation processes can be employed to capture and preserve the unincorporated reagents for future use.
Encapsulation was found to increase plasma half-life, that is, the agents stayed in circulation longer than the individual probes would have. Half-life for iodohexol increased from 12.3 ± 0.5 min to 18.4 ± 2.4 h, and gadoteridol increased from 7.6 ± 0.9 min to 18.1 ± 1.5 h. The free small molecule agents are quickly cleared through the kidneys. The significantly improved circulation times greatly extend the opportunity for the agents to reach and bind to target tissues. No significant toxicity was observed. In these formulations, the agents are intended to remain stably encapsulated by the liposomes, and the authors conclude from the results that the agents are not released at time of measurement. By this scheme, the distribution and diffusion of the agents through tissue will be different than the free molecules, and tissue targeting will have to be achieved by modifying the liposome surface. The double-edged sword that comes of increasing circulation time is that there is greater confinement of the agent to the vasculature. Indeed these liposome-encapsulated agents would make good intravascular agents, but penetration to tissues for molecular imaging applications will require further modifications to the system either by attachment of targeting groups or by changes to the lipid properties.
Tissue penetration can be achieved, for example, by modifying the lipid composition to one that allows uptake by cells or fusion to cell membranes and release of core contents. Cationic liposomes possess these traits and, thus, have been intensely studied as nonviral vectors for gene delivery.27 The positively charged liposome surface interacts electrostatically with cell membranes, which are typically negatively charged, to increase uptake by cells. The charge also facilitates complexation with DNA payloads, so that “loading” of these liposomes can be by a more efficient process than the encapsulation method discussed earlier. In recent work by the Bhujwalla group, this method was applied to deliver silencing RNA sequences (siRNA) to cells using cationic liposomes carrying Ferridex or Magnevist (Bayer Healthcare/Advanced Magnetics, MA) and fluorescent dyes.28 The researchers sought to deliver therapeutic siRNA to silence COX-2, a key enzyme in the inflammatory pathway that is upregulated in several cancers. Several configurations of contrast agent, lipid, and siRNA were studied in this work, and the most successful configuration for achieving specific downregulation of the enzyme was liposomes carrying rhodamine-labeled lipid on the surface that encapsulated Ferridex particles and fluorescently labeled siRNA (FITC for in vitro studies, Dy-647 for in vivo). Ferridex (110 μg/mL) and siRNA were encapsulated during liposome formation (including 0.2% DOPE-rhodamine B), and the liposomes were purified by size exclusion chromatography with Sepharose Cl-2B (Sigma-Aldrich) and Microcon YM-100 spin column. MRI was used to image COX-2 siRNA delivery to tumors in mouse models. Because the liposomes were not targeted, tissue labeling was due to the enhanced permeability and retention effect (EPR).29,30 The EPR effect was described quite some time ago from the observations that tumor vasculature is highly permeable and tumor tissues have poor lymphatic drainage. As a result, circulating high molecular weight species, which escape renal clearance, leak readily into tumor tissue but are cleared slowly, resulting in enhanced localization in tumors. In Bhujwalla’s work, Ferridex allowed confirmation of intratumoral delivery of the liposomes by MRI. Fluorescence microscopy was used in followup histology to verify siRNA delivery to cells. Cationic liposomes are not without their drawbacks, however. Studies noted a high fraction of lipoplexes localized to lung, liver, kidney, and spleen, which was consistent with previous literature on cationic liposome biodistribution. No significant liver toxicity was noted in the current work, but the high localization to “bystander” tissues is a factor to be considered if a therapeutic payload is also to be carried and should be considered when determining dose limits to patients.
Multimodal functionality does not always require incorporation of multiple molecular species as some molecules can themselves be detected by more than one modality. Good examples of materials with dual properties are perfluorocarbons, which are detectable by both ultrasound and MRI. Perfluorocarbons have long been of interest as fluorine-19 MRI agents and possess a number of favorable properties for biological imaging. As a material, perfluorocarbons are biologically inert (not metabolized by the body) and able to dissolve large amounts of oxygen, which has led to interesting research on using these materials as blood substitutes or to image the lung.31 Fluorine-19 has many favorable attributes for MRI, with a 40.05 MHz/T gyromagnetic ratio (compared with 42.59 MHz/T for hydrogen), spin 1/2, relative and absolute sensitivity of 0.83, 100% natural abundance, and no naturally occurring presence in solution in the body (it is found in bone and teeth).31–33 Perfluorocarbons are roughly twice as dense as water and are hydrophobic; thus, they have been used as emulsions, with or without encapsulating agents. As nanoemulsions, perfluorocarbons have been found to have useful ultrasound properties.34 Perfluorocarbons have been studied for ultrasound35 and MRI applications,31–33 separately, and relatively recently attention has turned to combined MR and ultrasound imaging using agents carrying perfluorocarbons.
A recent work describes polymeric shells with a liquid perfluorooctyl bromide core, dubbed “capsules”.34 While these are not liposomes, per se, they are included in this section because they have a bit more in common with liposomes than they do with the other polymer nanocarriers that will be discussed later in this review. Like liposomes they consist of a relatively solid shell encapsulating a liquid core; however, unlike liposomes, the core contains organic perfluorocarbons. The addition of the polymer capsule protects the perfluorooctyl core from environmental factors that can affect chemical shift. Similar to one of the methods described for liposome preparation, microcapsules were formed by an emulsification process and high-energy sonication with a Vibra cell tip (Bioblock Sci, France). Poly-(lactide-co-glycolide) Resomer PG502 in methylene chloride was emulsified into a sodium cholate solution in this fashion; this yielded 150 nm nanocapsules.35 If less vigorous dispersion methods were used (Ultra-Turrax T25, IKA-Labortechnik, Germany), 6 μm diameter capsules were formed. For some studies, Nile Red was added to the organic phase to yield a trimodal fluorescence–ultrasound–MRI visible probe. The probes were imaged as solutions by 19F-MRI spectroscopy and were injected i.v. into NMRI-nu (nu/nu) mice for ultrasound imaging in vivo. Both types of images showed significant contrast over background. A clear application that would benefit from combined ultrasound, fluorescence and MRI was not provided in this work, but one could envision applying MRI to first locate and map boundaries for a tumor, then applying ultrasound guidance during surgical resection, followed by optical methods to confirm that all tumor cells were removed.
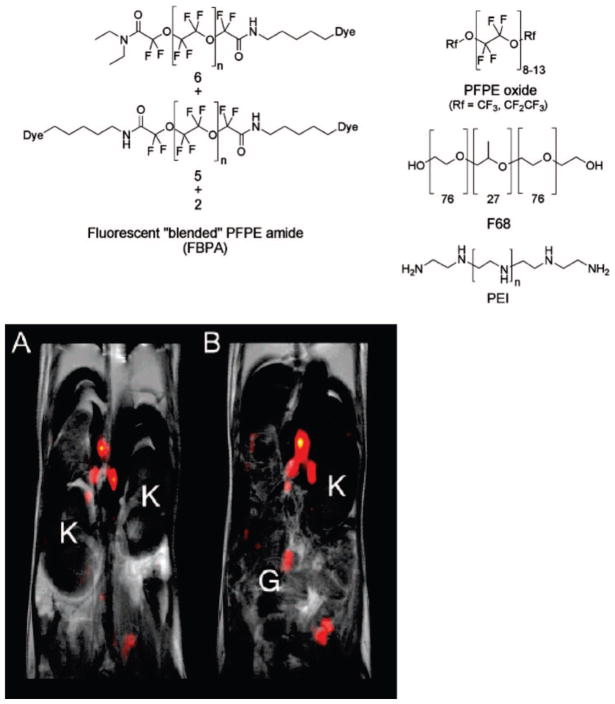
In another example of emulsion-based, dual-function perfluorocarbon probes, perfluorpolyethers (PFPE) were conjugated to fluorescent probes and formed into nanoemulsions with pluronic F68 and linear polyethylenime (PEI).36 This is an extension of earlier work employing emulsified perfluoro-15-crown-5 ether, which was developed primarily for MRI. In the more recent studies, a commercially available PFPE methyl ester (Exfluor Inc., Round Rock, TX, PFPE methyl ester 1) was coupled through the primary amine of an organic fluorophore (BODIPy-TR, FITC, or Alexa647) that had been coupled to cadaverine (1,5-diaminopentane) (Figure 1a). The fluorophore was coupled to cadaverine through one of the available amines, leaving the other end available for reaction with the PFPE ester. The reaction proceeded in trifluorethanol, because this was the only solvent able to solubilize both reactants, and yielded a mixture of mono-, di-, and unconjugated PFPE amides (the fluorophore conjugates are termed FBPA). With a high pressure homogenizer, the FPBA were employed along with PFPE oxides, F68, and PEI to form nanoemulsions of 160–190 nm in diameter (measured by dynamic light scattering, DLS). Shelf life tested over 5 months showed no change in size under storage at 4 or 25 °C. The nanoemulsions were filter-sterilized (0.22 μm) and used as is without further purification in a variety of in vitro and in vivo cell-labeling experiments. In vitro, the nanoemulsions were incubated with Jurkat, mouse DC, or primary T cells. Jurkat cells are an immortalized, nonadherent line derived from T lymphocytes in the blood and are commonly used to assess cancer susceptibility to drugs. The mouse dendritic cells (DC) were employed as an adherent cell line counterpoint. In all cell lines, the nanoemulsions appeared as vesicular patterns in the cytoplasm, they did not appear to localize to membranes. Hence the nanoemulsions appear to be entering cells intact, as opposed to fusing with cell membranes. Both 19F spectroscopy and fluorescence imaging were performed on cells. As an in vivo study, T cells were isolated from a BALB/c mouse, labeled with the nanoemulsions, and reintroduced to the mouse intraperitoneally. Signal enhancement was found in areas presumed to be lymph nodes in the 19F MR images (Figure 1b). Compared with their earlier work with perfluoro-15-crown-5 ether, the perfluoropolyethers were found to be less sensitive to environmental perturbation and more amenable to chemical modification.
Figure 1.
Polyperfluoroether coupled to cadaverine and organic fluorophore. A mixture of FBPA, PFPE oxide, and PEI is used to form nanoemulsions. 19F MR overlaid with 1H MRI images show signal enhancement in lymph nodes. In the lower panel, A and B are consecutive 2 mm slices through the torso: K = kidney; G = gut. Reproduced with permission from ref 36. Copyright 2008 American Chemical Society.
One of the disadvantages to the use of perfluorocarbons is that the long relaxation times for some perfluorocarbons can result in long acquisition times. To reduce acquisition time, some researchers have introduced paramagnetic ions to perfluorocarbon-containing probes in order to shorten relaxation times.37,38 Furthermore, in the late 1970s, work on perfluorocarbon emulsions found that retention by the reticuloendothelial system was long-term, up to years in some cases.31,39,40 Although they are inert, long-term retention of any exogenous agent is less desirable. Encapsulation and surface modification (such as PEGylation) are methods to reduce clearance and, thus, prevent subsequent retention in clearance organs. Alternatively, a few of the papers cited above are investigating use of the probes not for systemic application but to label exogenous cells for cell tracking in vivo. Long-term retention by cells would be an advantage in these types of applications.
2.1.2. Contrast Agent as Part of Liposome: Lipid-Linked
The dual-phase character of liposomes means that hydrophilic imaging probes can be carried in the core, as described above, or hydrophobic imaging probes can be carried as part of the liposomal membrane. This is accomplished either by using an imaging probe that is hydrophobic to insert into the membrane or by attaching a hydrophilic probe to a lipid. Both examples can be found in the recent literature with the latter approach being more common. Coupling to lipids can occur as a simple conjugation of a contrast agent to a polar headgroup or by more advanced chemistry to use the hydrophilic agent as the headgroup for a lipid. For example, gadolinium chelates for MRI41 and iodinated contrast agents for CT42 have both been conjugated to lipid head groups and used to form liposomes for use with these modalities. The new wave of multimodal imaging research has seen a surge in reports for liposomes containing more than one contrast agent-modified lipid, most commonly for combination of Gd probes and fluorophores.
A number of groups have reported synthesis of liposomes containing a rhodamine phosphotidylethanolamine derivative and a homemade Gd–lipid for bimodal MR and fluorescence imaging.43–45 Two groups report the use of Gd–chelate–bis(stearylamide), either purchased commercially45,46 or synthesized in house.43 For the latter group, the development of Gd–DOTA–DSA, Gd(III) 2-{4,7-bis-carboxymethyl-10-[N,N-distearylamidomethyl-N′-amidomethyl]-1,4,7,10-tetraazacylclododec-1-yl}acetic acid, followed on their work in which they coupled Gd–DOTA to cholesterol for incorporation to liposomes.47 In that work, Gd–DOTA NHS ester was coupled to N′-cholesteryloxy-3-carbonyl-1,2-diaminoethane in triethylamine as base. The ligand–cholesterol conjugate was purified by silica gel chromatography prior to metalation with Gd2O3 and then further purified by ion exhange. The Gd–DOTA–cholesterol derivatives were effective MRI agents, but cholesterol is relatively fluid and not firmly anchored to membranes; thus investigators turned their attention to saturated long-chain fatty acids. By modeling a phospholipid with two long chain alkyl moieties, they anticipated generating a more stable membrane-localizing probe.43
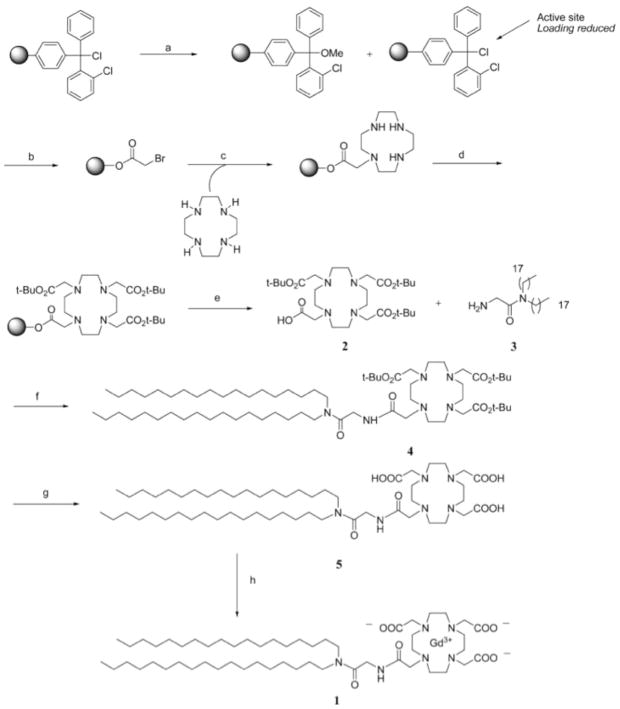
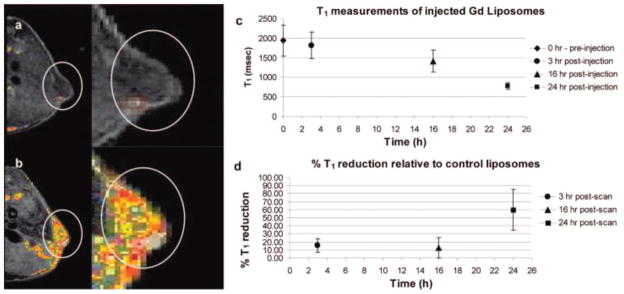
Gd–DOTA–DSA was synthesized as shown in Figure 2. The compounds were purified by flash chromatography after the addition of the tBu-protected DOTA groups, but there appeared to be no further purification after formation of the acetic acid and metalation. The product was freeze-dried and used as is. Gd–DTPA–BSA, Gd(III)[N,N-bis-stearylamidomethyl-N′-amidomethyl]diethylenetriamine tetraacetic acid, was also synthesized as a control using literature methods (Figure 3).48 All products were verified by 1H NMR, FTIR, HPLC, and HRMS. The Gd–lipids were used to form liposomes also containing DOPE-rhodamine (phosphatidylethanolamine–lissamine rhodamine B, Avanti Polar Lipids), and the ability of the liposomes to label HeLa cells in culture and xenograft tumors in the nude mouse model were investigated. The DSA derivatives were found to have improved enhancement capability over BSA derivatives at the same concentration. Eight different liposomal formulations were constructed using the DSA derivatives varying from 30% to 60% Gd–DOTA–DSA, and these were found to have minimal toxicity on cultured cells after 24 h incubation. The 30% Gd–DOTA–DSA formulation was able to reduce T1 values in solution even further than the BSA form. Gd–DOTA–DSA was further investigated and used to carry luciferase DNA into HeLa cells. Cells were successfully transfected with equal efficiency to Trojene (CDAN/DOPE = 50:50, CDAN = N1-cholesteryloxycarbonyl-3,7-diaza-1,9-diaminonane). The authors cite the successful transfection as proof of endocytosis as a mechanism for cell entry. The same formulation was also coated with PEG and delivered intravenously to nude mice implanted on the flank with IGROV-1 cells (human ovarian cancer). Contrast enhancement was observed in the tumors, which was further verified by fluorescence imaging of sectioned tumor tissue. Although the T1 in the tumor slices decreased gradually, the decrease in T1 relative to control liposomes (without gadolinium) did not show a significant difference until the 24 time point. The reason for this unusual kinetics was not discussed (Figure 4).
Figure 2.
Synthesis of GdDOTA labeled lipid. Reproduced with permission from ref 43. Copyright 2008 American Chemical Society. Reagents and conditions: (a) MeOH, DIEA, CH2Cl2, rt, 4 h; MeOH partial capping was used to prevent moleculer overcrowding in the chlorotrityl resin; (b) BrCH2COOH, DIEA, CH2Cl2, rt, 12 h; (c) cyclen, rt, 4 h; (d) BrCH2CO2C(CH3)3, Et3N, DMF, rt, 12 h; (e) TFEtOH/CH2Cl2, rt, 2 h, 69%; (f) HBTU, DMAP, dry CHCl3, 40 °C, 12 h, 88%; (g) conc. HCl/dioxane, rt, 2 h, 68%; (h) GdCl3, H2O, 90 °C, 12 h, 99%.
Figure 3.
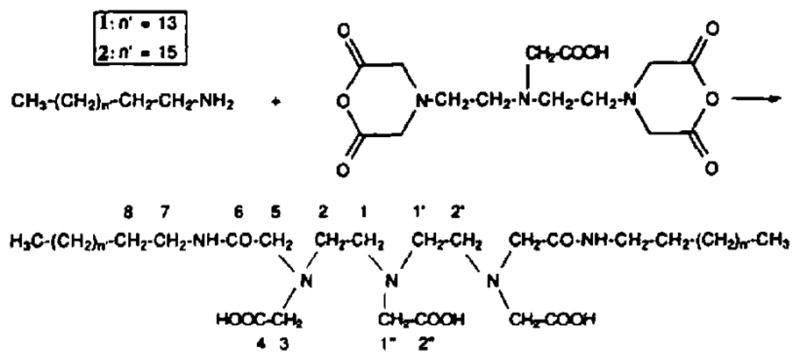
Synthesis of amphiphilic chelating agent. Reproduced with permission from ref 48. Copyright 1992 Elsevier.
Figure 4.
IGROV-1 tumors in the flanks of nude Balb/c mice: (a) MR images preinjection; (b) postinjection of Gd–liposomes; (c) T1 measurements from tumor slices show gradual reduction of T1 with time; (d) T1 reduction from animals injected with Gd–liposomes relative to tissue from animals injected with control liposomes (no gadolinium) is greatest at 24 h, with little difference in T1 reduction prior to that time point. Reproduced with permission from ref 43. Copyright 2008 American Chemical Society.
In another example, a different Gd–lipid was synthesized: N,N-bis[[[[[(13,15-pentacosadiynamido-3,6,9-trioxaundecyl)carbamoyl]methyl]-ethyl](carboxymethyl)amino]ethyl]glycine–gadolinium.44,49 The Gd-containing lipid was mixed with DOPE–rhodamine, DOTAP (1,2-dioleoyl-3-trimethylammonium-propane), and 1-palmitoyl-2,10,12-tricosodiynoyl-sn-glycero-3-phosphocholine (PC), dried, and resuspended in water under sonication to form liposomes (29% Gd–lipid, 1% Rhod–lipid, 20% DOTAP, 50% PC), then polymerized under UV light (254 nm) at 0 °C; the paper refers to the final product as nanoparticles. T47D breast cancer cells were incubated with the particles at concentrations from 0.348 to 1.4 mM Gd3+ for 2 h. T1-weighted MR and fluorescent images of pelleted cells showed good contrast. Similarly prepared cells were injected to flanks of C3H mice to form xenograft tumors. The animals were imaged 7 days after injection, and contrast is apparent in the injected flank by in vivo optical imaging (Maestro) and by T1-weighted MRI. Tissue sections from the tumors show fluorescence consistent with rhodamine localization, confirming the presence of particles in the tissue. Quantitation was not performed before and after so it is unknown whether there was any loss of label from the cells after injection.
The above applications are typical of MRI/optical combinations, where MRI or whole body optical can be used to track the probe distribution in the body. Although whole body optical is somewhat redundant and less powerful than MRI, the presence of a fluorophore allows confirmation of probe labeling in subsequent histology, and it is here, perhaps, that the optical imaging aspect of this multimodal system can provide the greatest benefit. A key concern in generating lipid-linked probes is ensuring that the probe rests in the desired environment after liposome formation. For Gd-based probes, this means that the Gd needs to be in the aqueous compartment and not embedded in the lipid membrane, where there is little access to water. The same is true for hydrophilic fluorophores, where environment can suppress emission intensity. The use of appropriate linkers between the probe and lipid moiety can influence this, as can the composition of the final liposome product and mechanism for incorporation to cells.
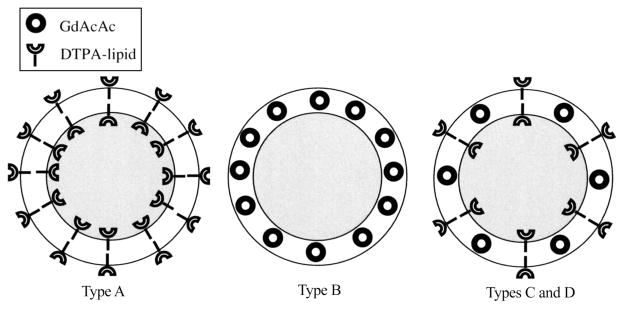
As final examples of contrast agents residing in the membrane, a hydrophobic agent can be carried directly in the membrane as illustrated recently by Zielhuis et al.50 and Gopalakrishnan et al.51 for two different types of hydrophobic probes. In Zeihuis’s work, GdAcAc (gadolinium acetylacetonate) was incorporated directly into liposomal membranes along with a commercial DTPA–lipid (diethylenetriamine-pentaacetic acid bisoctadecylamide, Gateway Chemical Technology Inc., St. Louis, MO) and the resulting liposomes were labeled with either 166Ho or 99mTc. GdAcAc synthesis followed methods from an earlier work.52 Several types of liposomes were prepared with different combinations of GdAcAc, Gd–DTPA–lipid, 166Ho–DTPA–-lipid, and 99mTc–DTPA–lipid residing in the membrane (Figure 5). The prepared liposomes were 123–138 nm diameter (by DLS). These constructions illustrate another observation regarding lipid-linked contrast agents: for a bilayer membrane, surface molecules may be presented at either the interior or exterior surface. Therefore, not all chelating lipids were available at the outer surface for radiolabeling, and this is hypothesized to be the reason that for the same mol % loading of Gd–DTPA–lipid or GdAcAc, the relaxivity for the GdAcAc liposomes was significantly higher (3 vs 5 mM−1 s−1for GdDTPA vs GdAcAc 20 mol %, 1.5 T). Of course, in this case, the liposomes were synthesized with the DTPA–lipid first and then labeled with gadolinium chloride; thus only roughly half of the available 20 mol % of DTPA–lipid was accessible for labeling. One would presume that starting with Gd–DTPA–lipid to form the liposomes initially would result in similar relaxivity values because the gadolinium content would be the same; indeed, it would be anticipated that the Gd–DTPA–lipid would have higher relaxivity in this case, because the GdAcAc should experience some reduced hydration and exchange rates in the hydrophobic environment of the membrane. Alternatively there may be no difference in relaxivity because it has been observed that gadolinium probes sequestered in subcellular compartments have reduced relaxivities, which was attributed to reduced water exchange across the membrane.53 Indeed, it is somewhat surprising that the membrane-embedded probes are still active, given their localization, as early work by Huber et al. had observed that hydrophobic Gd derivatives, which localize to fat deposits in vivo, produce no observable MRI signal, probably due to poor water exchange.54 The fluidity of the membrane must be such that sufficient water exchange occurs to produce signal. Labeling after liposome formation was an advantage for radiolabeling, which could be accomplished quickly without extensive synthesis and was completed with 85–95% efficiency. But for Gd loading, preinserting the gadolinium prior to liposome formation should improve yields.
Figure 5.
Three types of liposome designs containing GdAcAc and DTPA for chelating 99mTc and 166Ho. In types C and D, some fraction of the chelators face internally and are unavailable for metalation. Reproduced with permission from ref 50. Copyright 2006 Mary Ann Liebert, Inc.
Gopalakrishnan et al. also loaded probe into liposome membranes using hydrophobic quantum dots.51 In this work, TOPO (trioctylphosphine oxide)-coated QDs were added to lipids in chloroform and dried, and vesicles were formed by hydration and bath sonification. Two types of vesicular probes were formed that were intended for either (1) internalization, containing 25% DOTAP and 75% DMPC, or (2) fusion to cell membrane and release of contents, containing 25% DOTAP, 0.5% DPPE–PEG2000, and 74.5% DMPC. Technically, these were not multimodal probes, but the interior of the vesicles was loaded with Fluo-3, a calcium sensor dye, to lend multifunctionality, and the design is such that other modality functions could easily be added via Gd–lipid or loading the aqueous interior as we have seen before. Loading to cells demonstrated that the probes meant for internalization labeled the cytoplasm of the cells with punctate spots, while the membrane fusion vesicles labeled only the perimeter of the cells (Figure 6). Fluo-3 carried by the membrane fusion vehicles was successfully transferred to the cytoplasm, as determined by detection of a Fluo-3 emission peak in the cells after labeling.
Figure 6.
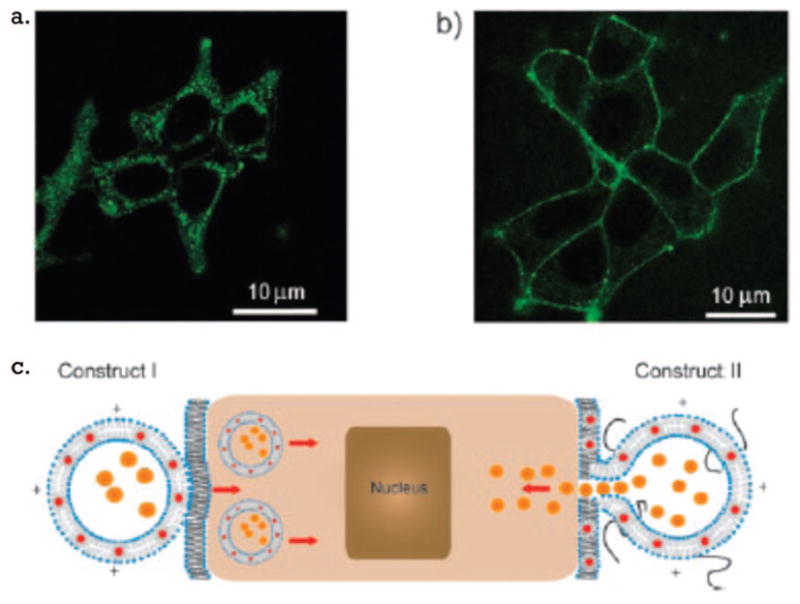
Labeling of cells with (a) probes intended for internalization and (b) probes for fusion to the cell membrane and (c) schematic representation of the probes’ interactions with cells. Reproduced with permission from ref 51. Copyright 2006 Wiley-VCH Verlag GmbH & Co. KGaA.
2.1.3. Combination Liposomes: Lipid-Linked and Encapsulation
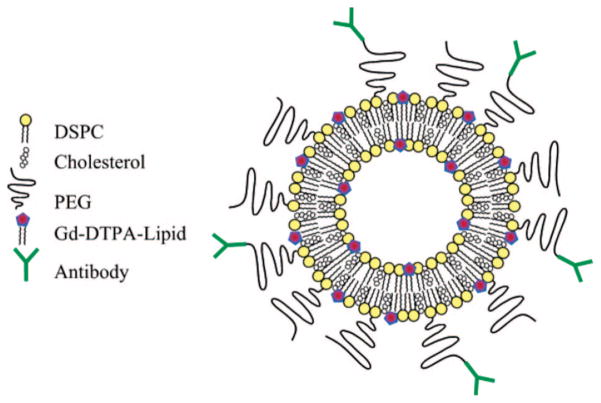
We have seen that probes can be incorporated to liposomes by encapsulation to the aqueous core or by attachment to lipid membrane. As a short note, we will point out that there are many examples in the literature that combine these two concepts, putting one or more probes in the core and other probes in the membrane. In this manner, probes with different solubilities can be combined in the same probe. In work from Lanza, Wickline, and colleagues, Gd–DTPA lipids have been incorporated in perfluorocarbon-containing liposomes, for example,55,56 and in perfluorocarbon-containing liposomes that were additionally modified with 99mTc-chelates (bispyridyl-lysine-caproyl-phosphatidylathanolamine).57 The latter formulation, 270 nm diameter, was targeted to αvβ3 integrin and used in an animal tumor model to demonstrate combined SPECT–CT imaging using the probes, with SPECT for sensitive detection of probes, CT used for soft tissue contrast, and MRI to assess extent of vascularization (the probe is a blood pool agent). Other work from Nicolay, Mulder, and colleagues illustrates an interesting twist, E-selectin-targeted Gd–DTPA–BSA and DOPE–rhodamine liposomes formulated with calcein in the aqueous compartment (Figure 7).46 Calcein is used as a fluorescent marker of membrane permeability and was used to assess the stability of the liposomes by monitoring the leakage of calcein from the aqueous core. One can envision, although they were not used for this purpose, applications for these liposomes as carriers to deliver a diagnostic, such as calcein, to cells or tissues where release of the contents of the liposome report on some aspect of the cellular environment. We will see some examples of this later in the section on Imaging and Therapy.
Figure 7.
Gadolinium labeled liposome. Gadolinium labeled lipids reside on inner and outer leaflets. DSPC = 1,2-distearoyl-sn-glycero-3-phosphocholine. Reproduced with permission from ref 46. Copyright 2004 American Chemical Society.
2.2. Lipoproteins as Carriers
In addition to the use of synthetic lipids to form liposomal carriers, multimodal probes have been constructed by loading multiple types of probes to a naturally occurring lipoprotein vehicle. Both low-density lipoprotein (LDL)20 and high-density lipoproteins (HDL)58 have been used in this manner. For LDL, ~22 nm diameter, surface loading was used to couple near-infrared dyes and Gd chelates; core loading was used to incorporate near-infrared dyes and photodynamic therapy agents; and protein loading was used to couple targeting moieties to redirect away from LDL receptors. These are summarized in the referenced work.20 Curiously, the authors note that efforts by other laboratories to load iron oxide particles into LDL have not been successful. The reason for the failure is not described, but perhaps there is a size limit to the payload that can be carried by these small lipoproteins.
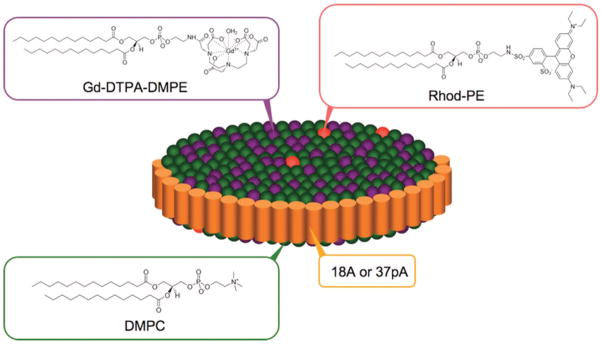
Rather than modify an existing lipoprotein, Cormode et al. have fashioned HDL-like particles by building particles using the same components as the native HDL but with the hydrophobic core replaced by gold, iron oxide, or quantum dot nanoparticles that were capped with hydrophobic ligands.58 The HDL-like particles were additionally modified with Gd–DTPA–DMPE and rhodamine–DMPE (DMPE = dimyristoyl phosphatidyl ethanolamine) (Figure 8). These formulations were visible by CT/T1-weighted MRI/fluorescence (AuHDL), T2-weighted MRI/fluorescence (FeO-HDL), and T1-weighted MRI/fluorescence (QD-HDL). HDL is primarily known for playing a role in plaque regression.59 But there have been reports that oxidized HDL can contribute to plaque formation and is recognized by the scavenger receptors that bind modified LDLs.60 The more prominent role for native HDL is in the removal of excess cholesterol, which is mediated by binding to high-affinity receptors found in many peripheral tissues. HDL receptors have been isolated from a number of cell types including cultured human and mouse fibroblasts, human arterial smooth muscle cells, and bovine aortic endothelial cells.61 In this work, these unique “Frankenstein”-like HDLs were applied to endothelial cells in culture and also to apoE mouse models of atherosclerosis to demonstrate contrast enhancement by both MR and fluorescence imaging.
Figure 8.
High-density lipoprotein-like particle carrying MRI and optical probes. Reproduced with permission from ref 58. Copyright 2008 American Chemical Society.
3. Nanoparticle Designs
One of the most active areas of multimodality probe research has been in nanomaterials, which have proven to lend themselves well to the “blending” required to generate multimodal functionality. The size and multicomponent nature of many nanomaterials offer a forgiving platform to combine probe materials for various imaging modalities. Compared with complex multistep organic synthesis methods required for typical multimodal small molecule probes (see later section in this review), some nanoparticle syntheses are rapid and relatively facile and allow a modular approach where changing components of the nanoparticle can be as simple as swapping out a reagent, without requiring redesign of the entire synthetic protocol. Nanoparticles for multimodal imaging can be generated de novo or can be built around existing nanoparticles that already possess one functionality; for example, modifications of iron oxides and quantum dots are a straightforward and common design, with a number of methods for introducing the additional imaging functions. Typical approaches work within the spherical particle environment and either attach to or build upon a core nanomaterial in a fashion that either is isolated from or interacts with the core; these generally segregate functionalities to different domains of the nanomaterial. Alternatively, new nanomaterials have been developed that contain multifunctional components in the same matrix either by embedding separate functionalities in a common, inert binding material or by growing the functional atoms into a common nanocrystal. This section is organized into four major subheadings that deal with the designs found currently in the literature.
3.1. Quantum Dots
Since the first applications of quantum dots (QD) to biological systems,62–66 these versatile nanoparticles have been hotly pursued as a potentially superior alternative to organic fluorophores. As such, they have also been the topic of many efforts to develop probes that are detectable by both optical imaging and other modalities such as PET or MRI. The major methods to produce multifunctional quantum dots are echoed in work on other types of nanoparticles, and we roughly categorize these as conjugates, where other molecules are attached to the QD through surface chemistry; core/shell, where other molecules are incorporated into the QD by including them in an additional layer coating the QD core; and doping, where additional functionality is achieved by incorporating appropriate molecules or atoms into the core matrix of the QD.
3.1.1. Conjugates
Methods to optimize QDs for biological use have been extensively investigated, and this has produced reports on strategies to couple QDs to other molecules for targeting cells and biomarkers of interest (Table 2). The most straightforward modification of quantum dots employs bifunctional chemical cross-linkers to conjugate two dissimilar molecules to each other, methods that are routinely used to fluorescently label proteins. These methods rely on the presence of functional groups on each of the two molecules that are to be joined, such as amine, thiol, or carboxyl groups, that are subsequently linked using reactive cross-linkers with specificity toward the given functional groups.67 Cross-linkers can be homo- or heterobifunctional and exist in a variety of spacer lengths, reactive rates, and solubilities that are nicely summarized in a free handbook from Pierce Protein Research Products (Thermo Fisher Scientific, Rockford, IL).68
Table 2.
| probes | modalities | size (nm) | imaging properties | refs |
|---|---|---|---|---|
| Quantum Dot Conjugates | ||||
| 64Cu-DOTA to CdTe/ZnS (QD705) | PET/optical | ND | imaging only, microPET R4 (Siemens); IVIS200 (Xenogen) | 69, 72 |
| 64Cu-DOTA to CdSe/ZnS (QD525, QD800) | PET/optical | ND | imaging only, microPET R4 (Siemens); microCT explore RS-9 (GE) | 70 |
| Gd-DOTA to CdSe/ZnS/silica | MRI/optical | 8–15 | r1 = 43 mM−1 s−1, r2 = 55 mM−1 s−1(0.47 T); r1 = 23 mM−1 s−1, r2 =54 mM−1 s−1 (1 T); r1 = 18 mM−1 s−1, r2 =67 mM−1 s−1 (9.4 T); optical ND | 73 |
| Gd-DOTA to CdSeTe/CdS/glutathione | MRI/optical | 7–10 | r1 = 77 Gd/particle, 365 mM−1 s−1 particle, r2 = 6779 mM−1 s−1 particle (11.7 T); λem ≈ 795 nm (λex = 695) | 71 |
| Gd-TSPETE to CdS:Mn/ZnS/SiO2 | MRI/optical | 20 | 107 Gd/particle, r1 = 20.5 mM−1 s−1, r2 = 151 mM−1 s−1(4.7 T); λem = 590 nm (λex = 345) | 74 |
| Gd-DTPA through biotin/avidin to CdSe/ZnS (QD525, QD585) | MRI/optical | 6.7 | r1 = 3000–4500 mM−1 s−1 particle (calcd), r2 = 5600–8400 mM−1 s−1 particle (1.5 T); λem = 525 or 585 nm (λex = 800) | 77, 78 |
| ferritin to CdSe/ZnS (QD525, 655, 800) | MRI/optical | 5–20 | SQUID, ferrimagnetic hysteresis at 2 K; λem = 525, 655, 800 (λex = 340) | 76 |
| Lipid-Coated/Micellar Quantum Dot ferrofluid and CdSe/ZnS emulsion | MRI/optical | few micrometers | magnetic sorting; λem = 540 (λex = 340) | 81 |
| iron oxide and CdSe/ZnS micelle | MRI/optical | 60–70 | r2 = 104.9–244.9 (mM Fe)−1 s−1; λem = 750 (λex = 450), λem = 720 (λex = 680) | 82 |
| 25 | SQUID superparamag 12 K; λem = 605 nm (λex = 350) | 83 | ||
| resolve–al–Gd and CdSe/ZnS micelle | MRI/optical | 18 | T1 imaging only; λem ≈ 570 nm, λex ≈ 550 nm | 85 |
| Gd–lipid in coating and CdSe/ZnS/silica | MRI/optical | 31 | 2500 Gd/particle, r1 = 36 000 mM−1 s−1 particle (calcd); λem = 630 nm, QY = 25% | 87 |
| 15 | r1 = 12 mM−1 s−1, 2000 mM−1 s−1 particle (calcd); λem ≈ 560, abs ≈ 540 | 88, 89, 324 | ||
| <10 | imaging only | 91 | ||
| 34.3 | r1 = 14.4 mM−1 s−1, 46 000 (calcd) (9.4 T); λem ≈ 623, abs ≈ 626 | 90 | ||
| 18F–PEG–lipid and CdSe/CdZnS | PET/optical | 20–25 | imaging only, Focus 220 PET (Siemens), fiber confocal CellVizio488 (Mauna Kea) | 92 |
| Doped Quantum Dots | ||||
| transition metal doping | spintronics | theory | 94 | |
| manganese doping | spintronics | theory | 93, 109, 110, 329, 330 | |
| rods 12–100 | λem = 400/500/585 nm (λex = 335 nm) | 331 | ||
| 2.8–4 | λem = 420/590 nm (λex = 300 nm); ICP for Mn | 119 | ||
| 39 | only magnetic characterization | 111 | ||
| InP:Mn | spintronics | 3 | λem = 570 nm (λex = 331/470/560); ferromagnetic ordering <25 K, hysteresis <15 K | 113 |
| MnCdTeSe/CdS | MRI/optical | 4–5/50 coat 15% QYH2O | hysteresis 298 K; λem = 822 nm (λex = 550 nm), QY H2O = 15% | 117 |
| Mn/silicon | MRI/optical | 4.2/16%QYChl | λem = 510 nm (λex = 420) QYchloro = 16%; EPR for Mn | 115 |
| CdS:Mn/ZnS | MRI/optical | 3.1 | λem = 590 nm (ex 345) hysteresis at rt | 118, 251 |
| Co:ZnO | magnetic/optical | 3.7 | EPR, SQUID = paramagnetic, no remanence (rt and 4.5 K); λem = 330/530/680 (λex = 280) | 114 |
| Core/Shell Quantum Dots CdSe/Zn1−xMnxS | MRI/optical | 4.1–4.7/7–21%QYH2O | r1 = 11–18 mM−1 s−1(7 T, rt); λem = 570–650 nm (λex = 550–630), QY H2O = 7 – 21%, QYchloro= 30–60% | 121 |
| Co/CdSe | magnetic/optical | 11–18/2–3%QY | superparamag-ferromag 240 K; λem ≈ 570 nm (λex = 510) QY = 2–3% | 122 |
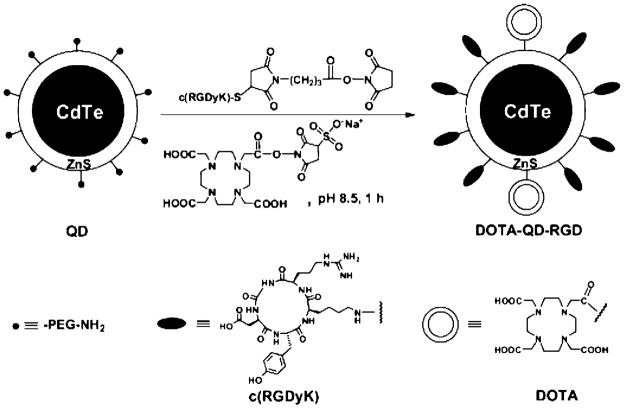
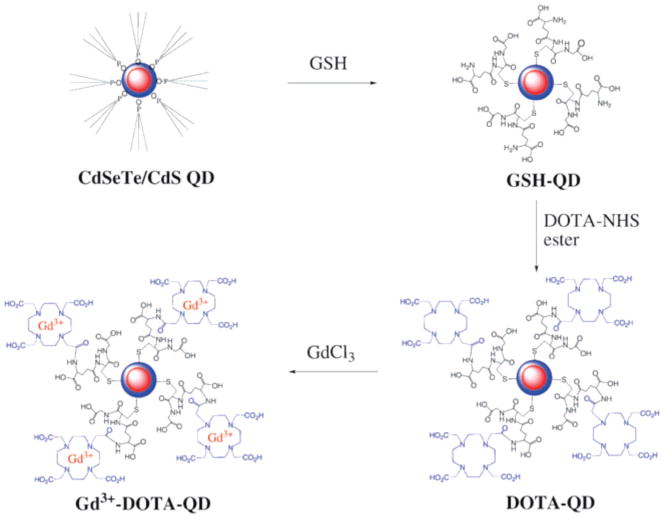
A typical approach is to attach PET- or MRI-active molecules to the surface of aminated QDs using amine-reactive probes. Amine-reactive derivatives of chelators such as DOTA and DTPA are attached to QDs, and these subsequently are metalated with MRI- or PET-active ions. A traditional coupling chemistry, using succinimidyl ester derivatives, that has been widely used to attach Gd(III) or 64Cu either directly to amine groups on the QD surface or to amine groups on QD coating molecules is illustrated in Figures 9 and 10. DOTA and DTPA are commercially available as N-hydroxysuccinimide esters (NHS) (Macrocyclics). With this chemistry, DOTA was attached to CdTe/ZnS QDs,69 CdSe/ZnS,70 and glutathione-coupled CdSeTe/CdS QDs.71
Figure 9.
Chelator coupling to surface of CdTe nanoparticles. Reproduced with permission from ref 69. Copyright 2007 Society of Nuclear Medicine.
Figure 10.
Chelator coupling to CdSeTe/CdS quantum dots. Reproduced with permission from ref 71. Copyright 2008 Royal Society of Chemistry.
In work by Chen, the QDs were also conjugated to vascular endothelial growth factor (VEGF), which proceeded by another typical conjugation method using an amine/thiol reactive heterobifunctional cross-linker, NHS–maleimide and thiolated VEGF.72 After purification by size exclusion chromatography or dialysis, PET/optical probes were generated by inserting 64Cu to the attached DOTA by simple incubation in 0.1 N sodium acetate buffer (pH 6.5), 40 °C, 45 min.69,72 The radiolabeled probe was collected as a peak from purification on a PD-10 column with phosphate-buffered saline as the mobile phase and applied to cultured cells and a mouse tumor model to characterize imaging properties for PET and optical imaging. Proportions are not specifically given in this work, but it is noted by the authors that PET imaging required far less 64Cu-labeled QD than near-infrared (NIRF) whole body optical imaging: 22 pmol of the probe was used for animal imaging by PET, while 200 pmol was used for NIRF. In these studies, dual modality was not performed with the same injection of probe, illustrating the challenge of merging modalities with vastly different sensitivities. Arguably, a primary benefit for multimodal probes is the ability to give a single injection of probe and then use either or both modalities to image the subject. In order for this to work for PET/NIRF, the mole ratio of 64Cu to QD would need to be 1:10 or less; therefore the nanoparticles would exist as a mixture of DOTA-modifed QD and 64Cu-DOTA-modified QD. This would be of concern for any “PET + other” probe; only a small fraction of the probes need to be radiolabeled (and thus multimodal) due to the high sensitivity of PET compared with most other clinical imaging methods. It is presumed that the radiolabels add such a small change to the molecular weight or to the charge of the unlabeled probe that it will not alter the original transport thereof. The loss of homogeneity would be preferable to “overloading” the QD with positron emitters because there is a risk to expose clearance organs to excessive amounts of radioactivity, particularly the liver and spleen, which are the primary locations for QD clearance.70
For MRI/optical probes, the challenge is turned around, to incorporate enough paramagnetic ion for detection by the relatively low sensitivity of MRI. Fortunately, QDs present a fairly large number of free amines over the entire surface so that large numbers of gadolinium chelates can be attached before steric hindrance becomes an issue. In recent work, QDs were first surface coated with glutathione, as an alternative to mercaptoacetic acid coating, and Gd–DOTA was coupled via NHS chemistry.71 The labeled QDs were reported to have r1 relaxivity of 365 mM−1 s−1; this is likely per mole of QD, not Gd. Actual Gd loading results were not measured but estimated based on DOTA loading (from absorbance measurements). In other work by Gerion et al., 10 nm QDs were first coated with a 1–2 nm thick PEGylated silica shell presenting thiol groups, to which amine-reactive Gd–DOTA molecules were cross-linked using sulfosuccin-imidyl-4-(N-maleimidomethyl)cyclohexane-1-carboxylate(sulfo-SMCC).73 Relaxivities for the Gd–DOTA-modified QDs were r1 = 808 (mM QD) −1 s−1, and r2 = 3004 (mM QD) −1 s−1 (9.4 T, rt). The relaxivities were measured at two other field strengths to yield r1 = 1019 (mM QD) −1 s−1 (1.5 T, rt) and r1 = 1932 (mM QD) −1 s−1 (0.5 T, rt) and r2 = 2348 (mM QD) −1 s−1 (1.5 T, rt) and r2 = 2484 (mM QD) −1 s−1 (0.5 T, rt). Similar studies were performed to attach Gd–DOTA to Au core nanoparticles. About 45–300 gadolinium ions were bound per particle. While these particles were reported to have relaxivities on the order of that for generation n = 5 dendrimers or iron oxides with 20–40 nm cores, they were unable to provide significant contrast in animal models. A small amount of signal above background could be detected in the bladder (TRAMP mouse, i.v. delivery of 100 μL of nanoparticles with 200–300Gd–DOTA/QD, 50 μM Gd); the authors estimated that gadolinium loading would need to be increased 10-fold for meaningful in vivo applications.
Chelates other than DOTA and DTPA have been used to couple gadolinium to QDs.74 N-(Trimethoxysilylpropyl)ethyldiamine, triacetic acid trisodium salt (TSPETE), was attached to silica-coated CdS:Mn/ZnS QDs. A yield of 107 gadolinium ions per quantum dot is reported. TSPETE, however, has only five coordination sites for gadolinium compared with the eight or nine for DOTA and DTPA; thus it would be expected to be much less stable in vivo. The r1 relaxivity for the modified QDs was measured to be 20.5 mM−1 s−1 at 4.7 T, and r2 = 151 mM−1 s−1. The authors fail to note that Mn is also paramagnetic and may contribute to the relaxation properties for the material. In the constructed QD, the CdS/Mn (1.8 mol % Mn) core resides under a shell of ZnS (CdS:Mn/ZnS ≈ 3 nm diameter) and also a silica coat of thickness ~4–7 nm, which will shield from water access to the Mn, but outer sphere effects can still play a role. Mn–DPDP, for example, is a clinical manganese-based MRI contrast agent with q = 0, and its relaxivity arises from outer sphere effects.75 We will see later that Mn-doped QDs have been pursued as multimodal agents as well.
Iron oxides have also been conjugated to quantum dots; more examples of this will be seen in the next section on iron oxides, because the most common approach has been to couple QDs to a core of iron oxide. One attempt at the reverse, to couple a QD core to iron oxide nanoparticles, aimed to place 25 iron oxide nanoparticles on the surface of a QD using EDC to couple lysines on the iron oxide surface to carboxyls on the QD surface.76 The product was primarily dimers rather than iron oxide coated QDs, which was perhaps fortunate, because a coating of iron oxide would be anticipated to interfere with absorbance and emission from the QD. Commericial QDs were used in this synthesis and were a heterogeneous mix of diameters of 5, 10, and 20 nm with emissions of 525, 655, and 800 nm, respectively. Ferritin was 5 nm mean diameter. MRI was not performed here so multimodal imaging was not demonstrated, but magnetization measurements (SQUID) verified typical ferritin behavior.
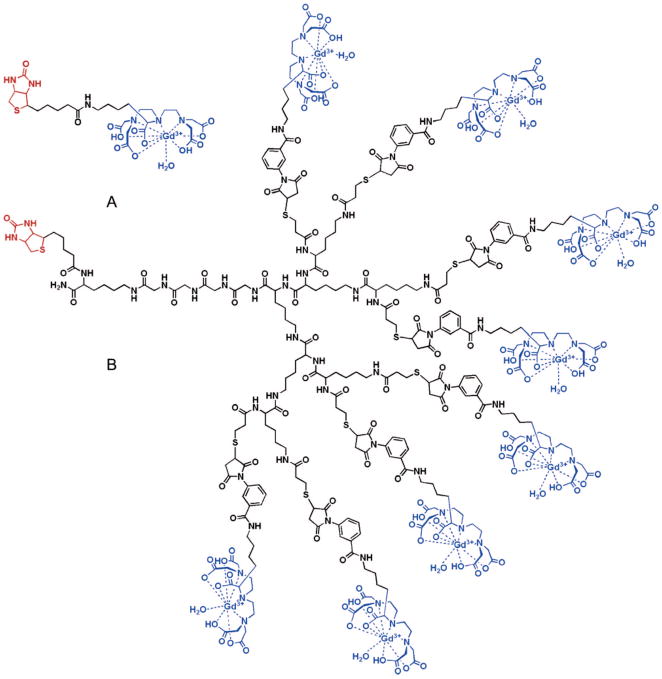
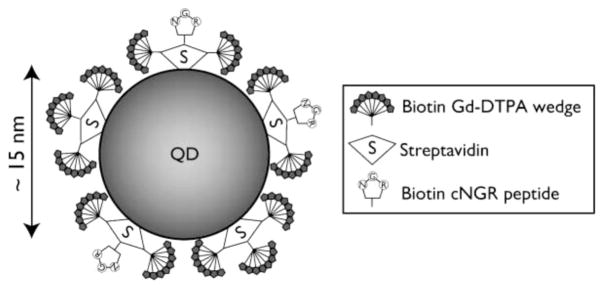
Another mechanism that has been exploited for coupling paramagnetic ions to the surface of QD is biotin–streptavidin binding. This is also a common molecular coupling technique. Molecule 1 is conjugated to biotin; molecule 2 is conjugated to avidin or streptavidin and the natural binding interaction between biotin–avidin is used to couple the molecules. The multiple biotin binding sites on avidin are also a natural mechanism to amplify loading. In work by Prinzen et al., QDs are conjugated to streptavidin (10 streptavidin per QD), and Gd–DTPA was conjugated to biotin (Figure 11).77 Two QD complexes were constructed using these biotinylated Gd–DTPA by either (1) coupling them directly to streptavidin modified QDs, while also coupling biotinylated annexin 5, or (2) first conjugating eight biotinylated Gd–DTPA molecules in a “wedge” formation on a backbone of lysine, which is then coupled to the QD (Figure 12).78 This is an interesting approach, similar to dendrimers, to increase the Gd loading capacity on the QD surface. Annexin 5 is a protein that binds acidic phospholipids in a calcium-dependent manner. The final application for these constructs was to characterize cell-surface exposure of phosphatidylserine, a phospholipid typically located on the inner leaflet of plasma membranes that migrates to the outer leaflet in dying cells. The modified QDs were found to be ~7 nm in diameter, considerably smaller than other NIRF/MRI probes noted in the paper. Strangely, the relaxivities of the modified QDs are not measured directly but instead calculated based on the relaxivities for the biotinylated Gd–DTPA complexes and the predicted loading levels. The r1 for the biotinylated Gd–DTPA wedge coupled to avidin was 15.6 mM−1 s−1 per Gd–DTPA (field strength unconfirmed, see later comments) compared with 17.5 mM−1 s−1 per Gd–DTPA (1.5 T, 20 °C) for biotinylated Gd–DTPA coupled to avidin. From this, the authors calculate per nanoparticle r1 values of 420–630 mM−1 s−1 for nonwedge and 3000–4500 mM−1 s−1 for wedge configurations. Unfortunately, the cited reference for the r1 value for the wedge uses an 11.7 T instrument, but the r1 value is not reported in that reference, so it is difficult to corroborate the data.79 In addition, the source cited for the r1 value for avidin-bound biotinylated Gd–DTPA did not directly measure the r1 for the bound complex but calculated it based on mathematical modeling using the r1 for free biotinylated Gd–DTPA (r1 = 6.1 mM−1 s−1 per Gd–DTPA, 1.5 T, 20 °C).80 The probes were applied and able to produce contrast for confocal imaging and MRI of cultured cells, blood clots, and excised injured carotid arteries. The Prinzen et al. article includes a table comparing the physicial properties of these annexin-conjugated nanoparticles compared with other annexin-coupled MRI/optical probes in the literature at that time (2007), and it is noted that the “wedge” configuration produced nanoparticles of the smallest size and highest relaxivity for the surface area. Related work from Oostendorp et al. reported r1 = 7.1 mM−1 s−1 (7 T, 20 °C) for similar wedge constructs.
Figure 11.
Biotin–avidin dendritic approach to coupling Gd–DTPA to nanoparticles: Shown are biotinylated GdDTPA (A), which is incorporated to a dendritic “wedge” (B) that is coupled to an avidin-modified nanoparticle. Reproduced with permission from ref 77. Copyright 2007 American Chemical Society.
Figure 12.
Schematic illustration of dendritic wedges decorating a nanoparticle surface. Reproduced with permission from ref 78. Copyright 2008 American Association for Cancer Research.
The table cited in the preceding paragraph highlights an issue with the vast literature in the nanoparticle field for reporting multimodality imaging agents that are aimed for MRI: there is not yet a convention for whether to report relaxivities against nanoparticle concentration or paramagnetic ion concentration. Arguably, paramagnetic ion concentration is the more important value for ultimate clinical use, because this will determine tolerance and toxicity limits for the breakdown products, particularly for gadolinium. Moreover, nanoparticle mole concentrations can be quite difficult to measure, because they are too small for standard particle counting methods such as flow cytometry, so they are typically calculated from theory based on particle size and the amount of starting material used or on elemental analysis for final atom concentrations (such as Cd for CdSe QD); this introduces error to the relaxivity measurement because actual particle concentration may not match theoretical ideal levels.
3.1.2. Lipid-Coated/Micellar
As a homologue to the liposomal encapsulation system described earlier, one can encapsulate two or more types of contrast agents in a micelle, much like liposomal encapsulation but without the aqueous compartment. A few groups have reported encapsulation of QD and iron oxides in micelles or emulsions.81–83 Micellar encapsulation, as illustrated in Figure 13, proceeds by an evaporative process, as described for liposomes. Park et al. reports generation of 60–70 nm diameter micelles derived from PEGylated phospholipid 11 nm oleic acid coated iron oxides and 10–12 nm trioctylphosphine-coated (TOP) QD.82 A range of iron oxide/QD ratios were prepared yielding r2 from 103.9 to 244.9 (mM Fe) −1 s−1; quantum yield was not reported. Roullier et al. report synthesis of 25 nm particles formed from PEGylated gallate amphiphiles, TOPO-QD and TOPO-iron oxides.83 The QD and iron oxides are coencapsulated in the micelles, which are surface modified with biotin for subsequent targeting studies (Figure 14). Relaxivities were not reported but magnetization was examined by SQUID and found to be consistent with monodisperse, noninteracting nanocrystals. Quantum yield is reported as 15%, a decrease from the 41% QY for free QD in chloroform or 27% for QD micelles. Quenching is commonly observed for QDs in aqueous solution, after surface modification or encapsulation for water solubility, and most dramatically after ligand exchange to render the QD hydrophilic, which significantly alters the physical environment of the surface atoms. Micellar coating generally introduces less quenching of quantum efficiency because there is no direct interaction between the lipids and the QD surface atoms.84 Finally Bakalova et al. developed a silica-shelled micellar QD configuration in which the core QD was first encapsulated in a detergent micelle to transfer the TOPO-capped QD (for example, other capping agents are also described) to water, and then silica-stabilized micelles were formed using n-octyltriethoxysilane (OTS); triethoxyvinylsilane (TEVS) is then polymerized over the first silica precursor to grow a silica shell, and the QD micelles are terminated with amine using [3-(2-aminoethylamino)-propyl]trimethoxysilane (other examples given). MRI functionality was introduced by embedding the hydrophobic commercial agent Resolve Al–Gd to the micelle layer.85,86 Details for how Resolve Al–Gd was introduced are missing from the references.
Figure 13.
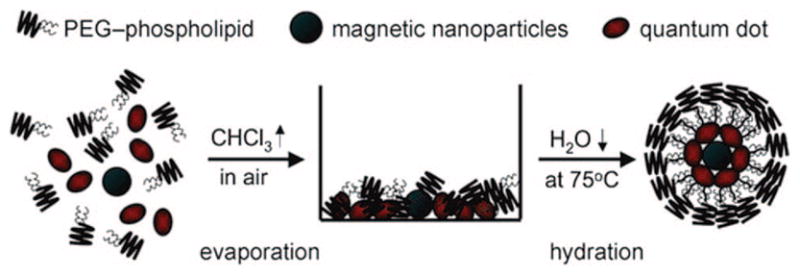
Coencapsulating of iron oxides and quantum dots in micelles. Reproduced with permission from ref 82. Copyright 2008 Wiley-VCH Verlag GmbH & Co. KGaA.
Figure 14.
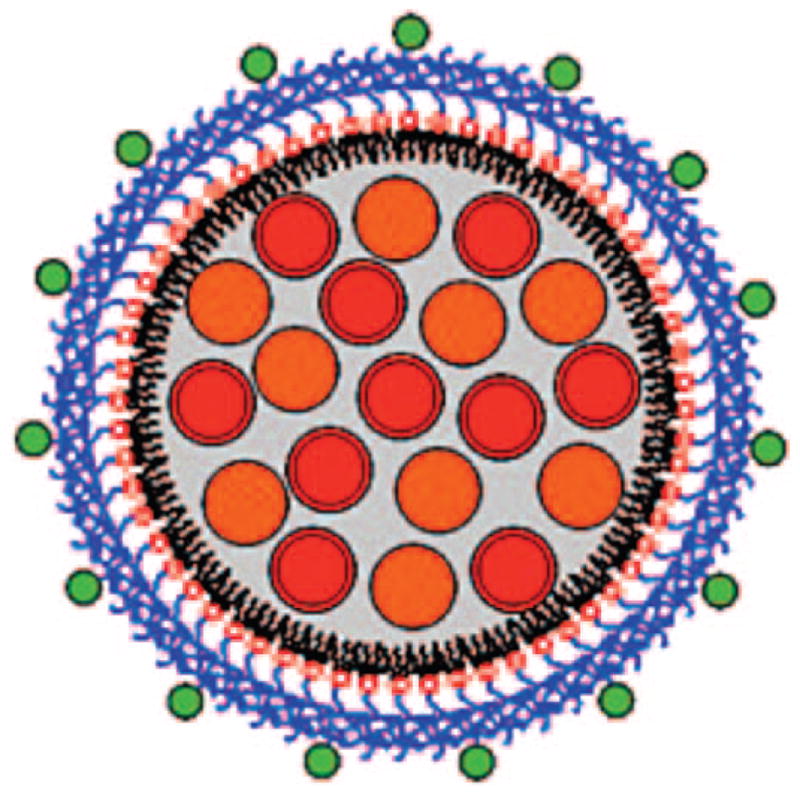
Coencapsulation of quantum dots (red) and iron oxides (orange) in micelles containing biotin (green)-modified amphiphiles. Reproduced with permission from ref 83. Copyright 2008 American Chemical Society.
In a kind of hybrid between the lipid-linked strategies described earlier, paramagnetic ions can be introduced to quantum dots by coating the QD with a lipid shell, that is, encasing it in a micelle. In this approach, Gd chelates bound to lipids are inserted into the lipid coating to provide MRI functionality. A large body of work in this area comes from Mulder and colleagues.87–91 A variety of constructs targeted for different biological applications have been generated by this group for use by collaborators with the typical configuration as shown in Figure 15, and preparation proceeds by evaporation of the mixture of QDs and modified lipids as shown in Figure 16. The lipids self-assemble about the hydrophobic QD core, a physisorption phenomenon rather than covalent coupling. The particles have similar properties to liposomes, obviously, because these are effectively liposomes without aqueous cores but can be synthesized in size ranges not much larger than the QD, <10 nm.90 The size and use of stealth coatings (e.g., PEG) both serve to increase serum half-life for the probes. For further information we direct the reader to a number of reviews on nanoparticulate assemblies of amphiphiles for multimodal imaging.8,17,23
Figure 15.
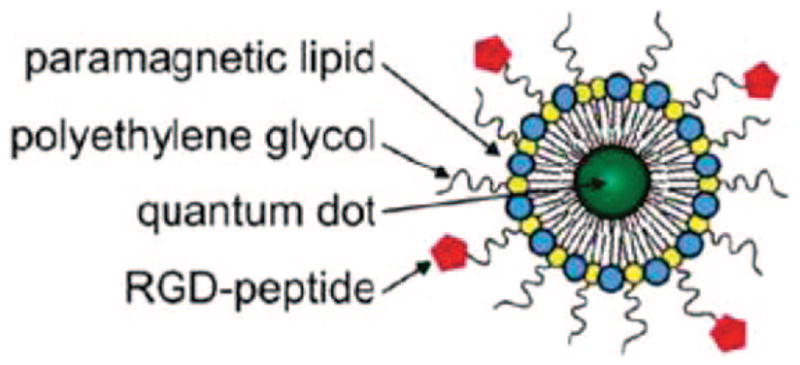
Quantum dots with fluorescently labeled lipid shells. Reproduced with permission from ref 23. Copyright 2009 American Chemical Society.
Figure 16.
Synthesis of lipid-coated quantum dots. Reproduced with permission from ref 326. Copyright 2006 American Chemical Society.
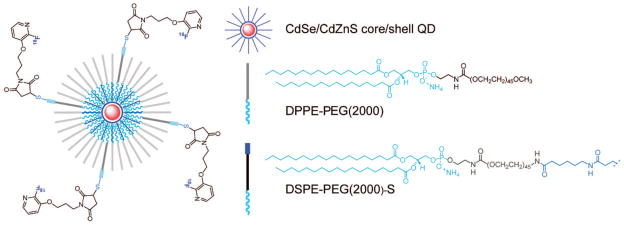
Radioactive fluorine has also been attached to micellar QDs.92 Duconge describes synthesis of 18F coupled to lipids on CdSe/CdZnS core/shell QDs. Micelle encapsulation was achieved by heating the chloroform-dissolved components (QD, 1,2-dipalmitoyl-sn-glycero-3-phosphoethanolamine-N-[methoxy(poly(ethylene glycol))-2000] (DPPE-PEG2000), and DSPE-PEG2000-NH2) in water until the chloroform evaporated. Product was purified by ultracentrifugation in 30% sucrose solution, followed by ultrafiltration to remove sucrose, yielding 20–25 nm diameter particles. Surface amines were converted to thiols using sulfosuccinimidyl 6-(3′-[2-pyridyldithio]-propionamido)hexanoate (sulfo-lc-SPDP), a commericially available heterobifunctional cross-linker (Pierce). Then 18F-labeling was accomplished using [18F]FPyME (1-[3-(2-fluoropyridin-3-yloxy)propyl]pyrrole-2,5-dione, a maleimido 18F derivative that couples the 18F through thiols (Figure 17). Details for the full 145 min synthesis are provided in the paper. The QDs were employed for in vivo confocal using a fiberscope and PET after i.v. injection to athymic nude mice. Accumulation was primarily in heart, lungs, kidney, liver, and spleen. The 18F does not appear to be required for any biochemistry in vivo; therefore it would seem desirable to use longer lived radionuclides in the future. However, 18F is readily available to many locations compared with other more exotic isotopes, and this may be a motivation for the choice.
Figure 17.
18F-labeled lipid-coated quantum dot. Reproduced with permission from ref 92. Copyright 2008 American Chemical Society.
3.1.3. Doped
While doping into bulk semiconductors is routine, doping into nanocrystals has been much more challenging, due to the very small size of these materials, but extensively studied. Doping of quantum dots with transition metals, and characterization of the resultant physical properties, has been widely studied mainly for information storage applications as a method to control the nanoparticles’ physical properties.93–108 For example, in spin-related, nanoscale applications, manganese has been doped into II–VI quantum dots such as ZnSe,109 ZnS,110 CdSe,111,112 and more rarely into III–V systems such as InP.113 And ZnO QD have been doped with a number of transition metals, and rare earths including Ti, Cr, Mn, Fe, Co, Ni, Ru, Pd, and Ag.104,106–108,114 Only recently have doped quantum dot materials been investigated for multimodal imaging applications. This existing body of literature on transition metal doping of quantum dots sparked our interest to dope paramagnetic ions to quantum dots for dual-mode MRI/optical agents.
In 2007 collaborative work with Dr. Susan Kauzlarich, we studied doping of manganese into silicon nanoparticles for MRI/optical imaging.115 Note that these are elemental silicon particles, not silica. Silicon is attractive as a nanoparticle imaging agent due its low biological toxicity. Si has an LD50 of 3160 mg/kg compared with 88 mg/kg for Cd2+ (chloride) and 450 mg/kg for iron (ferric chloride). These LD50 values are for oral ingestion in the rat model and illustrate the significantly lower toxicity of Si. Studies on porous Si films have shown that the primary decomposition product is orthosilicic acid (Si(OH)4), which is a component for normal bone and connective tissue homeostasis. The additional Si(OH)4 does not adversely affect homeostasis.116 Furthermore, silicon’s ability to covalently bond with carbon makes Si QDs especially attractive for coupling to biological materials. In our work the manganese was doped into Zintl salt precursors at 5% from which hydrogen capped nanoparticles were formed by reaction with hydrogen bromide as shown in Figure 18. The resulting particles were 4.2 ± 0.9 nm in diameter and contained a Si/Mn molar ratio of 18.2:1, which correlates with 5% doping. Manganese incorporation was confirmed by XRD and EPR. Emission maximum was 510 nm for 420 nm excitation, which represented a red shift from the undoped Si nanoparticles, which have an emission maximum of 430 nm, and the doped particles had a quantum yield of 16% in chloroform. For the 5% doping level, there was <2% quenching of luminescence from the undoped material, but quenching increased as doping levels increased. The red shift was fortuituous, can be a feature with some dopants, and can be used to advantage to move the emission of the Si QDs to longer wavelengths more conducive to biological applications. In an interesting recent theoretical study of transition metal doping into silicon nanoparticles, it was found that the magnetic moments of most 3d and 4d transition metal atoms (Sc, Ti, Fe, Co, and Ni; Y, Zr, Ru, Rh, and Pd) are completely quenched in the silicon host.102 For other 3d transition metal atoms (V, Cr, Mn, Nb, Mo, and Tc), the moments are significantly reduced. Mn–Si bonds are noted to be most similar in length to Si–Si bonds, implying that these should dope most easily into the nanocrystals without distorting the lattice. These studies used spin-polarized density functional theory (DFT) in a DMOL package. Thus we chose a transition metal predicted to be most effective for our application.
Figure 18.
Synthesis of hydrogen-capped silicon nanoparticles doped with manganese.
In 2009, Yong reported manganese doping of CdTeSe/CdS nanoparticles that emit in the near IR.117 These were prepared in a one-pot synthesis by injection of Se/Te (75: 25) in TOP to a hot mixture (290 °C) of cadmium oxide and manganese acetylacetonate in TOPO and myristic acid. A solution of oleylamine–sulfur was then added at reduced temperature. Particles were isolated by addition of ethanol and centrifugation, and the reaction yielded 4–5 nm particles. These hydrophobic nanoparticles were then coated with lysine for water solubility using previous methods; the lysine coated nanoparticles were ~50 nm diameter by DLS. Relaxivities were not measured, but magnetic properties of the quantum dots were analyzed by vibrating sample magnetometer to show hysteresis curves consistent with paramagnetic material. NIR emitting QDs would be distinctly advantageous for biological application for reasons discussed earlier. For cellular studies, the nanoparticles were conjugated to antibodies targeting biomarkers of pancreatic cancer (mesothelin, a lipid-anchored membrane glycoprotein; claudin, a constituent of tight junctions; prostate stem cell antigen (PSCA), a lipid-anchored membrane glycoprotein) to demonstrate uptake by two pancreatic cancer cell lines (panc-1 and MiaPaCa). However, all of the labeled cells seemed to present blotchy patterns of fluorescence with many extra-cellular patches that seem more consistent with aggregates that have fallen out of solution and were then taken up by cells than with normal cell surface labeling by disperse nanoparticles. Some of the claudin labeling seems representative of tight junctions, but in the images shown, there were few actual cell–cell contacts (sparse culture) and the labeling was not found at every cell–cell contact and was also found extracellularly.
Santra et al. reported Mn-doped CdS coated with ZnS shells.118 Water-in-oil emulsion methods were used to generate the 3.1 nm particles that emitted yellow light under 366 nm hand-held UV and were radio-opaque under a fluoroscope. Magnetization measurements of the probes produced curves with hysteresis indicating that the probes are paramagnetic, but no MRI was performed. The QDs were attached to TAT peptide, a cell-penetrating sequence, and delivered through the carotid artery to rats; then the brain was isolated for histology. Fluorescence microscopy was used to visualize contrast in isolated cerebral and carotid arteries downstream of the injection site. No labeling was observed in the opposite hemisphere from the injected carotid.
While the examples here illustrate that paramagnetic ions can be doped into QD, doping directly into the nanocrystal poses some challenges, most damaging is that for many dopants the introduction of impurities to the nanocrystals tends to quench luminescence efficiency in a concentration-dependent manner.119 Thus improving MR contrast properties will simultaneously degrade optical imaging effectiveness. These drawbacks of doping led researchers to examine other methods to incorporate paramagnetic ions in a manner that does not impact luminescence efficiency, such as doping the paramagnetic ion into an outer coating instead of the luminescent core.
3.1.4. Core/Shell
Most quantum dots prepared for biological applications are of a core/shell configuration, in which the central inorganic core is overgrown with a shell of a different material.120 The shell serves to shield the nanoparticle from environmental sources for degradation, while also improving surface passivation to increase luminescence efficiency. For example, cadmium-based QDs (CdSe, CdS, etc.) are often coated with ZnS, with the idea of preventing release of toxic cadmium ions if the core is degraded.84 The concept of shell coatings lends itself well to generation of multimodal probes, because each added layer can possess another functionality, and a number of designs have been reported in the literature; these range from non-surface-interacting, amorphous coatings like the micellar structures discussed above to shells that are crystallized around the core through epitaxial growth.
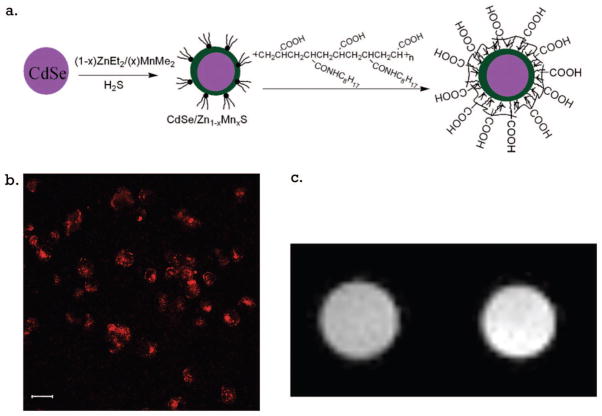
In other work from our lab in collaboration with Dr. Susan Kauzlarich, CdSe quantum dots were coated with a ZnS shell doped with manganese for MRI contrast.121 The manganese was doped into the shell to avoid issues with luminescence quenching described above. CdSe nanoparticles were synthesized in a heated solution of TOPO and hexadecylamine from cadmium acetate and Se under Ar. Then one to five layers of Zn1−xMnxS shell were grown on the CdSe cores as shown in Figure 19a. A range from 1% to 20% doping stoichiometries of Mn were attempted. The QDs were capped with amphiphilic octylamine-modifieid poly(acrylic acid), self-assembled in chloroform, and purified by dialysis. By this method, 4.7 nm core/shell nanoparticles were derived with relaxivities from 10 to 13.1 mM−1 s−1, 7 T, rt. The efficiency of manganese incorporation decreased with increasing initial Mn concentrations. For example, efforts to dope 1% Mn into the shell yielded 0.6% final incoporation, while efforts to dope 20% yielded at best 6.2%. In fact, thicker shells incorporated a lower ratio of Mn/Zn than the thinner shells. The thinner shell, close to the QD surface is believed to experience more distorted structure due to lattice mismatch with the CdSe core; this higher entropy system accepts deposition of impurities more readily than a more ordered structure. The QDs were applied to cells for confocal and MR imaging and were able to produce contrast in both types of images (Figure 19b). Due to concerns about cadmium quantum dot toxicity, however, we then turned our attention to the work on doped silicon nanoparticles previously described.
Figure 19.
(a) Synthesis of CdSe quantum dots with manganese-doped ZnS shells. (b) Confocal image of cells incubated with Mn containing QDs. (c) MRI images of cells incubated with (right) and without (left) quantum dots. Reproduced with permission from ref 121. Copyright 2007 American Chemical Society.
Although they were not developed for imaging applications Co/CdSe core/shell nanoparticles were synthesized and demonstrated luminescence and paramagnetism.122 CdSe was deposited as a shell on nanocrystals of Co. The Co cores were formed by thermolysis of CO2(CO)8 precursors in the presence of organic surfactants. To form the shell, dimethylcadmium and Se in TOP, TOPO, and HDA were slowly introduced to the Co cores under nitrogen and heating at 140 °C. Low-temperature reaction was found to be necessary to produce CdSe shells rather than separate growth of CdSe nanoparticles unassociated with the Co cores. The low-temperature reaction produced a mixture of coated and uncoated Co, and the uncoated nanoparticles were removed by size selection precipitation and magnetic separation. The purified Co/CdSe particles were 11 nm with peak emission at ~560 nm for excitation ~510 nm, this large Stokes shift is not observed in pure CdSe quantum dots. Quantum yields were low, however, only 2–3%. Magnetization measurements found a transition from paramagnetism to ferromagnetism at 240 K. Other examples of core/shell magnetic/luminescent nanoparticles will be presented in the section on iron oxides.
While designs utilizing QDs can provide luminescence and paramagnetism as the above examples demonstrate, except for the silicon constructs, most of the nanoparticles contain potentially toxic cadmium cores.123
It has long been believed that proper coating of the QD protects from degradation and toxicity. But in studies on cytotoxicity, it has been reported that QDs taken up by cells are toxic no matter what surface coating is possessed.84,124,125 Several studies indicate that QDs produce reactive oxygen species that can contribute to toxicity.126,127 While these nanomaterials are a powerful research tool, work remains before they can be accepted for clinical work.
3.2. Iron Oxides
Iron oxide nanoparticle (IO) derivatives are clinically available, relatively benign contrast agents for MRI. The low toxicity of iron and good sensitivity for the agent make them desirable agents, particularly after the recent controversy regarding toxicity of gadolinium-based agents observed in certain subsets of patients with pre-existing kidney disease.128–136 In patients with acute or chronic severe or end-stage renal insufficiency, certain conditions of administration for widely accepted gadolinium contrast agents has led to a condition known as nephrogenic systemic fibrosis (NSF) due to release of free gadolinium in the body. Although this has only been observed in these already seriously diseased patients and in only a subset of protocols, the media attention to the incidents has increased interest in less toxic contrast agents or contrast-free imaging methods. Iron oxides break down in the body to free iron, which joins the natural pool of iron in the body. As nanoparticulate agents, iron oxides have been modified for multimodal imaging by many of the methodologies described for quantum dots above (Table 3).
Table 3.
| probes | modalities | size (nm) | imaging properties | refs |
|---|---|---|---|---|
| Iron Oxide Nanoparticle Conjugates | ||||
| rhodamine B | MRI/optical | 13.3 | attract to magnet; λem = 532 (λex = 350), λem =572 (λex = 850), QY 0.13 | 137 |
| 108 | superparamag, no hysteresis (300 K), measured ΔB of cells; λem = 577 (λ ex = 555) | 138 | ||
| AlexaFluor | MRI/optical | 80 | mag separation; Microscopy, FACS, 150 AlexaFluor/iron particle | 140 |
| 64.8 | MRI cells; microscopy, FACS | 139 | ||
| dansyl | MRI/optical | 39 | r1 = 41.2 mM−1 s−1, r2 = 110.6 mM−1 s−1 (3 T); λem = 355 (λex = 530) | 141 |
| indolequinone | magnetic/optical | 9.5 | magnetic ND, used as quencher; λem = 515 (λex = 495) | 143 |
| diarylethene | MRI/switchable optical | 7 | superparamag (300 K); λem = 460/490 (λex = 312, 410) | 144 |
| oligothiophene | magnetic/optical | 17.9–26.9 | attract to magnet; λem ≈ 510, 620 (λex = 365) | 142 |
| Cy5.5, no target | MRI/optical | 31 | r1 =23 mM−1 s−1, r2 = 59 mM−1 s−1 (0.47 T); imaging 633ex, 670LP, 695BP, cell and rat glioma imaging, | 145, 147, 148 |
| Cy5.5, target VCAM-1 | MRI/optical | 31 | VCAM-2 targeting, microscopy, FACS, MRI | 149 |
| Cy5.5 and annexin V | MRI/optical | 31 | annexin V conjugates, cell FACS, cell pellet MRI (4.7 T), 9.4 T imaging, coronary occlusion mice, microscopy | 151, 150 |
| Cy5.5, target uMUC-1 | MRI/optical | 35.8 | EPPT peptide conjugate, r1 = 26.43 mM−1 s−1, r2 = 53.44 mM−1 s−1 (0.47 T); imaging 633ex, 700LP | 152 |
| Cy5.5. and RGD | MRI/optical | 36 | r2 = 118 mM−1 s−1; RGD conjugates, 8.4 Cy5.5/particle | 153 |
| Cy5.5 and siRNA | MRI/optical/therapy | a | cell imaging | 154 |
| enzyme-activated Cy5.5 | MRI/optical | 62–68 | r1 = 27.8–29.9 mM−1 s−1, r2 = 91.2–92.5 mM−1 s−1, 1.2 –1.8 Cy5.5/particle | 155 |
| Cy5.5, target uPAR | MRI/optical | 10–15 | imaging pancreatic cancer mouse model, 3 T MRI, Kodak in vivo optical imaging (λex = 625, λem = 700) | 156 |
| Cy5.5 and chlorotoxin | MRI/optical | 10 | MRI cells (4.7 T), microscopy | 157 |
| 64Cu-DOTA | MRI/PET | 45 | superparamag, no coercivity; MRI 3 T, PET | 160 |
| 32 | r1 = 14.46 mM−1 s−1, r2 = 72.55 mM−1 s−1 (1.5 T, 37 ° C); up to 22% radiolabel yield | 18 | ||
| 64Cu-DTPA | MRI/PET | 20 | r1= 29 mM−1 s−1, r2 = 60 mM−1 s−1 (0.47 T, 39 °C); MRI 7 T, PET–CT | 161 |
| 111I-DOTA | MRI/therapy | 20, 30, 100 | Cell studies, whole body autorad, pharmacokinetics | 162 |
| 124I-CLIO | MRI/PET | 32 | MRI solution and animal 1.5 T, PET R4 rodent (Concorde Microsys) | 163 |
| 18F-PEG3 and Vivotag | PET/CT | 30 | PET–CT phantom and mouse | 164 |
| Core/Shell Iron Oxide Nanoparticles | ||||
| FITC, silica shell | MRI/optical | 150 | imaging only, cells, eye vein inject mice, 4.7 T MRI, microscopy | 174 |
| 50 | imaging only, cells, labeled hMSC to mouse, 1.5 T MRI, microscopy | 185 | ||
| rhodamine, silica shell | magnetic/optical | 13.7 | paramagnetic (ZFC), λem= 552 (λex = 500) | 175 |
| 100–150 | superparamag, no remanence rt, λem = 560 (λex = 520) | 178 | ||
| 1.3–34 | superparamag, no remanence rt, microscopy (rhodamine) | 177 | ||
| 30–80 | hysteresis (temp not given), microscopy cells (RITC, FITC) | 179 | ||
| a | imaging only, ex vivo 14.1 T MRI, microscopy | 176 | ||
| terbium complexes, silica shell | MRI/optical | 52 | superparamag, no remanence, λem = 544 (λex = 265) | 180 |
| Rubpy, silica shell | MRI/optical | 20 | superparamag, no remanence rt, r2 = 30.4 mM−1 s−1, (FePt core) r2 = 26.1 mM−1 s−1, (Fe2 O3 core) λem ≈ 610, abs = 458, 522, 782 | 181 |
| pyrene, silica shell | magnetic/optical | 330 | superparamag, no hysteresis rt; λem = 375, 385, 394 (λex = 388) | 182 |
| quantum dot, silica shell | magnetic/optical | 170–200 | superparamag, no remanence rt; λem = 537 (QD), Au abs = 518 | 183 |
| DiI, DiR, PAA shell | MRI/optical | 88–100 | r2 = 202–208 mM−1 s−1 (0.47 T, 37 °C); λem = 595, abs = 555 | 187 |
| pyrene, MPTMS shell | magnetic/optical | 547 | superparamag, no remanence; λem = 375, 385, 394 (λex = 338) | 182 |
| quantum dot, PAA shell | MRI/optical/therapy | 250 | no remanence rt, attract to magnet; λem = 593 (pH 7.4) (582, pH 2) | 188 |
| CdSe shell | MRI/optical | >4 | superparamag (not shown), blue, green, and orange | 190 |
| 12–15 | paramag, no remanence 298 K; λem = 550, QY 18–20% | 189 | ||
| CdSe/ZnS shell | magnetic separation/optical | 30 | attract to magnet; λem = 550 | 159 |
| 25 | moderate magnetization (2.28 emu/g); λem = 565, abs = 530 | 186 | ||
| Eu:GdO3 shell | magnetic/optical | 400 | linear (magnetization vs mag field); λem = 615 (λex = 260) | 191 |
| LaF3:CeTb shell | magnetic/optical | 30 | attract to magnet; λem = 319/490/543/584/619 (λex = 270), abs = 543 | 192 |
| Y:Er:NaF4 shell | magnetic/optical | 68 | superparamag, zero coercivity;; λem = 539/658 (λex = 980) | 194 |
| Y2O3:Eu shell | magnetic/optical | 100 | superparamag, zero coercivity rt, 4.3 emu/g; λem = 610 (λex = 260) | 193 |
| gold shell | MRI/optical/therapy | 18/250 | r1 = 6.87 mM−1 s−1, r2 = 28.15 mM−1 s−1(7 T, 25 ° C) | 196 |
| imaging only 4.7 T; abs ≈ 540, 700 nm for therapy | 197 | |||
| graphite shell, on FeCo core | MRI/optical | 30 | superparamag rt, r1 = 70 mM−1 s−1, r2 = 644 mM−1 s−1 (7 nm core), r1 = 31 mM−1 s−1, r2 = 185 mM−1 s−1 (1.5 T); abs UV, 808 nm for therapy | 198 |
| Texas Red–DPPE, Bodipy FL C5–HPC, rhoda-DPPE, lipid shell | MRI/optical | 21 | iron content only; microscopy | 199 |
| Doped Iron Oxide Nanoparticles | ||||
| terbium doped | MRI/optical | 13 | superparamagnetic, zero coercivity rt; λem = 490/545/587/612 (λex = 235) | 200 |
Not determined.
3.2.1. Conjugates
As for any type of nanoparticle with functional groups on the surface, iron oxide nanoparticles can be made multimodal by covalent conjugation to additional probes. The iron oxide conjugates are primarily applied for MR/optical imaging or for magnetic separation plus optical imaging. Using many of the chemical cross-linking methods described above for QDs, iron oxides have been modified for MR/optical imaging by coupling to fluorophores such as rhodamine,137,138 AlexaFluor,139,140 dansyl,141 oligothiophene,142 indole-quinone,143 diarylethene,144 and Cy5.5.145 By far, the largest body of work in the literature is for CLIO–Cy5.5 conjugates (CLIO = cross-linked iron oxide) from the groups of Josephson and Weissleder. Cy5.5 has desirable long wavelength emission for biological applications (675ex/694em). The probes can be used in untargeted applications much like their single modality counterparts, dextran-coated iron oxides (superparamagnetic iron oxide (SPIO), ultrasmall superparamagnetic iron oxide (USPIO)).146–148 But since their development they have been extensively investigated for targeted applications by also conjugating moieties with the ability to bind biological targets. Since the development of CLIO–Cy5.5 by Josephson, the probes have been derivatized by this group and collaborators for biological applications. CLIO–Cy5.5 has been conjugated to peptides targeted to VCAM-1 to target endothelium,149 to annexin V to target apoptotic cells,150,151 to peptides targeted to underglycosylated mucin-1 antigen (uMUC-1), a transmembrane protein that is overexpressed in some cancers,152 to RGD peptides to target integrins,153 and to siRNA for gene suppression therapy.154 These conjugations have typically been performed by conjugating aminated dextran-coated nanoparticles with commercially available succinimidyl ester derivatized Cy5.5 (Cy5.5 NHS ester). In general, the synthetic methods are not provided or well referenced in most of these cited works but are described in detail in a protocol paper by Pittet.145
An interesting alternative construct by Josephson are protease-sensing probes generated by coupling Cy5.5-labeled peptides to CLIO through disulfide or thioether linkages.155 For disulfide linkage, aminated CLIO was prepared as for the above works then activated with SPDP to introduce thiol groups for coupling to the peptides. For thioether linkage, the aminated CLIO was reacted with succinimidyl iodoacetate. Cy5.5 labeling was at the amine terminal of the peptides, while CLIO termination was at the carboxyl terminal. Fluorescence from Cy5.5 was noted to be quenched, and this quenching was relieved after exposure to DTT to reduce the disulfide bonds or to trypsin for cleavage of the thioether bonds for the two types of probes. There are less than two probes per nanoparticle, so it is hypothesized that the quenching is due to interaction between CLIO and Cy5.5, although there is little spectral overlap between the two. The profound quenching observed in these conjugates is in contrast to what is observed for other Cy5.5 conjugates. Figure 20 provides a look at the linkers used in this case, and for typical Cy5.5, the numbers of bonds separating the Cy5.5 from the CLIO do not appear to explain the lack of quenching for the NHS esters.
Figure 20.
Synthesis of Cy5.5-labeled CLIO-bearing targeting peptides. Reproduced with permission from ref 155. Copyright 2002 American Chemical Society.
Other groups have conjugated iron oxide nanoparticles to Cy5.5 by first coating the iron oxides with a layer of amphiphilic polymers156 or PEG.157 For the former, the dye was first conjugated to the aminoterminal fragment peptide from urokinase plasminogen activator (uPAR), whose receptor is overexpressed in pancreatic cancer, using a maleimide derivative of Cy5.5 and GE Healthcare’s recommended synthesis.156 The peptide was then conjugated through amino side groups to the carboxyl groups of the amphiphilic polymers using ethyl-3-dimethyl amino propyl carbodiimide (EDAC). The conjugation of the PEG-coated particles is illustrated in Figure 21 and proceeded by coating the iron oxide nanoparticles with PEG silane,158 which is then coverted to amineterminated PEG for coupling to Cy5.5 NHS ester. This probe was also conjugated to chlorotoxin, a peptide that binds to matrix metalloproteinase-2, which is overexpressed in some tumors of neuroectodermal origin, such as gliomas.
Figure 21.
Synthesis of PEG-coated CLIO conjugated to Cy5.5 and chlorotoxin: (1) PEG silane coupling to nanoparticles (NPs) and conversion to amine termination; (2) Cy5.5 maleimide derivative reacts with amine terminated NPs; (3) chlorotoxin conjugation to NPs. Reproduced with permission from ref 157. Copyright 2005 American Chemical Society.
IO can also be coupled directly to QDs, and this approach was used to generate IO cores decorated at the surface by QDs.159 CdSe/ZnS QD and polymer-coated IOs were synthesized separately then conjugated using thiol chemistry. CdSe cores were formed from CdO and lauric acid in the presence of TOP and HDA and then coated with ZnS using diethyl zinc and hexamethyldisilathiane in TOP. Polymer-coated IOs were purchased from Indicia Biotech (France). The two nanoparticle types were then coupled at QD/Fe 100:1 in chloroform/methanol/water (10:5:1) to dissolve both the chloroform-soluble TOPO-capped QDs and the water-soluble IOs. The high ratio of QDs was noted to be required to prevent aggregation of the IOs. These probes were designed for magnetic separation and optical imaging, but the 10 nm core IO produced should also have capability for MRI.
In addition to adding optical functionality, iron oxides can also be modified for PET or SPECT, and nanoparticles have been radiolabeld with 64Cu,18,160,161 111In,162 124I,163 and 18F.164 In work from our lab, 64Cu was coupled to dextran and dextran sulfate coated iron oxides through DOTA groups (polystyrene nanoparticles were also radiolabeled in this work).18 DOTA and DTPA are convenient chelators for multimodal work in that they both have extensive chemistry reported in the probe literature for chelation of gadolinium; thus the modification to insert copper ions for PET is a logical extension. Dextran sulfate was used to target macrophage scavenger receptors, a cell surface marker unique to macrophages, a cellular marker for atherosclerotic plaques prone to rupture. Macrophages are found at high densities in vulnerable plaques with density scaling with probability of rupture.165–168 Macrophage distribution also is indicative of stability, and high density in the plaque shoulders correlates with increased risk of rupture.169 Radiolabeling of the nanoparticles was much more challenging for the dextran sulfate coated than the dextran-coated nanoparticles and the synthesis required modification for these particles. Optimal radiolabeling efficiency was achieved by (1) amination of benzyl-DOTA derivatives (Figure 22), which were (2) coupled to aldehydeterminated nanoparticles, and (3) pre-insertion of copper ions to the chelators prior to coupling. The product was purified by size exclusion chromatography using Sephadex G25. The abundant negative charge at the particle surface could have been interacting with the copper ions to interfere with chelation. We found dextran-coated particles to be more easily radiolabeled.
Figure 22.
Amination of benzyl-DOTA derivatives. Reproduced with permission from ref 18. Copyright 2008 American Chemical Society.
Two other methods for 64Cu labeling of iron oxides, through DOTA coupled to poly(aspartic acid)-coated iron oxides160 and through DTPA coupled to dextran-coated iron oxides,161 reported successful introduction of copper ions after coupling the chelators to the nanoparticles. In the latter case, the particles were not purified (other than washing and centrifugation) after labeling with the copper ions. The 64Cu–DTPA–IO probes were used for nonspecific imaging in atherosclerotic ApoE mice using PET/CT. MRI was not performed, so the probes were not used in a multimodal capacity in this work, but because they contain IO, they may be suitable for PET/MRI. Dextran-coated iron oxides are known to label macrophages through nonspecific uptake mechanisms.161 In the work by Lee, the particles were purified by PD-10 size exclusion chromatography prior to use. The 64Cu–DOTA–IO probes were coupled to RGD peptides and used for tumor imaging by PET and T2-weighted MRI.160
DOTA can also be utilized to carry other ions, and this approach was used to label IO with 111In.162 In this work, the antibody CHL6, which binds a breast cancer biomarker, was radiolabeled by conjugating DOTA–Bz–SCN to the antibody, then labeling with 111In chloride. The antibody was then coupled to dextran and PEG-coated IOs through amide bond to carboxyl groups on the surface of the particles using EDC/NHS chemistry. Although no images are shown because the intent for this paper was radioimmunotherapy and alternating magnetic field therapy, these probes should also be appropriate for MR/SPECT imaging.
Some radioisotopes may also be coupled directly to coatings on IOs. For example, IO coated with serum albumin has been labeled with 124I by iodinating the ortho position of tyrosine residues on the albumin using an Iodo-Bead protocol (Pierce Biochemical Co.).163 This resulted in 32 nm diameter nanoparticles. A nice comparative study using phantoms was done to illustrate that the same probe can be used to achieve MR resolution down to 250 μm and PET sensitivity to picogram levels. These probes also were compared with nonradioactive counterparts and to free 124I at the same concentrations of Fe and I to verify that there was no interference between probes in the multimodal design. The authors do not note significant differences, but MR images seem to reflect a slight decrease in negative MR contrast for the multimodal probe over the probes that lack radiolabel (Figure 23). 124I has spin 2, nuclear spin 1/2, 71 neutrons, and magnetic moment of 1.44, so it may be contributing to the MR image.170 The probes were applied to image lymph nodes in a rat tumor model after injection of the probes to the right forepaw. Both MR and PET images show contrast in the axillary and brachial lymph nodes on the injected side. After tissue injections such as these, the introduced agents drain into the lymphatic system where they accumulate in lymph nodes by phagocytic activity of resident macrophages. Dextran-coated USPIO are known to accumulate to lymph nodes after intravenous injection through what may be an antibody-mediated immune reaction in the rat.171 The serum albumin coat described here may have a similar immunogenic effect; the type of albumin is not referenced, but typical commercial sources are bovine.
Figure 23.
124I-labeled Mn-doped iron oxide (MnMEI): (a) MnMEI; (b) DLS size; (c) stability of the particles at different salt concentrations and pH; (d) radiolabeling of the particles; (e) MRI (left) and PET (right) images of solutions of free radiotracer, multimodal probe, and MR only probe. Reproduced with permission from ref 163. Copyright 2008 Wiley-VCH Verlag GmbH & Co. KGaA.
CLIOs have also been radiolabeled with 18F by conjugating 18F labeled PEG3 to azide-terminated CLIOs using click chemistry.164 The synthesis for the nanoparticles is similar to other work from the Weissleder group where CLIO is aminated then reacted with an NHS dye derivative (VT680); the remaining amines are then terminated with azide by reaction with NHS ester of 1-azido-13-oxo-3,6,9-trioxa-12azaheptadecan-17-oic acid. Click chemistry was through copper-catalyzed cycloaddition. The product was isolated by filtration and washing. Click chemistry has been widely utilized since it was first introduced because it offers the ability for quick coupling between molecular species, the most popular through azide–alkyne cycloadditions.172 This is particularly critical for the relatively short-lived 18F species. By click chemistry, coupling of 18F-PEG3 to CLIO took place in approximately the same amount of time as the 18F labeling of the polymer (40 min each). The particles were characterized and used for PET imaging. MRI was not performed, but properties of the particle were compared with the previous literature on 64Cu-labeled CLIOs, and the 18F derivatives were found to have a detection threshold of 0.025 μg Fe/mL compared with the 64Cu-labeled CLIOs, which required 5 μg Fe/mL. This is not unexpected because 64Cu has lower abundance positron emission (19%) than 18F (97%).173 The authors attribute the improvement to the increased branching ratio for the 18F decay.
The combination of MRI and PET is particularly synergistic because MRI can not only provide anatomical context for the PET images but also allow high-resolution imaging of probe distribution. PET can be used for screening to limit the MRI scans to smaller volumes, greatly reducing the time required to acquire high-resolution MR images. Another beneficial application is for probe validation and development. When an MRI probe that performs well in vitro does not produce contrast in vivo, it can be difficult to diagnose the problem. Is localization to target inefficient? Is localization effective, but paramagnetic ion load per probe too low? PET can verify the localization of probes where concentration is too low to detect by MRI, making it a powerful tool for probe development.
3.2.2. Core/Shell
As for QDs, iron oxide nanoparticles can be enclosed in a shell. The dextran coatings described in the previous section can be considered a type of shell. In addition, many of the approaches described for QD core/shell have been applied to iron oxides. Silica-based designs are popular in the literature both as shell coatings and as nanoparticle matrices. We will discuss the latter application in a later section of this review with greater detail on the syntheses. As a shell, silica possesses a number of attractive features including porosity, enabling larger loading of molecules into this amorphous material compared with a crystalline shell; transparency to allow photons to pass through to the QD core; water solubility; and ready modification for conjugation of surface molecules.9 Various thicknesses of silica shells can be applied in this manner to moderate the amount of dye that is added to the iron oxide base. Silica shells containing FITC,174 rhodamine,175–179 terbium complexes,180 Rubpy,181 pyrene,182 or even quantum dots183 have been coated on iron oxides mostly by using a modified Stober method184 in which the iron oxide cores are preformed, then dye is entrapped as silane compounds and tetraethylortho-silicate (TEOS) in solution are added to polymerize a layer of silica over the iron oxide cores. For example, rhodamine was incorporated on IO by first coating the iron oxide with a thin layer of silica, then adding rhodamine with the silane precursors during formation of a thicker silica network over the core.175,176 The dyes can also be coupled to the silica precursor prior to polymerization.179 Alternatively, the IO can be formed in situ in the silica matrix,175 or the system can be formed in a reverse micelle process.174,181,185 An example of silica-coated IO is shown in Figure 24. These were synthesized by the reverse micelle process and show a 10 nm core, overall diameter of 50 nm, and a thin ring (5 nm) containing the dye (FITC). The dye was introduced slightly later in the polymerization process and was attached to precursor (N-1-(3-trimethoxysilylpropyl)-N′-fluoresceylthiourea).185 Placement of the dye further from the IO was intended to reduce possible quenching.
Figure 24.
Silica-coated iron oxide nanoparticles. Reproduced with permission from ref 185. Copyright 2007 American Chemical Society.
Dyes can also be added after shell coating by coupling them to the shell surface, as described for conjugation earlier, or otherwise associating them on the shell surface. The incorporation of quantum dot to IO has been achieved by synthesizing silica-coated iron oxides and then depositing QDs on the surface, so the QDs are not incorporated into the silica shell so much as they form another layer on top.183 The silica-coated iron oxides were coated with a polyelectrolyte layer; then the QDs assembled on the surface through electrostatic interaction between the negatively charged QD and the positively charged polyelectrolyte layer (poly(diallyldimethylammonium chloride( and poly(sodium 4-styre-nesulfonate)). The particles were finished with a final silica coat to anchor the QD in place. The authors noted a blue shift in emission after silica coating that they attributed to surface degradation of the QD. The capping layer of the QD (thiol) is removed during silica coating, exposing the QD to corrosion as the silica shell is formed. After the shell is in place, the particles were noted to be chemically and colloidally stable. These are water-based particles but imaging properties were not examined. A somewhat similar method was used to coat CdSe/ZnS QDs as an outer layer on silica-coated IO cores.186 In this case, the silica-coated IOs were terminated with SH, and the QDs associated by thiol coordination. Although the resulting nanoparticles were reported to be water-soluble, they were also subject to aggregation and existed as a mixture of monodispersed and aggregated particles. Imaging was not performed, but magnetization studies show that the single-domain particles are superparamagnetic, while the aggregates are ferromagnetic. The particles were also coated with 1-N-[O-3-D-galactopyranosyl-(1,4)-D-gluconamide]-2-N-methylamine (LEAD) for possible future applications to target asialoglycoprotein receptors on hepatocytes. Finally, another method involving silica to couple luminescent partners to IOs is illustrated by a work that described inorganic fluorophore incorporation.180 Terbium was introduced to IOs using a DTPA-derivatized silane as precursor, then introducing terbium to the chelates after shell formation.
Polymer coatings have also been used to introduce optical probes to a shell around iron oxide cores. Polyacrylic acid has been polymerized around iron oxide cores with hydrophobic NIR dyes encapsulated in the hydrophobic pockets of the polymer coating.187 Pyrene has been introduced in polymer shells around IO by introducing it during the polymerization step from 3-methacryoxypropyltrimethoxysilane precursors.182 And quantum dots have been introduced to polymer shells around IOs by interspersing QD coatings (assembled through electrostatic interactions) with poly(acrylic acid) and chitosan layers.188
Rather than embed luminescent probes into a shell around IO, one can grow a QD shell around the IO core. This approach has been used to add shells of CdSe189,190 and Y2O3: Eu to iron oxide cores and to add Eu:Gd2O3 shells to Co:IO cores.191 CdSe can be grown around IO synthesized in oleic acid and dioctyl ether. Cd and Se are added in TOP to grow different sizes of QDs. In the CdSe shell examples here, neither synthesis produced uniform coating of QDs over the IO shell; rather either heterodimers were formed190 or a mixure of inhomogeneously CdSe-coated IOs was formed.189 The section on Heterostructures (in Other Materials) describes other constructs of this nature.
A truer “shell” has been formed by spray pyrolysis to encapsulate cobalt- and neodymium-doped IO in shells of europium-doped gadiolinium oxide.191 By this method, multiple IO cores are embedded in a droplet of the doped gadolinium that ultimately forms the shell. The core/shell nanoparticles are luminescent and paramagnetic, compared with the ferromagnetic parent Nd:Co:IO. Antibodies were then physisorbed to the nanoparticle surface to demonstrate the ability to use them for magnetic immunoassays. Again, although these were not prepared for multimodal imaging and imaging is not performed in this work, the properties of the material are such that they may be appropriate for multimodal imaging applications.
Iron oxides have been coated with luminescence shells of more inorganic nature including LaF3CeTb, Y2O3:Eu and Y:Er:NaYF4. 192–194 All shells were formed by mixing preformed iron oxides with the inorganic reagents. For LaF3CeTb shells, Fe3O4 particles were capped with cetyltrimethylammonium bromide (CTAB) prior to mixing and heating with the shell reagents.192 The very short wavelength excitation for these particles (270 nm) makes them less interesting for biological applications. For Y2O3: Eu shells, PEG-coated IOs were synthesized by a coprecipitation method;193 then the luminescent shell was added by a homogeneous precipitation method wherein the IOs were dispersed in water with Eu(NO3)3, Y(NO3)3, and 1.8 M urea with sonication and heating. Eu doping was 5 atom % (sic). Resultant particles were isolated by magnetic separation, then converted to metal oxides by calcination. Water solubility was afforded by introducing paraminobenzoic acid (PABA) with the assumption that the carboxyl groups on the PABA would coordinate with Y or Eu. Particles of ~85 nm were formed that were superparamagnetic, but these too require undesirable short wavelength 260 nm excitation for 610 nm emission. In general, the luminescent lanthanides such as Eu and Tb are attractive for their large Stoke’s shift emissions, narrow emission bands, and long lifetimes (allowing filtering from short lifetime autofluorescence) but suffer from requiring UV excitation that limits their interest for biological applications. A potential for lower energy excitations is illustrated by our final example for inorganic shells. For Y:Er:NaYF4 shells, IOs were synthesized without surfactants.194,195 Because the shell coating reaction occurred in water under normal atmospheric conditions, it is likely that some oxidation to -Fe2O3 occurred, and the authors note that previous studies using hrTEM identify two types of iron oxides present in the ferrofluids. Their particles had iron oxide cores from 5 to 15 nm with 20–30 nm thick shells and overall diameter in TEM is quite large; the particles seem to be 100–200 nm diameter overall. It is noted that there are likely to be aggregates of iron oxide in the particles as opposed to single cores. Given the range of core sizes, behavior varied from superparamagnetic to ferromagnetic. Excitation at 980 nm resulted in up-conversion emission at 539 and 658 nm. These luminescence properties are more desirable than the UV absorbance for the other lanthanide coats described, but the particle size and wide size variation make them nonideal for biological applications. Particles of this size will be rapidly cleared by the reticulo-endothelial system. If smaller-size particles could be isolated and thinner coats produced, these particles would be more interesting for biological imaging. The upconversion described here maybe be applicable to other lanthanide-containing shells.
Gold196,197 and graphite198 shells have also been introduced to iron or iron oxide cores. The gold shell adds potential for photoacoustic imaging, reflectance imaging, or photothermal therapy in addition to MRI. Gold also offers a convenient surface for functionalization and is widely utilized for array technologies. In solution-based syntheses, the gold shell has been added by the reverse micelle method to elemental iron cores196 or by an iterative hydroxylamine seeding process to iron oxide cores.197 The gold-coated iron cores demonstrated contrast enhancement by both T2- and T1-weighted imaging. The low r2/r1 ratio (4.1) and T1 contrast indicate that the probes may have some promise for being used as T1 agents.196 However, they were not particularly soluble and larger than desirable (250 nm). Size will need to be reduced and solubility of these probes will need to be improved through introduction of surface ligands in order to consider these for biological applications. The gold-coated iron oxides were targeted to EGFR with antibodies to demonstrate selective thermal destruction of EGFR expressing cells (MDA-MB-468 breast cancer cells) after pulsed 700 nm irradiation. With silica as support, graphite has been coated on iron cobalt cores by chemical vapor deposition.198 The silica support was then removed by HF etching to form 4–7 nm diameter particles. The particles were solubilized by noncovalent adsorption of phopholipid–poly(ethylene glycol) (PL–PEG) yielding 30 nm particles (hydrodynamic diameter). Quite high r2 were observed, 644 mM−1 s−1 at 1.5 T with r2/r1 = 9.2. Similar to the gold-coated particles, these particles exhibited heating effects when irradiated with an 808 nm NIR laser, thus showing therapeutic potential.
Finally IOs can also be coated with a lipid shell containing fluorescent dyes coupled to lipids.199 IO solutions were mixed with vesicle solutions and dialyzed extensively resulting in formation of magnetoliposomes (MLs) that were then incubated with cationic lipid vesicles to incorporate cationic lipids in the coating. The magnetoliposomes were purified by high-gradient magnetophoresis. The MLs were prepared with several different fluorophore–lipids that localized to the inner or outer leaflet of the resulting lipid bilayer shell for later characterization of probe uptake mechanisms. The probes were found to be endocytosed by cells through a clathrin-mediated pathway. Studies showed that the liposomal coating remains associated with the MLs and that the MLs have very stable long-term residence in labeled cells, persisting even after 30 days postincubation, albeit with reduced intensity due to dilution after continuous cell growth. MRI was not performed in this work; rather the fluorescence was incorporated as a tool to monitor whether lipid coating improved particle uptake and stability of IO, with the aim of developing these coated particles for MR agents as an alternative to dextran-coated particles. The combined properties for MRI and fluorescence could allow these particles to be used for multimodal imaging, although that was not the aim here. Many of the described core/shell particles were developed to be magnetically and optically active, but not necessarily for biological applications, so imaging was not always performed nor is stability in water always addressed, but all possessed combined fluorescence and magnetic properties that would make them suitable for MRI/optical applications.
3.2.3. Doped
A rather unique method for producing bifunctional nanocrystals is to dope iron oxide with luminescent ions, sort of an inverted counterpart to paramagnetic ion doped QDs, but there are far fewer reports for doped IOs. A recent work describes terbium doped iron oxide.200 The nanoparticles are formed by mixing FeCl3 · 6H2O with TbCl3 · 6H2O in an aqueous dispersion of oleic acid, hexane, and ethanol in the presence of NaOH. An Fe(Tb)oleate complex was isolated from the organic layer of this mixture, the hexane was removed by heating, and then the complex was dispersed in oleic acid and 1-octadecene with heating under nitrogen. Nanocrystals were precipitated with excess ethanol. These particles were then coated with ZnS by dispersing the nanoparticles into a TOP solution containing hexamethyl disilathiane and diethylzinc. Finally the ZnS-coated Tb-doped IOs were silanized and amine-functionalized as described for silica-coated magnetic QDs to render them water-soluble.190 The resulting particles, ~13 nm, emit at 545 nm with 235 nm excitation and are superparamagnetic. Toxicity studies were also performed for nanoparticles heated to 70 and 121 °C for 24 h prior to application to cells. Cell viability was not adversely affected by the Tb-doped ZnS-coated silanized particles. Imaging was not performed for these particles, but it is speculated that they would be useful for MR/fluorescence imaging based on their properties. A drawback is the requirement for short wavelength excitation, which greatly hampers suitability for biological applications. The 235 nm excitation is damaging to cells, is subject to scattering, and produces autofluorescence. The authors note that longer emission wavelengths would be required for more effective deep tissue imaging applications.
3.3. Other Materials
Quantum dots and iron oxides are prevalent in the literature given their established usage in optical and MR imaging, but many other materials with potential image enhancement properties are being explored and the nanomaterials literature is ripe with reports of other nanocomposites. Many configurations are “one-off” combinations of elements reported as materials researchers explore nanocomposites that may yield desirable properties, and many of the works in this section are materials developed without specific characterization of imaging properties. Thus this section is more a summary of interesting materials that may have imaging relevance, rather than a report of probes with proven imaging capabilities.
3.3.1. Conjugates
One nanomaterial that has been studied as extensively as QDs and IOs is nanogold (Table 4). Gold nanoparticles have a long history in electron microscopy and other nonimaging applications and can be controllably synthesized in a variety of sizes, shapes, and surface compositions. More recently, they have been investigated for functionality in CT, hyper-thermal therapy, and reflectance microscopy. Gold has been coated onto other materials as described above for iron oxides, or additional functionality can be added to gold nanoparticle cores. For example, Gd–DTPA has been conjugated to gold nanoparticles.201 Dithiolated derivatives of DTPA (DTDTPA) were synthesized and mixed with gold salts in the presence of NaBH4 in H2O/MeOH to form the gadolinium chelate coated gold nanoparticles. Gadolinium was introduced after the particles were suspended in aqueous solution. The product was 2.4 nm gold nanoparticles in a shell of 150 DTDTPA molecules; however, it was noted that this level of gadolinium substitution negatively affected colloidal stability and the particles would aggregate after only a day in solution. Reducing the degree of labeling to 50 gadolinium ions per nanoparticle greatly improved stability, and particles were stable in saline for up to a week. Final hydrodynamic diameters were not given. The particles were imaged by synchotron radiation computed tomography (SRCT) and T1-weighted MRI (7 T) and then were injected i.v. to mice and imaged by SRCT and MRI. Kidney and bladder were primary sites of contrast; corresponding ICP-MS studies found a majority of signal in the urine, further supporting kidney filtration as a mode of clearance for these particles. This suggests that the particles are less than the size limit for the glomerular filtration that tends to allow particles smaller than 7 nm to filter through to urine.202 Kidneys were well highlighted in MR images. The rapid clearance through kidney will be a challenge for targeted biological imaging applications, however, and these nanoparticles may require surface modification for increased circulation time.
Table 4.
| probes | modalities | size (nm) | imaging properties | refs |
|---|---|---|---|---|
| Other Materials Conjugates | ||||
| gold nano, GdDTPA | CT/MRI | a | synchotron radiation CT, MRI 7 T, 50 Gd/particle, >150 DTDTPA/particle, 2.4 nm gold cores | 201 |
| gold nano, Cy5.5 | reflectance/fluorescence optical | 40–80 | confocal reflectance imaging | 203 |
| Other Materials Core/Shell | ||||
| FePt core, CdO shell | magnetic/optical | 10 | superparamag, blocking temps 13–14 K (ZFC and FC); λem = 465 (λex = 365), QY 2.3–9.7% | 204 |
| CoPt core, CdSe shell | magnetic/optical | 9–12 | ferromagnetic, coercivity 95 Oe, 4.4 emu g−1; λem = 550–630 (broad abs) | 205 |
| Gd2O3 core, FITC, RITC, or Cy5.5 coupled to SiPEG shell | MRI/optical | 10–20 | r1 = 4.1–8.8 mM−1s−1, r2 = 4.9–28.9 mM−1s−1 (7 T); λem = 545, 610, 695 (λex = 495, 540, 646) | 206 |
| Gd2O3/graphite carbon | MRI/optical/therapy | 138 | r1 = 10.3 mM−1s−1, r2 = 11 mM−1s−1 (3 T); λex = 808 for therapy | 207 |
| Gd2O3 | MRI/therapy | 1000–4000 | r1 = 6.7 mM−1s−1, r2 = 38.5 mM−1s−1 (4.7 T) | 208 |
| Other Materials Doped | ||||
| Gd3+ doped NaYF4 | MRI/optical | 20–30 | r1 = 0.14 mM−1s−1, r2 = 8.7 mM−1s−1 (9.4 T); λem = 520, 538, 550, 649, 653, 667 (λex = 975) | 209 |
| Tb3+-doped Gd2O3 (FITC) | MRI/optical/therapy | 3.6 | λem = 488, 545, 586, 623 (λex = 230), and w/FITC, 520em/308ex | 210 |
| 4.3 | r1 = 7.8–12 mM−1s−1(1.5 T); λem = several, max 544 (λex = 266) | |||
| Eu-doped Gd-bnc | MRI/optical | 100 000 | r1 = 1.5 mM−1s−1, r2 = 122.6 mM−1s−1 (9.4 T); λem = 2 from 580 to 680 red (λex = 250), 3 from 480 to 600 green (λex = 309) | 213 |
| Heterostructures | ||||
| FePt–CdS dimers | magnetic/optical | 5.5–6.5 | hysteresis, coercivity 0.85 Oe; λem = 438 (λex = 365) | 218 |
| FePt–Au dimers | MRI/optical | 16 | superparamag, 52 emu/g (5 T); Plasmon λmax = 530 | 219 |
| Pt–Fe3O4, Ni–Fe3O4, Ag–MnO, Au–MnO | MRI/optical/therapy | 21–42 | Au–MnO r1 = 0.6 mM−1s−1, r2 = 1.8 mM−1s−1; Au–Fe3O4 r1 = 4.6 mM−1s−1, r2 = 204 mM−1s−1(1.5 T); plasmon band 547-563 | 220 |
| Au–Co–Au nanowonton | MRI/optical | 30–90 | r2 = 1 × 10⁷ mM−1s−1 particle (7 T), abs broad flat 400–750 | 327 |
| ferrocene–nanodiamond fluorescein PAA shell | magnetic/optical | a | coercivity ~155 G, 10 emu/g (295 K); λmax = 522 (λex = 475) | 222 |
| Novel Structures | ||||
| silica nanorods, Gd–TSPETE, Rubpy, FITC | MRI/optical | 100 × 300–500 | r1 = 22 mM−1s−1, r2 = 41 mM−1s−1(0.47 T); λem = 520 (λex = 488) | 223 |
| carbon nanotube–iron oxide nanoparticle | MRI/optical | 1 × >300 | 56 emu/g, no remanance; multiple PL peaks 900–1400 nm | 224 |
| zeolite L nanocontainer, Gd–DOTA, Eu–DOTA | MRI/optical | 30–3000 | r1 = 30 mM−1s−1 (0.47 T, 25 °C); λem = several 500–700 (λex = 340) | 225 |
| Cu@cross-linked poly(vinyl alcohol) necklace | magnetic/optical | micrometers by up to millimeters | superparamag, no coercivity (300 K); λem = 513 (λex = 410) | 226 |
Not determined.
Another example of multifunctional gold couples fluorophores to gold particles that are coated with oligonucleotides.203 The gold nanoparticles (~25 nm) were coated with 19-mer oligonucleotides that were functionalized with thiol groups at the 5′ ends and amino groups at the 3′ ends. Targeting molecules (folate, anti-EGFR) were then attached to the nanoparticles either by coupling them to the complementary oligo sequence or by creating NHS derivatives of the molecules for direct conjugation to the free amines. Cy5.5 was coupled to complementary oligonucleotides that were allowed to hybridize to the oligo-modified gold nanoparticles, and the nanoparticles were used to target cells. These probes were examined for fluorescence and reflectance imaging applications; this combination was described as being used to demonstrate the ability to introduce dual-modality capability and that MRI or PET contrast agents could be attached by the same means. The benefit for reflectance and fluorescence in combination was not discussed.
3.3.2. Core/Shell
Nanocomposites can be configured as core/shell to preserve the functionality of the different materials as described earlier for QDs and IOs. Magnetic cores with luminescent shells are a common theme, with placement of the luminescent material at the surface to limit quenching or scattering of luminescence that could occur if the configuration were the other way around. For example, FePt204 and CoPt205 magnetic cores have been coated with luminescent shells. Premade FePt cores were used as seeds for the growth of CdO, CdSe, or CdS shells in a one-pot synthesis.204 The authors investigated effects of various reaction conditions on core/shell formation; one interesting observation was that the order of reactant addition influenced resultant morphology. Adding Cd(acac)2 before S or Se went through an FePt/CdO intermediate that then resulted in core/shell nanoparticles of FePt/CdS or FePt/CdSe after chalcogen addition. Increasing temperature (and using solvent with higher boiling points) yielded heterodimers. Adding S or Se first resulted in “nanosponges”, which were believed to be due to formation of nanowires by the chalcogens that bridged the FePt and resulted in the meshlike network after Cd(acac)2 addition (Figure 25). The shells were of varying crystallinity yielding asymmetric emission peaks, and quantum yields were low (2.3–9.7%) perhaps due to quenching by FePt cores. No MRI measurements were performed, but magnetization measurements indicated that the particles were superparamagnetic. As a preliminary study for water solubility, FePt/CdSe particles were modified with glutathione. Preformed CoPt cores (7.1 nm) have also been coated with CdSe shells (1.8–4.5 nm thick).205 Emission color was tuned by varying reaction time to vary shell thickness, with longer reaction times yielding greater red shifts. These were not coated for water-solubility, so they are not immediately relevant for imaging of biological systems but serve to illustrate that different thickness QD shells can be coated to magnetic cores to lend luminescence function.
Figure 25.
FePt core/QD shell nanoparticles. Effect of reaction conditions on structure of final product. Reproduced with permission from ref 204. Copyright 2007 American Chemical Society.
Gadolinium oxides have received some attention due to their potential for highly sensitive optical detection and also for dual-mode imaging and therapeutic applications (hyper-thermal, neutron capture, etc.). The potential to incorporate large numbers of gadolinium ions make nanoparticles of gadolinium oxide an attractive medium for generating positive contrast agents of high relaxivity for MRI. In recent works, luminescence functionality was added to gadolinium oxide nanoparticles by coating them with a shells containing organic dyes.206 In this work, different sizes of Gd2O3 cores (up to 8.9 nm diameter) were coated with ~2 nm thick polysiloxane shells embedded with fluorescein (FITC), rhodamine B (RBITC), or Cy 5 (NHS ester). The dyes were first reacted with (3-aminopropyl)triethoxysilane (APTES); then the dye-conjugated APTES was added with APTES and TEOS to the nanoparticles to form the polysiloxane shell. The resulting particles were coated by covalent coupling of a pentafluorylphenyl ester derivative of PEG to the particles. The PEG coating was required to prevent aggregation and precipitation of the particles in neutral and alkaline solutions. Interestingly, relaxivities decreased with increasing core size; thus, the 2.2 nm gadolinium oxide cores showed greatest contrast in MR images (7 T, 25 °C) (Figure 26). This was attributed to decreasing surface/volume ratio as the smaller particles present the greatest number of gadolinium ions at the surface for the same concentration. The Cy5 derivatives were used for fluorescence reflectance imaging in the nude mouse and for MRI in the rat, both after i.v. injection. The particles clear primarily through the kidneys and were expelled in the urine. UnPEGylated counterparts prepared as controls accumulated in the liver and lungs.
Figure 26.
Gd2O3 nanoparticles. Effect of size on relaxivity: (a) Gd–DOTA; nanoparticles of diameter (b) 3.8, (c) 3.8, or (d) 4.6 nm. Water blank is shown on the right. Reproduced with permission from ref 206. Copyright 2007 American Chemical Society.
Gadolinium oxides have also been synthesized as hollow shells.207 The gadolinium oxide shells are composed around gelatin templates then carbon-coated. Gelatin templates of 384 nm yielded shells of 183 nm diameter with shell thickness of 19.2 nm. The shells were noncovalently modified with the surfactant poly(styrene-alt-maleic acid) (PSMA) for water solubility. The shells had broad absorbance from 300 to 1100 nm and decreased signal intensity with increasing concentration for both T1- and T2-weighted images. In vivo studies on mice showed that the particles accumulated in liver, lung, and spleen; this is not unexpected given the particle sizes but will need to be reduced if the particles are to be used for in vivo applications outside the liver. Preliminary studies were performed to characterize the ability to use 808 nm irradiation to induce cell death by photothermal processes. Particles modified to target EGFR (antibody conjugates) were able to induce cell death at irradiations of 15 W cm2 and greater. These shells show promising properties, and the hollow core offers possibilities for loading of drugs or other imaging functionality, but smaller particle sizes will be required for preclinical work.
Gadolinium oxide albumin microspheres have been reported that derived from earlier work that embedded small particulate Gd2O3 in protein microspheres.208 In that work, the gadolinium oxide particles were purchased commercially, 20–40 nm diameter, and embedded in albumin microspheres by suspending the particles in oil and adding them to a solution of albumin in aqueous solution for emulsification with sonication and heating. Microspheres of 1–4 μm diameter were formed in this manner. TEM of negatively stained particles shows a shell of albumin around the electron dense metal oxide particles in the core of the particle. Gd (417 mg/mL) was incorporated and resulted in relaxivities of r1 = 6.7 mM−1s−1 and r2 = 38.5 mM−1s−1 at 4.7 T. The authors cite improved imaging for particulate compared with free particulate Gd2O3, with effective contrast enhancement at lower concentrations, and this is further improved for albumin-embedded particles. This may reduce dose requirements and thus reduce the amount of gadolinum that is injected to the patient. The large size of these embedded probes is still a concern however, because these very large particles will clear through liver and lack of liver toxicity needs to be demonstrated. The ability of particles of this size to penetrate tumors also needs to be examined; vascular delivery may not be an option, but direct injection to tumors, for neutron capture therapy, may be an option.
3.3.3. Doped
Doped materials, as for the core/shells above, have focused on incorporating combinations of luminescent lanthanides with magnetic ions. For example, NaYF4, which has been mentioned in other works earlier in this review, has been doped with different ratios of a variety of rare earths (upconverting, Gd3+:Yb3+:Er3+, or downconverting, Gd3+: Eu3+) to generate optical or optical/MR probes.209 The nanocrystals were synthesized by first generating precursor trifluoroacetate salts of the lanthanides from the lanthanide oxides and trifluoracetic acid. Particles were formed using the precursor salts in a solution of octadecane, oleic acid, and sodium trifluoroacetate. Ligand exchange with 3-mercaptopropionic acid rendered water-soluble particles. The nanocrystals were characterized by confocal imaging of cells incubated with the particles, and MR imaging of solutions showed the ability to affect contrast for both types of modalities, requiring concentrations of 2 mM and greater to produce MR contrast. No toxicity was observed in the limited cell studies performed (2 h incubation, visual inspection of cells).
Lanthanide doping of gadolinium oxide nanoparticles has also been pursued, and terbium doping has been reported by two groups210,211 both using a modified polyol method by Bazzi.212 The method calls for dissolution of lanthanide chlorides in di(ethylene glycol), heating, then introduction of NaOH with heating and refluxing. The resultant particles were then made water-soluble either by ligand exchange with an organic acid followed by PEGylation211 or by polysiloxane shell coating (containing FITC).210 The polysiloxane-coated particles were only examined for luminescence applications. For PEGylated particles, the 4.3 nm particles were introduced to THP-1 monocyte cells and to Xenopus laevis fibroblasts to characterize uptake and luminescence in vitro. Although solution studies were done at an excitation of 350 nm, cell imaging was performed at 488 nm. This off-peak excitation may account for the low signal-to-noise images presented. It is difficult to tell from the included images, because the background is high, but the authors note that they do not observe the endocytic staining patterns typical for nanoparticles; they attribute this to low particle concentration in the vesicles. Relaxivity for the particles varied from 0.9 to 12 mM−1 s−1 (1.5 T).
Finally, in very preliminary work, nanoscale metal–organic frameworks doped with lanthanides have been investigated as possible dual-mode materials. These hybrid materials are constructed from building blocks of metal ion connectors and polydentate bridging ligands. The synthesis of frameworks built from gadolinium and benzenehexacarboxylate (bhc) ligands have been described.213 It was found that a reverse-phase microemulsion method produced amorphous materials without consistent morphology; therefore the authors switched to a surfactant-assisted synthesis at high temperature. This yielded a variety of morphologies from particles to rods with different gadolinium coordination environments. The materials were magnetic and, if doped with Eu or Tb, were luminescent (excitation 250, 309 nm respectively). The work is still far from biological application however because the particle sizes can be quite large (up to micrometer) and the particles are not coated for stability or water solubility. The final synthesis steps yielded particles in ethanol; it was not clear how relaxivity measurements were performed.
For all of these types of lanthanide-doped nanoparticles, the concern always exists that the particles will accumulate in the body where they will be degraded and release free lanthanide ions; although lanthanides are typically much less toxic than cadmium, they have still been observed to bind to Ca2+ and Mg2+ binding sites in vivo;214 thus, the same concerns exist as for quantum dots that nanomaterials can break down into components that interfere with biological processes. In addition morphology can also influence toxicity of even nontoxic elements, as carbon nanostructures have demonstrated, as well as determining clearance mechanisms.215,216 Nanostructures that accumulate in the liver are at risk for liver toxicity and rare earths have been observed to induce liver toxicity.217 Clinically available gadolinium agents confine the ion to strongly binding chelates, which effectively neutralize their toxicity. This would be most desirable for the least risk of toxicity, but that approach is not possible for designs where the lanthanide must be incorporated as part of the crystal lattice of the material.
3.3.4. Heterostructures
This subcategory of materials is a sort of “curiosity shop” of potential probe materials and is populated with a variety of generally asymmetric structures containing combinations of imaging-active elements. These have primarily been investigated as novel materials as opposed to imaging probes; therefore we will keep this section brief. Heterodimers are one of the more widely reported composites. Sometimes generated when core/shell syntheses go awry, the incompatibility between two lattices of materials results in “Siamese twins” of the two lattices rather than a shell coating a core (Figure 27). Where the two materials have different modality detectability, a multimodal probe is formed. Reported heterodimers include FePt–CdS,218 FePt–Au,219 Pt–Fe3O4, Ni–Fe3O4, Ag–MnO, and Au–MnO,220 which were proposed for combinations of MRI and optical imaging by various methods (reflectance, absorbance, etc). A few more unusual heterostructures come with intriguing monikers: nanowontons and nanodiamonds. Nanowontons are gold-sandwiched ferromagnetic cobalt cores that assume a crescent shape reminiscent of the Chinese foodstuffs. The gold is intended to protect the cobalt core from oxidation because this can cause toxicity and degradation from the particles. They are fabricated by a semiconductor etching method in which sequential 10 nm layers of gold, cobalt, and gold are deposited on the surface of silicon nanopillars. The pillars are then etched away leaving the sandwiched gold–cobalt–gold structures (Figure 28). A layer of chromium that is initially deposited is not shown. The fate of this chromium and its purification away from the system will be an important issue for toxicity. The probes are intended for MRI (cobalt) and photoacoustic imaging (gold) with 700 nm excitation. Nanowontons were 30–90 nm in size; the broad size range was attributed to inhomogeneities in the nanopillar diameters. The particles have a broad flat absorbance profile across 488–800 nm and were able to produce contrast in solution phantoms for photoacoustic and MR images. As a test for tissue contrast, the probes were injected intramuscularly to mice hind limbs, but strangely the animal was euthanized prior to imaging by T2-weighted MRI rather than imaged live; reasoning was not explained. Under these conditions, an agent sensitivity of 50 pM was determined. This is a per particle concentration; Co concentration is not given. The authors expect that more elongated shapes, nanorods or needles, would have better MRI properties due to larger susceptibility gradients; however, it is not discussed whether these shapes may have increased toxicity, as has been observed in the literature for other nanostructures (rods and fibers being more toxic than spheres) as mentioned earlier. Yields are also not given, which are of interest for these solid-state fabrication methods versus solution-based methods that are typically higher yielding and scaleable.
Figure 27.
Formation of FePt–CdS heterodimers: (A) FePt particles; (B) FePt–CdS heterdimers; (C) high-resolution EM; (D) selected area electron diffraction (SAED) shows rings from characteristic phases of fcc disordered FePt and zinc blende CdS. Reproduced with permission from ref 218. Copyright 2004 American Chemical Society.
Figure 28.
Building of nanowonton structures on silicon pillars: (1) pillars; (2) gold deposited on pillars followed by (3) a layer of cobalt and (4) another layer of gold; (5) the pillars are etched away leaving (6) nanowontons. Reproduced with permission from ref 327. Copyright 2009 National Academy of Sciences, U.S.A.
Nanodiamonds are a crystalline carbon component of detonation soot that results from explosive shocks to graphite in or near the explosive.221 They are a curiosity that has been explored as an inert carrier for biologically active species. In recent work, a microwave irradiation method was used to form iron-filled carbon nanoparticles on the surface of nanodiamonds, and fluorescein was conjugated to the surface to form magnetic–fluorescent materials for MR and optical imaging.222 Commercial nanodiamonds were employed for the syntheses (Figure 29a). Focused microwave irradiation of a nanodiamond, ferrocene, and silicon powders produced magnetic carbon soot composed of a number of iron nanoparticles wrapped inside graphene layers on the surface of the larger nanodiamonds (Figure 29b). These were then additionally irradiated to polymerize acrylic acid, benzoylperoxide, and fluorescein-o-methacrylate on the surface. The final size for these nanodiamond hybrids is not given, and it is difficult to determine from the EM where one particle begins and ends, but they appear to be quite large. The iron particles are 5–20 nm, and the entire nanodiamond hybrid appears to exceed the field of view (>100 nm). Only fluorescence imaging, not MRI, was performed, but magnetization curves were obtained that show hysteresis at 298 K. The particles were applied to HeLa cells and appear primarily to be localized at the cell surface with nonspecific pinocytosis bringing some probe into the cytoplasm (Figure 29c). This would be consistent with particles that were >100–200 nm in diameter.
Figure 29.
(a) Synthesis of magnetic nanodiamonds surface-functionalized with fluorescein. (b) TEM of the magnetic nanodiamonds showing iron–carbon nanoparticles on surface of the nanodiamonds. (c) When applied to cells, the nanodiamonds appear primarily near the cell surface. Reproduced with permission from ref 222. Copyright 2008 American Chemical Society.
3.3.5. Novel Structures
In addition to some of the unique morphologies described above, other nonspherical multifunctional materials have been reported. Because these are mostly “one-off” reports, we merely describe the structures here without providing discussion of synthetic methods or properties, and we refer the reader to the citations for details. These nonspherical structures include tubular structures such as mesoporous silica nanorods that are loaded with gadolinium and fluorescein in the pores (Figure 30),223 carbon nanotubes with iron oxide nanoparticle “handles” fused to one end (Figure 31),224 zeolite nanocontainers with combinations of dye and lanthanides bound to the surface or introduced into channels (Figure 32),225 and necklace-like cables of metal–poly(vinyl alcohol) loaded with iron oxide nanoparticles (Figure 33).226
Figure 30.
Silica nanorods loaded with gadolinium and fluorescein. Reproduced with permission from ref 223. Copyright 2008 Wiley-VCH Verlag GmbH & Co. KGaA.
Figure 31.
Carbon nanotubes with iron oxide on one end. Reproduced with permission from ref 224. Copyright 2007 American Chemical Society.
Figure 32.
Zeolite nanocontainers loaded with dye and lanthanides. Reproduced with permission from ref 225. Copyright 2008 American Chemical Society.
Figure 33.
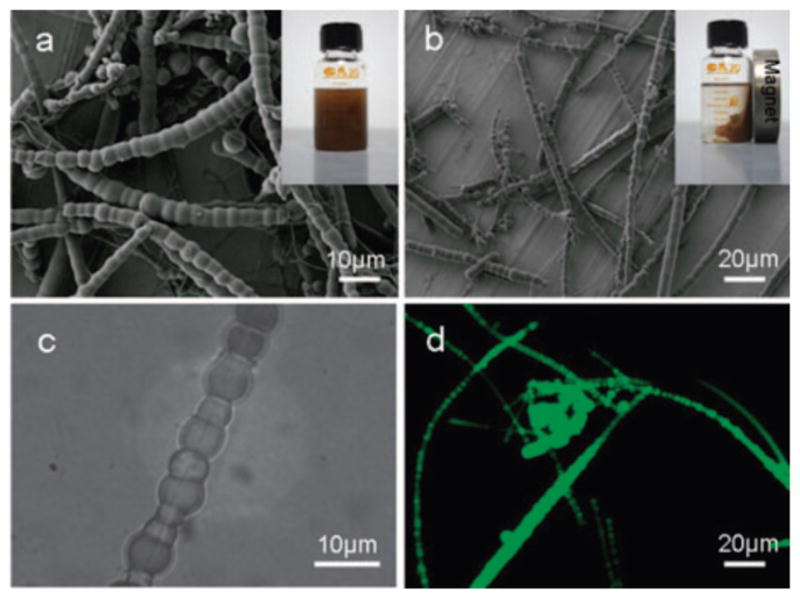
Cables of CuPVA loaded with iron oxide nanoparticles: (a) pure nanocables; (b) magnetic nanocables, attracted to magnet at side; (c) magnetite nanoparticles attached to cables; (d) fluorescent images of nanocables. Reproduced with permission from ref 226. Copyright 2009 Royal Society of Chemistry.
3.4. Nanoparticle Carriers
In contrast to the above methods where the material of the nanoparticle matrix provides magnetism or luminescence, multimodal nanoparticle agents can be constructed by embedding probes of various functionalities within an inert matrix (Table 5). This allows mixing of imaging agents of predetermined performance characteristics, with only minimal interference by the surrounding matrix. The chemistry for assembling the carrier matrix is generally much less complicated than those described earlier for synthesizing magnetic or luminescent nanoparticles. In addition, the proportion of imaging probes of different types can be controlled simply by varying stoichiometry of starting reagents. The carrier matrix can be assembled as nanoparticles first then swelled to infuse imaging probes into the matrix, or probes can be covalently attached to matrix components prior to particle formation. In this section, we highlight a few of the most popular methods for using inert carriers to form multimodal imaging agents.
Table 5.
| probes | modalities | size (nm) | imaging properties | refs |
|---|---|---|---|---|
| Silica Nanoparticles | ||||
| GdAuSiO2 | MRI/Photoacoustic | 50–200 | For 100 nm, r1 = 13 mM−1s−1, r2 = 110 mM−1s−1 (4.7 T), ~34 000 Gd/particle; PAT contrast | 256 |
| (Fe3O4 + QD)SiO2 | Tomog magnetic/optical | 50 | superparamag, no coercivity, 3.21 emu/g; λem = 580 (λex = 340), QY up to 10% | 255 |
| Ru(bpy):Gd–DTTA, Gd–DOTA/SiO2 | MRI/optical | 37 | r1 = 19.7 mM−1s−1, r2 = 60 mM−1s−1 (3 T); λem = 595 (λex = 488) | 252 |
| 37–43 | r1 = 19 mM−1s−1, r2 = 55 mM−1s−1 (9.4 T); λem = 515/615 (λex = 488) | 247 | ||
| Ru(bpy):GdTSPETE/SiO2 | MRI/optical/CT | 100 | r1 = 9 mM−1s−1, r2 = 116 mM−1s−1 (4.7 T); λem = 600 (λ ex = 450); fluoroscopy of solutions | 253 |
| rhodamine SiO2:Fe3O4 | MRI/optical | 46 | r2 = 397 mM−1s−1 (9.4 T); λem = 580 | 251 |
| Fe3O4–SiO2:FITC SiO2 | magnetic/optical | 57.5 | align with magnet, T2 imaging; green (FITC) | 246 |
| Fe3O4–SiO2:QD–SiO2 | magnetic/optical | 80 | superparamag, no coercivity, 3.2 emu/g; λem = 618 (λex = 365) | 254 |
| 330 | magnetism ND; red, green, yellow (λex = 330) | 249 | ||
| 10 | superparamagnetic, no coercivity (rt), 5.8 emu/g; λem = 588 (λex = 380) | 248 | ||
| dimer Fe3O4–SiO2:FITC SiO2 | magnetic/optical | 154 × 115 | superparamag, no hysteresis (300 K), r2 = 153 mM−1s−1 (0.47 T); green emission (FITC) | 302 |
| Dendrimers | ||||
| GdDTPA and AlexaFluor | MRI/optical | 5 | G3 r1= 38.78–10.09 mM−1s−1 (3 T, 22 °C); AlexaFluor488 (green) or -594 (red) | 260 |
| GdDTPA and rhodamine | MRI/optical | a | r1 = 12.4 mM−1s−1 (3 T, 22 °C); RhodG (green) | 259 |
| 11G7–13G8 | r1 = 7.8–12.2 mM−1s−1(3 T); RhodaB (red) | 258 | ||
| GdDTPA and Cy5.5 | MRI/optical | a | r1= 13.9–20.5 mM−1s−1 (3T); λem= 683 (λex = 674) | 261 |
| 111InDPTA and AlexaFluor | optical/SPECT | 8 | Alexa 660, 680, 700, 750; radioplate imaging | 332 |
| Chitosan | ||||
| Gd–DTPA and QD | MRI/optical | 50 | measured T1 at 7 T, r1 not calcd; λem = 565 | 240 |
| 60 | r1 = 4.5 mM−1s−1, r2 = 14.1 mM−1s−1 (1 T); green and red PL | 241 | ||
| γFe2O3 and FITC | MRI/optical | 13.8 | 53.47 emu/g; λem = 520 (λex = 488) | 242 |
| Fe3O4 and QD | MRI/optical | 107 | 77 emu/g; λem = 565 (λex = 480) | 232, 243 |
| 99 mTc, pyrene, cyclosporine | SPECT/optical/therapy | <230 | λem = several 362–459 (λex = 336); γ camera imaging | 244 |
| Polymer Nanoparticles and Macromolecules | ||||
| PEI with FITC and MnFe2O4 | MRI/optical | 74 | superparamagnetic no coercivity, 38.2–56.3 emu/g (0.9 T); FITC | 230 |
| PCL–PMAA with pyrene and MnFe2O4 | MRI/optical | 112.7 | superparamagnetic no coercivity, 52.5 emu/g (5 T), r2 = 404 mM−1s−1 (1.5 T); blue PL (λex = 330–385) | 227 |
| PBA–PEA–PMAA with Fe3O4 and QD | magnetic/optical | 286.7 | superparamag, no remanence, 63.74–9.83 emu/g (300 K); QD 567 and 606 | 228 |
| PSGMA with Eu(TTA)3 and Fe3O4 | magnetic/optical | ~200 | attract to magnet; λem = 618 (λex = 340) | 236 |
| polystyrene with Fe3O4 and QD | magnetic/optical | 450 | superparamag, no coercivity (300 K), 34.4 emu/g; λem = 440 (λex = 350) | 237 |
| 136.3 | attract to magnet; QD 530 or 652 | 233 | ||
| a | cell imaging | 234 | ||
| 4800 | superparamag, 0.5 emu/g; λem ≈ 550 (λex = 400) | 238 | ||
| a | attract to magnet; Alexa660 | 235 | ||
| EPMA with rhodamine and 68Ga or 111In or Gd | optical/PET, γ scintigraphy, or MRI | ~144 | PET MOSAIC system (Philips) and 3 T MRI; rhodaB | 229 |
| GdDTPA and NIH813 | MRI/optical | 46 | T1 at 1.5 T in solutions | 268 |
| rhod 6G, GdDTPA | MRI/optical | 220–30 000 | r1 as shown ~1.3 (mg/mL particles) −1s−1 | 231 |
Not determined.
3.4.1. Polymer
The use of polymer carriers has its roots in drug delivery research, where polymer nanoparticles are used to carry a payload of drug to a site of action. It is a logical extension to apply this method to carry a payload of imaging agents. Many types of polymers have been described in the literature for this purpose, including polyethyleneimine and many types of methacrylic acids, particularly styrene derivatives. The methodology often has much in common with micellar technology.
3.4.1.1. Polymethacrylates
Polymethacrylates are generally included as components in amphiphilic block copolymers that are used as phase transfer agents to carry a payload of fluorescent or magnetic nanoparticles or both. For example, the amphiphilic block copolymer poly(ε-caproprolactone)-b-poly(methacrylic acid) (PCL-b-PMAA) has been used as a surfactant in an emulsification procedure to generate water-soluble magnetic and fluorescent nanoparticles.227 The block copolymer covalently coupled to pyrene is dissolved in water and mixed with magnetic nanocrystals suspended in chloroform and emulsified with an ultrasonicator (450 W) for 10 min. This is a common method to attach a fluorophore to the individual polymer chains before assembling particles. After solvent evaporation, the particles were purified by centrifugation and resuspended in PBS. The resulting particles of 112 nm diameter appeared as clusters containing multiple 12 nm magnetic cores per particle (Figure 34). Blue emission was observed with UV excitation, from the pyrene group, which is not ideal for biological applications, and the particles had the ability to affect T2 contrast. These particles were further conjugated to cetuximab for in vitro assays of targeting to cancer cells (A431 MCF-7).
Figure 34.
PCl-b-PMMA nanoparticles loaded with magnetic nanocrystals: (a) magnetic nanocrystals; (b) fluorecent magnetic nanohybrids. Reproduced with permission from ref 227. Copyright 2008 Elsevier.
Similarly, ultrasonic emulsification was used to incorporate both QDs and magnetic nanocrystals into block copolymers.228 In this case, QDs, magnetic particles, and poly(tert-butyl acrylate-co-ethyl acrylate-co-methacrylic acid) were mixed in dichloromethane; then this solution was injected slowly to a solution of F-68 in water under ultrasonication with a converter. After injection, the organic solvent was evaporated, and the particles were purified by centrifugation and washing. By this method, a variety of QD types and magnetic particle loads were synthesized, and particle size varied with proportion of polymer, but the authors note that size distribution was very difficult to control and a very broad size range was observed. The average size is cited as 286.7 nm, but this appears to be an error in scale because the plot shown seems to indicate 2867 nm. Stability was tested against range of pH 2–12 and salt 0.01–1 M, data not shown.
Another method to generate particles from polymers used a slow infusion approach to semibatch emulsion copolymerization.229 EPMA (poly(glycidyl methacrylate)poly(2,3,-epoxypropylmethacrylate)) nanoparticles were synthesized, and cationic tracers were bound directly without chelators. Briefly, a solution of SDS containing rhodamine B was mixed with 2,3-epoxypropyl methacrylate under nitrogen with stirring for 20 min at rt then at 60 °C for 10 min. Polymerization was then initiated by the dropwise addition of aqueous potassium peroxydisulfate simultaneously with the infusion pump addition of methacrylic acid. Polymerization was complete after 6 h. The resulting particles were dialyzed 3 days against water and ultrafiltered. Labeling of the particles proceeded by incubating the particles with solutions of 111InCl3, 68Ga, or GdCl3. Particles of 144 nm were obtained (DLS). It was hypothesized that the high number of carboxyl groups on the particle surface could substitute for chelators to bind cationic ions. While no stability assays were performed, it was noted in the biodistribution studies in the rat that no renal clearance was observed for 111In- and 68Ga-labeled particles suggesting that the radiolabels remained associated with the particles. For Gd, initial circulation was observed, but no contrast was evident after the first scan at 30 s postinjection. Blood dilution is cited as the cause for this lack of signal. While this very simple method for radiolabeling is appealing, much more extensive tests of stability under physiological conditions are required before these materials can be considered for routine application in vivo.
Polymer coatings have also been used to couple FITC to polyethylenimine-coated magnetic nanocrystals of iron oxide.230 The polymers were introduced to the nanocrystals, and emulsification resulted in polymer-coated nanoparticles. These were surface-functionalized by reacting FITC with the free amines on the particle surface. TEM indicates that multiple magnetic cores were incorporated to each particle with an average size of 74 nm, and the particles were superparamagnetic with no coercivity in the magnetic hysteresis loops. Stability of these types of emulsions is always a question, and colloidal stabilitiy was assessed by exposing the particles to a range of conditions in pH (5–10) and salt concentration (0.01–1.0 M NaCl) then reevaluating size after 24 h. There was no observable particle aggregation under the conditions tested, and size continued to hover around 80 nm.
Emulsification methods have also been applied to encapsulated hydrophobic and hydrophilic contrast agents in particles of PLGA (poly(lactic-co-glycolic acid)).231 Poly-(lactic acid) (PLA) and PLGA are biodegradable, biocompatible polymers that are widely studied for controlled released and delivery of drugs. Particles of PLGA were formed by water–oil–oil (W/O/O) double emulsion techniques using sonication to coencapsulate Gd–DTPA and rhodamine 6G. Both agents were added to the aqueous phase of the emulsion. W/O/O with 45 W sonication yielded particles from 1 to 30 μm in diameter and with 120 W yielded submicrometer-sized particles. O/W was also utilized as an alternative method of synthesis and was able to produce smaller particles of 220 nm. Detectable changes in T1 were noted for concentrations of particles above 0.5 mg/mL (1.5 T). PLGA encapsulated rhodamine 6G was also coated with a silver cage to produce a particle for photoacoustic applications. For these particles, silver was photoreduced onto the surface of prepared particles presenting poly(vinyl alcohol) (PVA) on the surface. PVA was already present from particles generated by the O/W technique, because W/O/O the particles were incubated in PVA solution. The particles were mixed with silver nitrate in water and irradiated under UV to yield seed silver grains on the particle surface; then ascorbic acid was added for silver reduction to further grow silver on the PLGA particle surfaces. Porous silver layers of thickness 40–80 nm were deposited in a rather efficient process. From SEM images, the particles are raspberry-like structures with small balls of silver covering the surface. Porosity was assumed to be afforded by the incomplete covering of these silver spheres on the surface. It was determined that 95% of the added silver was incorporated to the cages. Loading yield for the probes varied from 0.1% to 60% for rhodamine 6G, depending on the type of particle and method used. Gd–DTPA loading efficiencies 15–70% were reported in a more recent work by the same group on particles containing only Gd–DTPA.232
3.4.1.2. Polystyrenes
Polystyrene derivatives have been applied widely in the literature to encapsulate QDs and iron oxides.233–235 They have also been used to encapsulate ferrite and europium236 and formed into hollow shells carrying QDs and magnetite in the shell.237 Similar emulsification methods can be used as described above for the methacrylates where CdTe QDs and magnetic nanoparticles are first coated with didecyl-p-vinylbenzylmethylammonium chloride (DVMAC) surfactant or silica, respectively, for transfer into styrene.233 The coated particles were encapsulated into polystyrene beads by three different synthetic routes all centered on mixing the nanoparticle components in the presence of a surfactant with heating and mechanical disruption. In the absence of ultrasonification, very large bifunctional beads were formed (7.2–8.7 μm); size was reduced if ultrasonification was applied before polymerization (136.3 nm). The iron oxide nanoparticles tended to aggregate in the center of the beads. The bifunctional beads were found to be luminescent and attracted to magnets. Silica coating of the Fe3O4 particles was found to preserve luminescence efficiency of the QD compared with noncoated iron oxides, presumably by inhibiting reabsorption of fluorescence.
As an alternative to emulsion-based techniques, polymer nanocarriers can be preformed then loaded with QDs and IOs.234,238 Loading of ferrite and europium complexes has also be described.236 In this method, the styrene is polymerized first, sometimes as a seeded polymerization, to form porous polystyrene beads, and the beads are subsequently swelled and mixed with QDs and IOs to load them into the matrix (Figure 35). Typically the QDs and iron oxides are coated with a hydrophobic layer such as oleic acid to be soluble in chloroform, and the beads are swollen in chloroform for loading of the particles. Chloroform is evaporated, and the beads are progressively transferred to aqueous solvent. Beads described in the literature generally are rather large, in the range of micrometers, and have only been tested in vitro; further work is required to bring size down to avoid rapid clearance in vivo. Somewhat smaller beads, ~200 nm, have been prepared by admicellar polymerization, and swelling in acetone was used to load europium complexes.236 The beads were then shrunken by placing them in water. For all of the constructs prepared by swelling, leaking from the porous beads is always of concern and needs to be carefully characterized and monitored.
Figure 35.
(a) Styrene particles loaded with iron oxides and quantum dots by swelling and shrinking method. (b) TEM of particles. Reproduced with permission from ref 238. Copyright 2007 The Chemical Society of Japan.
Conjugation methods can also be applied to polystyrene beads, and QDs have been coupled to commercially available magnetic polystyrene particles.235 Paramagnetic latex microspheres (Dynal, Wirral, U.K.) of 4.5 μm were first coated with a layer of poly(allylamine) onto which mercaptoacetic acid coated QDs self-assembled. This was followed by additional layers of QDs (up to 15), then 3.5 bilayers of poly(ethyleneimine) and poly(sodium 4-styrenesulfonate), and finally the spheres were coated with an antibody-reactive surface of haptenylated PDP–dextran. The particles are luminescent and can be magnetically separated, making them appropriate for cell-sorting applications.
PEGylated polymers have been pursued as a method to avoid the opsonization process (adsorption of plasma proteins on the surface) that leads to macrophage clearance of particles.239 PEG also tends to increase circulation time and reduce particle aggregation. Methoxy-terminated poly(ethylene glycol) (mPEG) therefore was attached to amphiphilic block copolymers of poly(acrylic acid)-b-polystyrene (PAA-b-PS) at grafting densities of 1, 2.5, and 5.5 mPEG per macromolecule. Carbodiimide coupling methods in HOBt were employed. DOTA–lysine was then grafted onto PEG-g-PAA-b-PS in a similar fashion. These were formed into micelles by injecting an equal volume of water into the polymer solution followed by 4 days of dialysis. Cross-linking of the particles was achieved by addition of a solution of 2,2′-(ethylenedioxy)-bis(ethylamine) in water followed by introduction of EDCI (1-[3′-(dimethylamino)propyl]-3-ethylcarbodiimide methiodide) in water. The reaction mixture was stirred for 16 h at room temperature then dialyzed for 5 days against PBS yielding particles of ~20 nm. 64Cu labeling of the particle afforded PET detection. While these are not multimodal particles, the technology is presented here because the method could easily be amended to include fluorophores or the grafted polymers could be used in any of the above formulations to incorporate chelators.
In an unusual variation on the polymer carrier theme, Yang et al. describe the preparation of hollow poly(styrene-co-methyl methacrylate) microspheres, with CdS QDs and magnetite loaded into the shells, using a method involving γ-ray irradiation from a 60Co source. The hollow microspheres are first formed by polymerization under ultrasonification to form an O/W miniemulsion; this is then bubbled with nitrogen and sealed for irradiation. CdS is then introduced by the addition of CdCl2 and Na2S2O3 · 5H2O and additional irradiation as above. The CdS particles are proposed to form on the surface of the hollow microspheres, while magnetite is embedded in the shell. These are large structures of 450 nm that are luminescent and superparamagnetic. The authors propose that these particles could be used to carry drugs. Certainly these hollow vessels are an interesting design, but better control of size will be required for in vivo applications.
3.4.1.3. Chitosan
Chitosan has received a great deal of attention in the literature due to its biocompatibility, its ability to bind to cells via electrostatic interactions, and more recently its potential to cross the blood–brain barrier. Nanoparticles of chitosan have been described that carry QDs and Gd–DTPA,240,241 IOs and FITC,242 IOs and QDs,243 and 99mTc, pyrene, and cyclosporine.244 In general, the positively charged chitosan polymer coats by electrostatic adsorption around a nanoparticle core such as a QD or IO, and other components can be introduced during the coating process to embed them in the chitosan matrix. Or all components are entrapped simultaneously in the chitosan matrix (Figure 36). Both methods rely on electrostatic interaction of the chitosan with other components and the formation of particles by an emulsion process in the presence of surfactant. By these methods, relatively small chitosan particles carrying multiple imaging probes have been prepared, from 50 to 230 nm, which is in a suitable range for in vivo applications. Release profiles typically show that larger components such as QDs are not released from the chitosan matrix to an appreciable degree while small molecules such as Gd–DTPA are released, sometimes in multiple phases with a rapid initial release followed by a gradual phase.241 The porosity of the matrix and release of entrapped compounds is useful for drug delivery applications, where chitosan has been extensively studied. For example, 99mTc- and pyrene-containing particles were used to track the delivery of cyclosporine in a rabbit eye model.244 Drug- and pyrene-loaded chitosan particles were radiolabeled by mixing with 99mTc in saline and sodium borohydride. The distribution of probe on rabbit corneas was assessed by SPECT, and the pyrene was added as a means to characterize the chitosan particle suspension, in particular, the concentration threshold of self-aggregation of polymeric amphiphiles. Radiolabel stability was not addressed. The nanoparticles are found to bind to the corneal surface, attributed to cationic activation. Chitosan is also reported to use this mechanism to open tight junctions to allow transport across the corneal epithelium, and this is true for co-administration of chitosan as well as for drugs encapsulated by chitosan. Penetration of the epithelium, however, was not observed in these studies with most of the particles as aggregrates on the cornea and conjunctiva with a few aggregates infiltrating the iris and ciliary body. Drug release, assessed in vitro, was found to be by burst effect in the first 4 h, then gradual release up to 48 h. The porosity of chitosan, as for the methacrylates described above, affords advantages for drug release but requires careful consideration when choosing these matrices as carriers for imaging probes.
Figure 36.
Quantum dots and iron oxides embedded in chitosan particles. Reproduced with permission from ref 243. Copyright 2007 Institute of Physics.
3.4.2. Silica
By far the largest body of literature on inert matrices for multimodal nanoparticles is for silica. Silica has the advantage of being resistant to swelling but still providing an optically transparent, water-soluble matrix for the entrapment of probes. In a recent review, two typical synthetic routes are summarized to generate silica nanoparticles: the Stober sol–gel method and reverse microemulsion (W/O).245 The Stober method of base-catalyzed hydrolysis and condensation of tetraethyl orthosilicate has been widely used to dope dyes into silica matrices. This reaction occurs under relatively mild conditions, is low cost, and does not use surfactants. More recent papers use a modified layer-by-layer approach to incorporate mixtures of probes in silica such as IO and FITC,246 Ru(bpy) and GdDTTA,247 or IO and QDs.248,249 The IO and QD syntheses start with Fe3O4@SiO2 nanoparticles, which then are coated with outer layers of pure silica and QDs co-condensed with tetraethyl orthosilicate (TEOS). This layering can be repeated to coat with multiple layers of QDs.
Most other reports use the W/O approach. The reverse microemulsion approach mixes surfactant, oil, and water to form nanoreactors for the synthesis of the silica particles. In contrast to the Stober, this method typically required multiple steps of subsequent layering. By this method, bifunctional agents have been generated containing fluorescent dye and IOs,250,251 Ru(bpy) and GdDTPA, GdDTTA, or GdTSPETE,247,252,253 mixtures of QDs and IOs,254,255 and Gd and gold.256 In the gadolinium-containing nanoparticles, Ru(bpy)-doped silica cores were prepared by the reverse microemulsion method and were then coated with a silica layer formed by applying TEOS and TSPETE overnight followed by addition of gadolinium acetate hydrate. The particles were terminated with amines by adding a surface layer by mixing with TEOS and THPMP (3-(trihydroxysilyl)propyl methyl phosphonate) then adding APTS (3-(aminopropyl) triethoxysilane). This yielded 100 nm fluorescent, radio-opaque nanoparticles that could generate MRI contrast by both T1- and T2-weighted imaging methods. It was estimated based on ICP that 16 000 Gd3+ ions are bound to each nanoparticle with reported r1 of 9.0 mM−1s−1 and r2 of 116 mM−1s−1 (4.7 T). Potential toxicity issues were not addressed.
A number of configurations can be achieved through layering of silica. Reported placements for IOs and QDs in silica matrices include IOs and QDs dispersed together in a silica core (Figure 37),255 magnetic cores in a silica core surrounded by QDs in a silica shell (Figure 38),254 and dimer-like structures of silica-coated iron oxides deposited onto FITC-doped silica nanoparticles (Figure 39).250 The common matrix of silica allows variable placement using layering techniques, and silica has the additional advantage as mentioned earlier of isolating the IOs from the QDs to prevent quenching of luminescence. Most of these particles have been used for magnetic separation as opposed to MRI but have properties with potential for imaging.
Figure 37.
Iron oxides and quantum dots dispersed together in a silica core. Reproduced with permission from ref 255. Copyright 2007 Institute of Physics.
Figure 38.
Quantum dots in silica shell around silica coated magnetic particles. Reproduced with permission from ref 254. Copyright 2008 Elsevier.
Figure 39.
Silica-coated iron oxide particles deposited on FITC-doped silica nanoparticles. Reproduced with permission from ref 250. Copyright 2006 American Chemical Society.
Gadolinium-containing gold-flecked nanoparticles of silica were prepared by the reverse microemulsion approach using silica cores surface modified with TEOS and TSPETE, followed by addition of gadolinium acetate and HAuCl4256 The 50–200 nm particles were flecked at the surface with 1–5 nm gold nanoparticles and considered to be doped with gadolinium. Size could be manipulated by varying reactant concentrations and the water/surfactant molar ratio (W0) of the microemulsions, with lower W0 producing larger particles. The smallest 50 nm particles were obtained for W0 = 14 and the largest 200 nm for W0 = 5. Relaxivities at 4.7 T were r1 = 13 mM−1s−1 and r2 = 110 mM−1s−1. The gold content allowed the application of these particles for photoacoustic tomography (PAT), and therapeutic potential is also suggested. The speckled nature of the gold on the surface is explained to allow interaction between the doped gadolinium ions and bulk water, indicating a porous matrix of silica.
3.4.3. Dendrimers
In contrast to encapsulating probes into a matrix of silica, dendrimers are an assembly of branched polymers that terminate in numerous functional groups to which probes can be coupled (Figure 40). Typical dendrimers are composed of branched chains of polyamidoamine (PAMAM) and are considered to be biocompatible.257 The chains are terminated with amines, typically, to which any probe of interest may be coupled using standard amine-reactive chemistries. Dendrimers carrying GdDTPA and fluorescent dyes including rhodamine,258,259 Alexafluor,260 and Cy5.5261 have been reported, as well as radiolabeled 111In-DTPA and AlexaFluor conjugated dendrimers. The branched nature of the dendrimers provides very large numbers of functional groups at the surface, while the particles are of relatively small size, for example, G3 = 3.6 nm and G8 = 9.8 nm (G = generation number). The size allows tuning of in vivo clearance properties as the smaller G3–4 dendrimers are excreted through the renal system, while G5 is cleared through both kidney and liver, and G6–9 are excreted only through the liver.257 Dendrimers are now available commercially (e.g., Dendritic Nanotech, MI; Aldrich, MO) reducing the process for generating multimodal probes to simple conjugation methods. Synthesis of dendrimer nanoparticles262–266 is described in the literature and is beyond the scope of this review.
Figure 40.
PAMAM dendrimer “arm” conjugated to gadolinium chelates (yellow/green), fluorescent dye (pink), and targeting peptide (orange). Reproduced with permission from ref 260. Copyright 2008 American Chemical Society.
4. Macromolecular Carriers
Similar in principle to many of the examples already discussed, different types of probes can be brought together to form a multimodal probe by coupling them to a common macromolecule. Typically this uses standard conjugation chemistries to attach various proportions of imaging contrast agents to reactive amines, thiols, and carboxyls. By this approach, gadolinium chelates and fluorophores have been jointly coupled to polymers such as polylysine,54,267 poly(glutamic acid),268 and dextrans.54 In these polymers, termination of reactive groups seems to have a greater influence on toxicity and transport than dye loading. Early work that aimed to add 100, 400, or 800 Gd–DTPA per polylysine (3500 MW) found that polylysine was toxic to living cells if the remaining free amines were not converted with β-propriolactone.54 Similarly, more recent work found a lower MRI signal enhancement in cells that were incubated with polylysine carrying higher numbers of fluorescent dyes but the same number of Gd–DTPA (368 DTPA/polymer, polylysine size not given) molecules.267 Additional control studies were performed, and it was found that a difference in cell uptake was observed between polymers with high and low Cy5.5 loading, hypothesized to be due to charge from free amines. If these amines were capped with trinitrobenzenesulfonic acid, cell uptake efficiency was the same regardless of dye loading. It was noted that the high and low dye loaded polymer migrated as uncoiled, extended polymers, not globular structures. This was measured by HPLC on a Biosep column. Capped polymers also behaved as extended polymers, so the loss of amine charges did not appear to alter conformation. These results highlight that polymer conformation is an important part of the equation that needs to be considered with interpreting signal enhancement capabilities of a probe.
Although the roots of the dextran conjugates are from work in 1998, they have more recently been applied for tracking stem cell in models for stroke research.269–271 MHP36 immortalized murine neural stem cells were loaded with the dextran conjugates by simple incubation for up to 24 h. Decreases in cell proliferation were noted for incubation times after 8 h, which are concerning, and the effect on subsequent cell behavior needs to be examined further. Interestingly, the signal from the Gd–DTPA–rhodamine dextran (GRID) labeled cells was throughout the cytoplasm and did not appear to be sequestered in lysosomes, as might be expected for some cellular uptake processes. It was noted that the effect of GRID was quenched inside cells compared with in solution. This is similar to the intracellular sequestration effect reported by others, where MRI contrast agents localized to subcellular organelles experience reduction in water exchange rates that reduced contrast enhancement.53 Perhaps more important for stem cell tracking applications, the probes were found to be retained up to 7 days and retained at levels affording continued contrast enhancement even with cell proliferation. Issues with proliferation and production of reactive oxygen species, however, require further investigation.
Peptides are also a popular platform for carriers. Longer peptides have similar properties to polymers, while short peptides are much like small molecular conjugates. Like small molecule conjugates, the number of probes that can be attached to a single peptide is limited; thus applications for MRI are less attractive because it can be difficult to achieve gadolinium loading sufficient to achieve contrast without overloading on radiotracers or fluorophores. Nevertheless short peptides containing Gd–DTPA and Oregon Green79 or Gd–DOTA and AFC (7-amino-4-trifluoromethylcoumarin)272 have been reported. Both proceeded by modification of solid-phase BOC or Fmoc chemistry, respectively. Gd–DTPA and Oregon Green were added to presynthesized peptides through free thiols on internal cysteine residues or C-terminal thioester.79 In other work, Gd–DOTA was added at the N terminus and Fmoc AFC was added at the C terminus as part of the solid-phase synthesis.272
Radiolabeled peptides bearing fluorophores provide probes at similar concentrations for modalities of similar sensitivity, arguably making more sense as biomodal agents. 64Cu, 177Lu, and 111In DTPA derivatives of peptides also labeled with cypate,273,274 IR768,275 or IR800276 have been reported. For the cypate-labeled peptides, peptide ligands of the subtype-2 somatostatin receptor (SSTr2) were synthesized first, then modified by coupling DOTA to the N-terminal amine and cypate to the ε-amino of the C-terminal lysine.275 These peptides exhibited some unanticipated behavior in biological systems: while high affinity binding was shown in vitro, uptake for tumors in vivo did not match expectations. Biological properties of the peptide rather than issues with probe loading seemed to be the culprit, and the authors hypothesize that the peptide is an antiagonist that is not internalized but that the probes are internalized by cultured cells of the same type but at slow rate compared with controls. Similar bimodal labeled peptides from the same group that were targeted to integrins did localize as expected to tumors.273 Clearly for all imaging probes, the efficacy of the targeting plays a major role in performance.
Macromolecular targeting molecules can also be multiply labeled for multimodal applications, and a number of albumin and albumin derivatives have been constructed. In work from our lab, maleylated bovine serum albumin, a ligand for macrophage scavenger receptors, was labeled with Gd–DOTA and 64Cu–DOTA for PET and MR imaging of macrophages, which are markers for vascular inflammation. Albumin, compared with long polymers, offers 60 free amines for modification, so the degree of loading is less than can be achieved for typical polylysine chains. For recognition by scavenger receptors, some portion of these amines must be maleylated, and increasing amounts of maleyl groups improve uptake by cells, but some amines must be reserved for Gd– and 64Cu–DOTA labeling as well. A balance between maleylation sufficient for uptake and gadolinium content sufficient for contrast enhancement was achieved for 60% maleylation allowing up to 22 gadolinium and 2 copper ions per albumin molecule. Measured r1 ranged from 20 to 33 mM−1s−1 per gadolinium ion for 10–22 gadolinium ions per albumin. At greater than 15 gadolinium per albumin, there is not much change in relaxivity with increasing Gd–DOTA content. The increase in r1 compared with free Gd–DOTA is expected for immobilized chelates because macromolecule-bound gadolinium would be expected to have slower rotational tumbling time, which increases relaxivity.
In other reports, albumin labeled with Gd–DTPA, biotin, and rhodamine or fluorescein was synthesized to assess probe pharmacokinetics by MR and optical imaging before and after avidin chase (also by ICP-MS).277 This methodology has some potentially interesting implications for molecular imaging, and it has been proposed that in vivo avidin chase-mediated removal of nonspecifically bound probes could be used to improve the specificity of targeted contrast agents. The probes were injected intravenously to tumor models (C6-pTET-VEGF) with and without avidin chase to assess probe extravasation through the neovasculature and degree of transport due through the lymphatic system and interstitial convection. Initial injection accumulated rapidly in tumors through VEGF-permeabilized blood vessels (Figure 41a). Over time, the signal radiates outward (Figure 41c). Avidin chase significantly reduces signal in the blood vessels and in the tumor rim in a pattern that echoes the regions of high intensity immediately after injection (Figure 41b), and the avidin-bound probes clear through liver and spleen. Contrast agent that had already moved out of the blood vessels was not cleared by the avidin chase and interstitial convection continued to move contrast agent into perivascular tumor regions after the avidin chase (Figure 41d). Optical imaging was used to track the cellular localization of the contrast agent and histology revealed that free contrast material was found in kidney epithlial cytoplasmic granules while avidin complexed agent was found in the tubules. ICP-MS was used to quantitate gadolinium in tissues because MRI signal intensity did not always reveal probe localization; for example, liver and spleen probe accumulation was not observed by MRI, although they were confirmed by ICP-MS. These triply labeled probe studies illustrate how multimodality methods can be used for detailed probe or drug validation and pose an interesting tool for evaluating kinetics and specificity of molecular imaging probes.
Figure 41.
Use of triply labeled albumin to characterize probe extravasation into tumors: (a) contrast enhancement immediately after injection; (b) signal loss immediately after avidin chase; (c) convection map showing time when rate of probe accumulation was maximal; (d) map of accumulation (yellow-orange) and clearance (blues) after avidin chase. Reproduced with permission from ref 277. Copyright 2003 Wiley.
5. Small Molecule Multimodal Probes
Small molecule multimodal probes are perhaps the simplest in concept but can be the most difficult to synthesize (Table 6). In addition, it is challenging to achieve more than a 1:1 ratio of probe types in a small molecule, limiting probe utility to modalities of similar sensitivities. These drawbacks may account for the relative paucity of reports of multimodal small molecule agents compared with nanoparticulate agents. The aim is to fuse two or more imaging probes together directly, generally with minimal intervening bonds although some spacers may be necessary to preserve probe function. Unlike macromolecular or nanoparticle conjugates, this design maintains the small size of the parent probes and the individual probes dictate pharmacokinetic properties, rather than the macromolecule or nanoparticle they are bound to. Small molecule probes are typically cleared by the renal system while larger species (>5 nm) clear through the liver. This is an advantage for avoiding toxicity associated with long-term liver retention but can be disadvantageous if circulation times are very short. Small molecules have potential for more rapid diffusion through tissue; rapid diffusion may be attractive for in vivo applications.
Table 6.
| probes | Small Molecule | refs | |
|---|---|---|---|
| modalities | imaging properties | ||
| rhodamine and Gd–DOTA | MRI/optical | Gd(Rhoda–DOTA) = 1:1 Gd/rhoda; GRIP = 2:1 and 4:1 Gd/pdl, 2 rhoda/pdl; GRID = 9 DTPA/dextran, 9 TRITC/dextran); λem = 572 (λex = 547) | 54 |
| fluorescein and Gd–DOTA | MRI/optical | r1 = 4.82–5.36 mM−1s−1, r2 = 7.52–26.24 mM−1s−1 (7 T) | 278 |
| coumarin and Gd–DOTA | 19F MRI/optical | 19F MRI of phantoms; λex = 400 + photos | 272 |
| spiropyran and Gd–DOTA | MRI/optical/sensor | light switching r1 = 3.72/2.93 mM−1s−1 (1.5 T, 37 °C); 500ex/582em to no visible abs | 280 |
| NADH switching r1 = 2.51/1.86 mM−1s−1 (1.5 T, 37 °C); 500ex/603em to no visible abs | 281 | ||
| NADH switching r1 = 5.58/8.6 mM−1s−1 (1.5 T, 37 °C), q = 1.26/2.01, 460ex/539em to no visible abs | 279 | ||
| OregonGreen and Gd–DTPA | MRI/optical | r1 = 7.5 mM−1s−1, r2 = 8.3 mM−1s−1 (11.7 T, 298 K); OregonGreen 488ex | 79 |
| porphyrin and Mn TPPS | MRI/optical/therapy | Zn sensor 8.7/6.65 mM−1s−1 (4.7 T); λex = 418, λem = 3 peaks, 600–750 nm | 333 |
| 19F polyhedral oligomeric silsesquioxanes | 19F NMR/optical | 19F NMR spectra;); λem = 500 (λex = 350) | 334 |
| 99mTc–pam and IRDye800 | SPECT/optical | SPECT–CT imaging; λem = 800 (abs 781) | 286 |
| 64Cu–, 177Lu–, or 111In–DOTA and cypate | PET or SPECT/optical | biodistribution γ; λem = 816 (abs 793) | 274 |
| no radio, proof of principle; λem = 802–810 (abs 781–784) | 283 | ||
| 111In–DOTA and carbocyanine | SPECT/optical | biodistribution γ; λem = 805 (λex = 760, 780) | 282 |
| 111In–DTPA and IRDye800 | SPECT/optical | γ-scintigraphy; whole body optical 785ex | 284 |
| 124I–HPPH (porphyrin) | PET/optical/therapy | PET imaging; microscopy, whole body optical (540 ex) | 287 |
| 86Y or 111In(CHX-A″) and Cy5.5 | PET or SPECT and optical | 79% radiolabel efficiency; HPLC, MS confirm of dye | 285 |
The fusion of gadolinium chelates directly to fluorophores has been a popular construct. With the availability of reactive chelator derivatives the coupling of two types of probes reduces to basic conjugation chemistry. Work as early as 1998 reported fusing Gd–DOTA to rhodamine, which was synthesized through a paraaminobenzyl DOTA precursor reacted with TRITC.54 More recently, Gd–DO3A has been linked to fluorescein through an ethylthiourea linker (Figure 42).278 The molecule was synthesized from a DO3A precursor with an NH2-terminated arm, which was then reacted with FITC at pH 8, maintained by addition of 1 M sodium carbonate, for 18–20 h at room temperature and finally metalated by incubation with gadolinium chloride and purified by HPLC. If the reactive precursors are not commercially available, the de novo synthesis of the reactive precursors can be the most difficult phase of these syntheses.
Figure 42.
(a) Gd–DOTA–fluorescein pair. (b) DO3A precursor with NH2 terminated arm. Reproduced with permission from ref 278. Copyright 2006 American Chemical Society.
For example, in work from our group by Tu et al., fluorescent spiropyran and spirooxazine derivatives were attached to Gd–DO3A through multistep syntheses to generate activatable MRI probes.279–281 The spiropyran and spirooxazine groups isomerize in response to environmental factors, including light and reduction/oxidation by biological redox molecules. For example, the spirooxazine derivative responds to NADH and switches from r1 = 5.58 mM−1s−1 and q = 1.26 in the absence of NADH to r1 = 8.6 mM−1s−1 and q = 2.01 (1.5 T, 37 °C) in the presence of NADH. This effect is completely reversible upon addition of hydrogen peroxide. The molecule switches between two isomers. One isomer bears a “closed ring” structure, which undergoes a ring opening upon response to light or redox (Figure 43). This ring opening creates a series of conjugated double bonds in the molecule that affords optical properties (visible absorbance, fluorescence) that were absent in the closed ring isomer. In addition, we hypothesized that the ring-opened isomer would offer an additional coordination site to gadolinium, and this was supported by the measured hydration values. The reversibility of this effect poses exciting possibilities for dynamic sensing of the redox state of tissues.
Figure 43.
MRI/optical probe reversibly activated by NADH. Reproduced with permission from ref 279. Copyright 2009 Wiley-VCH Verlag GmbH & Co. KGaA.
A drawback of MRI/optical small molecule fusions is that the sensitivity for MRI is typically much lower than that for optical methods; thus more MRI probe is required to produce an effect. If the MRI and optical probes are present in equimolar ratios, as they are in a fused molecule, there is generally excessive fluorophore compared with the need. For in vivo applications, the difference is not as great because sensitivity is lower for in vivo optical methods compared with microscopy. The fusion of radioisotopes with fluorophores represents a more logical combination because the radiotracer and optical imaging methods have sensitivities in the same range. Chelated radioisotopes have been fused to fluorophores by a variety of methods. For example, DOTA was coupled to cypate (a dye similar to indocyanine green) through hexanediamine in a solution-based synthesis (Figure 44a) or through a peptidyl unit by solid-phase methods (Figure 44b), as illustrated in accompanying figures, and radio-labeling was by incubation of 111In in 25 mM NaOAc and 12.5 mM sodium ascorbate buffer, pH 9, at 80 °C.282,283 Derivatives of these molecules carrying 64Cu (PET) or 177Lu (SPECT) instead of 111In were applied for molecular imaging of somatostatin receptors by coupling the probes to somatostatin receptor binding peptides (Y3-octotreate of Y3-TATE).274 Both ions also offer therapeutic potentials.
Figure 44.
Conjugation of DOTA to cypate: (a) solution-phase coupling of DOTA to cypate through hexanediamine and 111In-labeled derivatives of cypate; (b) solid-phase synthesis of cypate–DOTA linked through lysine. Reproduced with permission from ref 282. Copyright 2005 American Chemical Society.
Solid-phase methods have also been applied to couple 111In–DTPA to IRDye800 through a lysine using a succi-namidobenzyl derivative of DTPA.284,111 In–DTPA was incorporated during solid-phase synthesis of a targeting cyclic peptide coupled to a residual lysine. The 111In–DTPA was attached through the residual lysine, and this lysine was reacted with IRDye800 to form to the multimodal probe. Lysine has also been used as a link between Cy5.5 and 111In–CHX-A″ in a multistep synthesis as shown (Figure 45).285 A similar lysine linkage approach is used to connect IRDye800 and Pam–99mTc (Figure 46).286
Figure 45.
Synthesis of Cy5.5-labeled chelate, Cy5.5–Lys(SMCC)–CHX-A″. Reproduced with permission from ref 285. Copyright 2007 American Chemical Society.
Figure 46.
Synthesis of IRDye800 linked to Pam–99mTc. Reagents and conditions: (a) IRDye800CW–NHS, DIEA, DMSO, rt, 2 h, 89%; (b) Me-Pam, HCTU, NMM, DMSO, rt, 0.5 h, 78%; (c) 95% TFA, rt, 2.5 h, 97%; (d) Me3SiBr, DMF, rt, 12 h, and MeOH/H2O (4:1), rt, 0.5 h, 95%; (e) 99mTc/Re-MAS3-NHS, TEA, DMSO, rt, 1 h, 83%. Reproduced with permission from ref 286. Copryight 2008 American Chemical Society.
A simpler method to introduce a radioisotope to a fluorophore is to iodinate the fluorophore directly using radioactive iodine. This has been employed to iodinate the photosensitizer HPPH (3-(1′-m-hexyloxyethyl)-3-devinylpy-ropheophorbide-α using commercial Iodogen beads and Na124I.287 It was proposed that this construct could be used for PET and fluorescence imaging, as well as photodynamic therapy.
6. Genetic Programming
While exogenous probes can be used to introduce contrast to a system that lacks innate contrast, an alternative is to modify the cellular target to manufacture its own probes. Foreign genetic material encoding for a protein product that is detectable by imaging is introduced to a cell, that is, transfected; and the cell’s own translational machinery uses this genetic template to manufacture the protein. This is an elegant approach on the surface, because the target produces its own beacons for identification, seemingly without having to worry about the pharmacokinetics of probe clearance that must be introduced exogenously. The procedure is still invasive, in that exogenous genes need to be placed into the cells, but has more similarities with exogenous labeling of cells prior to introduction to an in vivo system, as opposed to systemic injection of probes that then need to find a target. The details of reporter gene construction and design are a bit outside the scope of this review but will be briefly described as a point of comparison to work on exogenous imaging probes that is the focus of this review. Because it is helpful to understand the historical context for how the newest generation of multimodality reporter genes came about, key developments preceding 2005 that lay the foundation for these newest probes are briefly summarized here. Reporter genes for optical and PET imaging have been investigated for some time and include green fluorescent protein (GFP) for fluorescence microscopy, luciferase (luc) for bioluminescence imaging, and herpes simplex virus type I thymidine kinase (HSV1-tk). The literature for optical reporters, which have a longer history, is much more extensive and the applications wider. More recently multimodality reporter constructs have emerged that typically consist of multiple genes that are linked for coexpression by a variety of methods.288,289 The newer multimodality probes are built upon a vast foundation of research in molecular biology that uses combinations of genes.
A popular approach to linking separate genes is to combine multiple genes as a single fusion gene construct, which then expresses a fusion protein product with multiple subunits that each retain the functionality of the single-mode reporter genes (Figure 47). The technology for producing fusion proteins has a long history in molecular biology, and fusion proteins with green fluorescent protein as reporter were developed in the mid-1990s, soon after the protein was cloned.290 The GFP gene and the gene of the protein of interest are placed in tandem on a vector (a DNA sequence carrying the necessary information for incorporation/expression by the cell) under the control of the same promoter (a sequence that dictates expression levels). Green fluorescent protein and luciferase fusions soon followed as a method for studying interactions at the protein level.291 The reporters could be fused to opposite ends of the same protein, and optical imaging used to monitor the loss of fluorescence energy transfer between the two luminescent proteins by cleavage of the intervening sequence,291 or each reporter could be fused to a different putative binding partner and FRET used to observe protein–protein interactions.292 These dual reporter systems were designed primarily for optical imaging.
Figure 47.
Multimodal reporter gene. Gene construct contains reporter genes for both luminescent (GFP) and radiotracer (thymidine kinase) imaging methodologies. The optical reporter gene produces a fluorescent protein product. The PET reporter gene produces a thymidine kinase that phosphorylates nucleoside analogs, which are then retained in cells. Reproduced with permission from ref 300. Copyright 2004 American Association for Cancer Research.
Other pairs of genes soon followed as reporters with dual functionality. Fusions of green fluorescent protein and herpes simplex virus thymidine kinase (HSV-TK) have been reported for a number of applications.293,294 The GFP is used for identification, and the HSV-TK lends drug sensitivity or image contrast. HSV-TK as a suicide gene has been widely studied up to the level of clinical trials for gene therapy.295 For example, in treatment with prodrug, such as ganciclovir, the drug is phosphorylated by the HSV-TK and subsequently further phosphorylated by endogenous kinases to a toxic triphosphate form that terminates DNA elongation. This is of use where “suicide” control over cell proliferation is needed, such as when engineered cells that are grafted into a patient sport negative behavior and need to be terminated or for tumor obliteration. Using the same biochemical principles, HSV-TK functionality in GFP–HSV-TK fusions also can be used for imaging.296,297 Radioactive nucleoside analogs are actively transported into cells, are phosphorylated by the kinase, are unable to diffuse across the plasma membrane, and thus, accumulate in the cell where they can be detected by PET. The analogs are typically 124I- or 131I-labeled 2′-fluoro-2′-deoxy-1-β-D-arabinofuranosyl-5-iodoracil (FIAU), 18F-labeled 9-[4-fluoro-3-(hydroxymethyl)butyl]guanine (FHBG), or 18F-labeled 9-[3-fluoro-1-hydroxy-2-propoxymethyl]guanine (FHPG). HSV-TK can be fused to other optical reporters and constructs of luciferase, whith have also been reported.298 These studies using combinations of two reporters have laid the foundation for the newer generations of triple-reporter constructs for multimodal imaging.
By extension, it is logical to envision a triple-modality reporter construct that is an amalgam of the above pairs, and a large body of work has emerged for a triple-modality GFP–luciferase–HSV-TK triple reporters. While the first descriptions for this reporter construct were prior to the 2005 cutoff for this review,299,300 they are still actively employed in ongoing investigations particularly for labeling and observation of tumor cells,301,302 and they have been used to monitor promoter activity.303 However, fusion reporters are not without their limitations: it is quite common for a subunit in a fusion product to be inferior in performance to the freestanding protein. This can be due to a number of factors such as reduced expression levels as part of a fusion vector or reduced functional activity of the protein product. Investigators have noted reduced sensitivity for the triple reporter compared with the single reporter constructs. While kinase activity can be relatively high, there are problems with maintaining high luciferase and GFP activity; therefore, recent studies have focused on improving performance by using different combinations of reporter genes because there are many choices of genes for each of the modalities.304,305 One approach is to mutate each gene to improve individual performance and use the altered gene in a new triple reporter, where performance is defined by luminescence intensity or enzyme activity, which can stem from protein structure or expression level. By this method, a triple fusion reporter of GFP–luc–HSV-TK was constructed from (1) the luciferase gene mtfl, a mutant form of the previously used thermostable firefly luciferase gene (tfl), engineered for improved cytoplasmic localization and access to substrate, (2) mrfp1, which encodes a red fluorescent protein of high expression level in the triple fusion, and (3) wttk, a truncated version of the wild-type HSV-TK gene with higher expression levels than the mutant used in previous constructs.304 The previous construct had high kinase activity but only moderate activity for the optical components. The final triple reporter was tested in tumor-bearing mice and found to indeed have improved luciferase activity (~30%), and GFP fluorescence was qualitatively determined to be improved based on higher intensity for cells transfected with the new reporter.
In similar fashion Kesarwala et al. set out to devise a combination of reporters with improved performance. They noted that fusing the three genes one immediately after the other consistently compromised the performance of at least one product, particularly the kinase. Therefore, they generated a new triple fusion construct in which the luciferase and kinase genes were fused in frame (N terminus of one directly to C terminus of the other), and the GFP gene was added after an inserted internal ribosome entry site (IRES). To explain, in the cycle from DNA to RNA to protein, the first step after unwinding of the DNA is for an RNA polymerase to bind to the DNA to generate mRNA (mRNA); the polymerase binds to a specific sequence called a promoter. The promoter determines the expression level of mRNA; a strong promoter can cause hundreds of thousands of copies to be made. After further modification of the RNA, ribosomes bind to the RNA before the start codon and initiate translation to protein. Ribosomes are like the babelfish of gene expression, they read along the mRNA sequence and direct the stitching together of amino acids to form proteins. But when multiple genes are fused together under the control of the same promoter, the process can lose efficiency. Therefore IRES technology was developed. An IRES is a genetic sequence that allows a ribosome to bind in the middle of an mRNA sequence. In the Kersarwala paper, it was used to somewhat isolate the GFP gene from the upstream elements and produce it in tandem, but as a separate product. They believe this improved performance by preventing interference with key amino acids near the C terminus of the kinase gene that can occur when another gene is fused downstream.
The GFP–luc–HSV-TK construct has received the most attention in the literature, but the presence of two reporters for optical imaging seems redundant. While chemiluminescence and fluorescence are different mechanisms for producing photons, the product nevertheless is emission of light. The argument in the literature is that GFP is quite good for subcellular resolution in microscopy, but is not very useful for whole body imaging because the requirement for excitation and emission means there are two major sources of losses for photons in the journey to produce signal output. Scattering, absorbance by blood, and autofluorescence from tissue are major challenges for photon detection. Autofluorescence stems from endogenous tissue fluorophores (e.g., flavins, porphyrins, collagen, elastin) and is strong at UV excitation wavelengths with emission primarily in the blue and green; thus longer wavelengths are desired if signal is to be readily differentiated from background.
When only variants of GFP were available, which tend to excite in the 390 nm range and emit in the 500 nm range, scattering and autofluorescence were of particular concern because this overlaps with significant tissue autofluorescence. With the current paint box of fluorescent proteins, however, much longer wavelength excitation and emission pairs are possible, such as with mPlum (590/649) and mRasberry (598/625); these are less subject to scattering and overlap with tissue autofluorescence.306
Luciferin/luciferase exists in variants that range in emission up to 560 nm.307 As a chemiluminescent process, these do not require excitation; however if the gene for the enzyme is the reporter, the substrate must somehow also be introduced to tissue and available equally to all regions of interest. This is nontrivial and not always quantitatively demonstrated in the literature. Luciferin/luciferase can also be much weaker in photon yield compared with fluorescent processes and are sensitive to environmental influences that affect the rates of enzyme kinetics. As an imaging method, whole body bioluminescence imaging produces images on an order of resolution and sensitivity that are not as good as PET, which again calls into question the need for a bioluminescence reporter if a fluorescent reporter is already part of the package. Bioluminescence is cited by most authors as advantageous for quick screening without involved radiochemistry to verify gene expression but the fluorescent protein can support this as well.
Neither type of optical reporter is applicable for use in deep tissues, and introduction of foreign genes to humans has yet to gain public acceptance, so the constructs discussed here are mainly of use for preclinical studies in small animals. In addition to background from autofluorescence, at visible wavelengths absorbance from blood is an issue up to 650 nm, so for clinical imaging near-IR probes are desirable.308 Challenges for in vivo optical imaging are summarized nicely in a succinct review in Gene Therapy, and we refer the reader there for additional information.309
One novel application takes advantage of the attenuated activity in fusion proteins (making lemonade out of lemons, so to speak) to construct a caspase-3 sensor.310 In this design, the three reporters (GFP, luc, HSV-TK) are connected by peptide linkers containing a cleavage site for caspase-3. In the presence of the enzyme, the three subunits are separated, and increased activity/performance is noted for each. The ability to use this as an absolute sensor for caspase in biological systems is impaired by the requirement for a standard to which one can compare this increase in signal. It would perhaps have been better to have one element, most logically the kinase, retain the same activity so that this could be the anchor signal against which to compare the increases. In this way, the PET signal can be quantitated to determine the amount of probe present, and actual increases in fluorescence and bioluminescence could be noted against what is expected for the given quantity of probes in the absence of caspase.
Why fusion proteins? Given the reduced performance observed in the triple fusion, one might question whether a triple fusion is needed. If optimal performance is desired, one could instead use separate promoters for each gene, or put each gene on a different vector. However, it can be difficult to generate a construct with multiple promoters and reporters because the sequences become too unwieldy and large to carry on a single vector. Separate vectors can be a good option if there is no critical need for the same amount of each gene product to be expressed and has the advantage of being able to use appropriate “strength” promoters to produce the three reporters in desirable stoichiometry. Given the differing sensitivities for the imaging modalities, it seems unnecessary to produce the products at the same concentrations, but there may be need to “guarantee” that each reporter is found in the same location. The disadvantage of the multiple vector scheme is that once the protein is made each can migrate independently and over time may leave the labeled cell, or be degraded at different rates. Earlier it was noted that gene therapy is often touted as advantageous over the injection of exogenous probes because the probes produce probes from the inside out as it were. But unless cells are labeled exogenously then introduced in vivo to home to target tissues, the cells must be transfected in vivo, which is challenging. For tracking of ex vivo labeled cells, however, the genetic programming route has some clear advantages, if the introduced genes are stably integrated to the cell’s genome, by which means most importantly a lack of dilution is seen as the cells divide, a challenge that plagues cells labeled with exogenous probes.
As a final note, genetic methods have also been used in conjunction with exogenous probes to label cells for multimodal imaging. Recent examples include transduction of MCF-7 breast cancer cells to express a red fluorescent protein–human type II transmembrane protein chimera that localized to the plasma membrane of the cells. Superparamagnetic iron oxide nanoparticles (SPIO) were then bound to the cells by associating biotinylated anti-RFP antibodies to the cells and then allowing these to couple to avidin-modified SPIO.311 In another example, human endothelial progenitor cells (HEPCs) (from umbilical cord) were transfected with vectors carrying human sodium iodide symporter (NIS) and were found to stably express the NIS protein on their surfaces. The cells were labeled for SPECT and for MRI by incubation with Resovist in the presence of Lipfectin. After injection of the cells to the anterolateral wall of the left ventricle in nude rats, 124I iodide was introduced by tail vein injection to label the cells for PET.312 These combinations of genetic and exogenous probe methods illustrate the flexibility with which multimodality contrast can be achieved.
7. New Territories
We highlight here a few concepts that would lend themselves well to multimodality approaches but have not yet been pursued fully.
7.1. Caged Complexes
The idea of using inert materials as carrier extends to the use of biological or man-made hollow structures as vessels to hold multiple types of contrast agents. Ferritin313 and viral capsids,314,315 for example, have been explored as carriers for MRI probes, and it is a logical extension to consider encapsulating other probe types as well. While loading the interiors of these types of hollow containers is an obvious choice, there are many other methods by which to load cages, such as these, with probes. Because the possibilities are intriguing but there are no published reports for multimodal imaging probes based on cages, we direct the reader to recent reviews that highlight the future potential offered by biological containers and cages for nanotechnology.316–318
7.2. Imaging and Therapy
Just as multiple species of imaging probes can be combined in a single probe, molecules with therapeutic function can be incorporated thus yielding probes with combined therapeutic and diagnostic function. The goal of using imaging as a tool to guide or monitor therapy, coined “theragnostics”, has received a great deal of recent interest. This has spawned a number of reviews in the literature and we direct the reader to these references for additional information.14,19,82,319–324
8. Concluding Remarks
As recently as 10 years ago, in the “dark ages” of multimodal imaging, imagers tended to be “modalicentric” and convinced that their technology was the best approach to all problems; many failed to see the benefit of combining imaging modalities. Since that time there has been a surge of interest in combining modalities, both as instruments and in probes. However, the clinical utility for multimodal probes has yet to be established. Indeed, not all applications will benefit from an all-in-one probe. Identifying the diagnostic and therapeutic targets that have the most to gain from common probe technology is a challenge for today and the future that will aid in increasing the acceptance for multimodal imaging probes. As evident in many works including in this review, the continued collaboration between chemists, biologists, and clinicians is particularly critical to adapting often biologically incompatible probes with outstanding imaging properties for realistic uses. This highlights a common occurrence for reports of new multimodal materials; many do not seem to involve collaborations with imagers or clinicians to characterize the clinically relevant capabilities of the probes. Greater cross communication, multimodal cross communication as it were, will be crucial to new probe development particularly for novel nanotechnology platforms.
In a recent minireview, it was posed that multimodality probes could go the way of amphibian cars, that is, by putting both features in the same vehicle you get something that is not as fast as a car on the road or a speedboat on the water, but somewhat acceptable being able to both drive on roads and float.325 A specific MRI/PET probe based on 64Cu-labeled iron oxides is given as an example wherein the labeled nanoparticles require a higher injected dose per gram and result in higher liver uptake compared with 64Cu-labeled peptides. While the logic is a bit misguided, because it is the nanoparticle platform more than the concept of multimodality that is primarily to blame for the changes in pharmacokinetics, it does highlight a point that the great differences in sensitivities between some modalities, like PET and MRI, mean that multimodal probes optimized for both will require a large number of low-sensitivity probes that will increase probe size compared with the stand alone high sensitivity probe. Or the probes may really consist of a mixture of entities that are “truly” multimodal, bearing both PET and MRI moieties, and an excess of MRI only probes, in order to satisfy the concentration requirements for each modality in its ideal range. The key considerations are whether the multimodal version is similar enough to the solo so that they traffic the same way in the body or whether it is just not possible to make solo agents that are similar enough that a co-injection would give the same information. Ideally, fusing probes of various functions would not reduce each probe’s individual effectiveness, and this is where the platform or carrier can be a large influencing factor. Ultimately, there are applications where only an amphibian car will do, you do not build an amphibian car to race in the Indy500, for example, but there may be no better way to do a land–sea tour. Multimodality imaging and multimodality probes need to find their own “duck boat tour” niche to secure their place in imaging lexicon. For now, the vastness of literature describing methods to generate multimodal probes provides a rich learning ground that helps the research community to better understand how to build these types of constructs and contributes ongoing lessons in nanotechnology and probe design.
Acknowledgments
Thank you to my dedicated group, Ben Jarrett, Chuqiao Tu, Erica Andreozzi, Heather Palko, Elizabeth Osborne, and Ray Wong, for their help and support. Continuing thanks to the NIH for their support of my research program now (NIBIB) and in years past (NHLBI, NEI), and to the Whitaker Foundation and American Heart Association for new faculty awards that came in the critical early stages of my career.
Biography
 Angelique Y. Louie received the B.S. degree from the University of California, Davis, and the M.S. degree from the University of California, Los Angeles, both in electrical engineering. She received the Ph.D. degree in biological sciences from the University of California, Irvine. She held a Postdoctoral Fellowship at the California Institute of Technology, Pasadena. She is currently an Associate Professor and Vice Chair in the Department of Biomedical Engineering, University of California, Davis. Her research focuses on the development of multimodal probes for molecular imaging. Recent work from her lab describes paramagnetic quantum dots, dual-mode agents to visualize atherosclerosis, light- and redox-activatable MRI agents, and nontoxic silicon nanoparticles for MR/optical imaging. Dr. Louie is a member of Tau Beta Pi, the International Society for Magnetic Resonance in Medicine, the Biomedical Engineering Society, the Society of Women Engineers, and the Society for Molecular Imaging.
References
- 1.Townsend DW, Beyer T, Blodgett TM. Semin Nucl Med. 2003;33:193. doi: 10.1053/snuc.2003.127314. [DOI] [PubMed] [Google Scholar]
- 2.Molecular Imaging in Oncology. 1. Informa Healthcare; New York: 2008. [Google Scholar]
- 3.Ell PJ. Br J Radiol. 2006;79:32. doi: 10.1259/bjr/18454286. [DOI] [PubMed] [Google Scholar]
- 4.Tsukamoto E, Ochi S. Ann Nucl Med. 2006;20:255. doi: 10.1007/BF02984642. [DOI] [PubMed] [Google Scholar]
- 5.Cherry SR, Louie AY, Jacobs RE. Proc IEEE. 2008;96:416. [Google Scholar]
- 6.Schlemmer H, Pichler B, Wienhard K, Schmand M, Nahamias C, Townsend D, Heiss W, Claussen C. J Nucl Med. 2007;48:45P. [Google Scholar]
- 7.McCarthy JR, Patel P, Botnaru I, Haghayeghi P, Weissleder R, Jaffer FA. Bioconjugate Chem. 2009;20:1251. doi: 10.1021/bc9001163. [DOI] [PMC free article] [PubMed] [Google Scholar]
- 8.Mulder WJM, Strijkers GJ, van Tilborg GAF, Griffioen AW, Nicolay K. NMR Biomed. 2006;19:142. doi: 10.1002/nbm.1011. [DOI] [PubMed] [Google Scholar]
- 9.Tallury P, Payton K, Santra S. Nanomedicine. 2008;3:579. doi: 10.2217/17435889.3.4.579. [DOI] [PubMed] [Google Scholar]
- 10.Cai WB, Chen XY. J Nucl Med. 2008;49:113S. doi: 10.2967/jnumed.107.045922. [DOI] [PubMed] [Google Scholar]
- 11.Jennings LE, Long NJ. Chem Commun. 2009:3511. doi: 10.1039/b821903f. [DOI] [PubMed] [Google Scholar]
- 12.Lee S, Chen XY. Mol Imaging. 2009;8:87. [PubMed] [Google Scholar]
- 13.Frullano L, Meade TJ. J Biol Inorg Chem. 2007;12:939. doi: 10.1007/s00775-007-0265-3. [DOI] [PubMed] [Google Scholar]
- 14.Kim J, Piao Y, Hyeon T. Chem Soc Rev. 2009;38:372. doi: 10.1039/b709883a. [DOI] [PubMed] [Google Scholar]
- 15.Cheon J, Lee JH. Acc Chem Res. 2008;41:1630. doi: 10.1021/ar800045c. [DOI] [PubMed] [Google Scholar]
- 16.Park K, Lee S, Kang E, Kim K, Choi K, Kwon IC. Adv Funct Mater. 2009;19:1553. [Google Scholar]
- 17.Mulder WJ, Griffioen AW, Strijkers GJ, Cormode DP, Nicolay K, Fayad ZA. Nanomedicine. 2007;2:307. doi: 10.2217/17435889.2.3.307. [DOI] [PubMed] [Google Scholar]
- 18.Jarrett BR, Gustafsson B, Kukis DL, Louie AY. Bioconjugate Chem. 2008;19:1496. doi: 10.1021/bc800108v. [DOI] [PMC free article] [PubMed] [Google Scholar]
- 19.Al-Jamal W, Kostarelos K. Nanomedicine. 2007;2:85. doi: 10.2217/17435889.2.1.85. [DOI] [PubMed] [Google Scholar]
- 20.Glickson JD, Lund-Katz S, Zhou R, Choi H, Chen IW, Li H, Corbin I, Popov AV, Cao WG, Song LP, Qi CZ, Marotta D, Nelson DS, Chen J, Chance B, Zheng G. Mol Imaging. 2008;7:101. [PubMed] [Google Scholar]
- 21.Kaneda MM, Caruthers S, Lanza GM, Wickline SA. Ann Biomed Eng. 2009;37(10):1922–1933. doi: 10.1007/s10439-009-9643-z. [DOI] [PMC free article] [PubMed] [Google Scholar]
- 22.Hughes M, Caruthers S, Tran T, Marsh J, Wallace K, Cyrus T, Partlow K, Scott M, Lijowski M, Neubauer A, Winter P, Hu G, Zhang H, McCarthy J, Maurizi B, Allen J, Caradine C, Neumann R, Arbeit J, Lanza G, Wickline S. Proc IEEE. 2008;96:397. [Google Scholar]
- 23.Mulder WJ, Strijkers GJ, van Tilborg GA, Cormode DP, Fayad ZA, Nicolay K. Acc Chem Res. 2009;42:904. doi: 10.1021/ar800223c. [DOI] [PMC free article] [PubMed] [Google Scholar]
- 24.New R. Liposomes: A Practical Approach. Oxford University Press; New York: 1997. [Google Scholar]
- 25.Zheng JZ, Liu JB, Dunne M, Jaffray DA, Allen C. Pharm Res. 2007;24:1193. doi: 10.1007/s11095-006-9220-1. [DOI] [PubMed] [Google Scholar]
- 26.Zheng JZ, Perkins G, Kirilova A, Allen C, Jaffray DA. Invest Radiol. 2006;41:339. doi: 10.1097/01.rli.0000186568.50265.64. [DOI] [PubMed] [Google Scholar]
- 27.Lonez C, Vandenbranden M, Ruysschaert JM. Prog Lipid Res. 2008;47:340. doi: 10.1016/j.plipres.2008.03.002. [DOI] [PubMed] [Google Scholar]
- 28.Mikhaylova M, Stasinopoulos I, Kato Y, Artemov D, Bhujwalla ZM. Cancer Gene Ther. 2009;16:217. doi: 10.1038/cgt.2008.79. [DOI] [PMC free article] [PubMed] [Google Scholar]
- 29.Iyer AK, Khaled G, Fang J, Maeda H. Drug Discovery Today. 2006;11:812. doi: 10.1016/j.drudis.2006.07.005. [DOI] [PubMed] [Google Scholar]
- 30.Maeda H, Greish K, Fang J. In: Polymer Therapeutics II: Polymers as Drugs, Conjugates and Gene Delivery Systems. Satchi-Fainaro R, Duncan R, editors. Vol. 193. Springer; Berlin: 2006. [DOI] [PubMed] [Google Scholar]
- 31.Meyer KL, Carvlin MJ, Mukherji B, Sloviter HA, Joseph PM. Invest Radiol. 1992;27:620. doi: 10.1097/00004424-199208000-00012. [DOI] [PubMed] [Google Scholar]
- 32.Fan XB, River JN, Muresan AS, Popescu C, Zamora M, Culp RM, Karczmar GS. Phys Med Biol. 2006;51:211. doi: 10.1088/0031-9155/51/2/002. [DOI] [PubMed] [Google Scholar]
- 33.Gong B, Gill M, Washburn DB, Davenport WC, Adams D, Kwock L. Magn Reson Imaging. 1991;9:101. doi: 10.1016/0730-725x(91)90103-s. [DOI] [PubMed] [Google Scholar]
- 34.Pisani E, Tsapis N, Galaz B, Santin M, Berti R, Taulier N, Kurtisovski E, Lucidarme O, Ourevitch M, Doan BT, Beloeil JC, Gillet B, Urbach W, Bridal SL, Fattal E. Adv Funct Mater. 2008;18:2963. [Google Scholar]
- 35.Pisani E, Tsapis N, Paris J, Nicolas V, Cattel L, Fattal E. Langmuir. 2006;22:4397. doi: 10.1021/la0601455. [DOI] [PubMed] [Google Scholar]
- 36.Janjic JM, Srinivas M, Kadayakkara DKK, Ahrens ET. J Am Chem Soc. 2008;130:2832. doi: 10.1021/ja077388j. [DOI] [PubMed] [Google Scholar]
- 37.Caruthers SD, Neubauer AM, Hockett FD, Lamerichs R, Winter PM, Scott MJ, Gaffney PJ, Wickline SA, Lanza GM. Invest Radiol. 2006;41:305. doi: 10.1097/01.rli.0000199281.60135.6a. [DOI] [PubMed] [Google Scholar]
- 38.Lee H, Price RR, Holburn GE, Partain CL, Adams MD, Cacheris WP. J Magn Reson Imaging. 1994;4:609. doi: 10.1002/jmri.1880040416. [DOI] [PubMed] [Google Scholar]
- 39.Pfannkuch F, Schnoy N. Anaesthesist. 1979;28:511. [PubMed] [Google Scholar]
- 40.Schnoy N, Pfannkuch F, Beisbarth H. Anaesthesist. 1979;28:503. [PubMed] [Google Scholar]
- 41.Hak S, Sanders HMHF, Agrawal P, Langereis S, Grüll H, Keizer HM, Arena F, Terreno E, Strijkers GJ, Nicolay K. Eur J Pharm Biopharm. 2009;72:397. doi: 10.1016/j.ejpb.2008.09.017. [DOI] [PubMed] [Google Scholar]
- 42.Elrod DB, Partha R, Danila D, Casscells SW, Conyers JL. Nanomed: Nanotechnol, Biol Med. 2009;5:42. doi: 10.1016/j.nano.2008.06.007. [DOI] [PubMed] [Google Scholar]
- 43.Kamaly N, Kalber T, Ahmad A, Oliver MH, So PW, Herlihy AH, Bell JD, Jorgensen MR, Miller AD. Bioconjugate Chem. 2008;19:118. doi: 10.1021/bc7001715. [DOI] [PubMed] [Google Scholar]
- 44.Vuu K, Xie JW, McDonald MA, Bernardo M, Hunter F, Zhang YT, Li K, Bednarski M, Guccione S. Bioconjugate Chem. 2005;16:995. doi: 10.1021/bc050085z. [DOI] [PubMed] [Google Scholar]
- 45.Vucic E, Sanders H, Arena F, Terreno E, Aimo S, Nicolay K, Leupold E, Dathe M, Sommerdijk N, Fayad ZA, Mulder WJM. J Am Chem Soc. 2009;131:406. doi: 10.1021/ja808310u. [DOI] [PMC free article] [PubMed] [Google Scholar]
- 46.Mulder J, Strijkers G, Griffioen A, Molema G, Storm G, Koning G, Nicolay K. Bioconjugate Chem. 2004;15:799. doi: 10.1021/bc049949r. [DOI] [PubMed] [Google Scholar]
- 47.Oliver M, Ahmad A, Kamaly N, Perouzel E, Caussin A, Keller M, Herlihy A, Bell J, Miller AD, Jorgensen MR. Org Biomol Chem. 2006;4:3489. doi: 10.1039/b605394g. [DOI] [PubMed] [Google Scholar]
- 48.Jasanada F, Nepveu F. Tetrahedron Lett. 1992;33:5745. [Google Scholar]
- 49.Storrs RW, Tropper FD, Li HY, Song CK, Kuniyoshi JK, Sipkins DA, Li KCP, Bednarski MD. J Am Chem Soc. 1995;117:7301. doi: 10.1002/jmri.1880050617. [DOI] [PubMed] [Google Scholar]
- 50.Zielhuis SW. Cancer Biother Radiopharm. 2006;21:520. doi: 10.1089/cbr.2006.21.520. [DOI] [PubMed] [Google Scholar]
- 51.Gopalakrishnan G, Danelon C, Izewska P, Prummer M, Bolinger PY, Geissbuhler I, Demurtas D, Dubochet J, Vogel H. Angew Chem, Int Ed. 2006;45:5478. doi: 10.1002/anie.200600545. [DOI] [PubMed] [Google Scholar]
- 52.Nijsen JFW, Zonnenberg BA, Woittiez JRW, Rook DW, Swildensvan Woudenberg IA, van Rijk PP, Schip ADV. Eur J Nucl Med. 1999;26:699. doi: 10.1007/s002590050440. [DOI] [PubMed] [Google Scholar]
- 53.Terreno E, Crich SG, Belfiore S, Biancone L, Cabella C, Esposito G, Manazza AD, Aime S. Magn Reson Med. 2006;55:491. doi: 10.1002/mrm.20793. [DOI] [PubMed] [Google Scholar]
- 54.Huber MM, Staubli AB, Kustedjo K, Gray MHB, Shih J, Fraser SE, Jacobs RE, Meade TJ. Bioconjugate Chem. 1998;9:242. doi: 10.1021/bc970153k. [DOI] [PubMed] [Google Scholar]
- 55.Lanza G, Lorenz C, Fischer S, Scott M, Cacheris W, Kaufmann R, Gaffney P, Wickline S. Acad Radiol. 1998;5:S1173. doi: 10.1016/s1076-6332(98)80097-4. [DOI] [PubMed] [Google Scholar]
- 56.Yu X, Song SK, Chen JJ, Scott MJ, Fuhrhop RJ, Hall CS, Gaffney PJ, Wickline SA, Lanza GM. Magn Reson Med. 2000;44:867. doi: 10.1002/1522-2594(200012)44:6<867::aid-mrm7>3.0.co;2-p. [DOI] [PubMed] [Google Scholar]
- 57.Lijowski M, Caruthers S, Hu G, Zhang HY, Scott MJ, Williams T, Erpelding T, Schmieder AH, Kiefer G, Gulyas G, Athey PS, Gaffney PJ, Wickline SA, Lanza GM. Invest Radiol. 2009;44:15. doi: 10.1097/RLI.0b013e31818935eb. [DOI] [PMC free article] [PubMed] [Google Scholar]
- 58.Cormode DP, Skajaa T, van Schooneveld MM, Koole R, Jarzyna P, Lobatto ME, Calcagno C, Barazza A, Gordon RE, Zanzonico P, Fisher EA, Fayad ZA, Mulder WJM. Nano Lett. 2008;8:3715. doi: 10.1021/nl801958b. [DOI] [PMC free article] [PubMed] [Google Scholar]
- 59.Chapman MJ. Curr Med Res Opin. 2005;21:S17. doi: 10.1185/030079905X59111. [DOI] [PubMed] [Google Scholar]
- 60.Nakajima T, Origuchi N, Matsunaga T, Kawai S, Hokari S, Nakamura H, Inoue I, Katayama S, Nagata A, Komoda T. Ann Clin Biochem. 2000;37:179. doi: 10.1258/0004563001899186. [DOI] [PubMed] [Google Scholar]
- 61.Graham DL, Oram JF. J Biol Chem. 1987;262:7439. [PubMed] [Google Scholar]
- 62.Bruchez M, Moronne M, Gin P, Weiss S, Alivisatos AP. Science. 1998;281:2013. doi: 10.1126/science.281.5385.2013. [DOI] [PubMed] [Google Scholar]
- 63.Chan WCW, Nie SM. Science. 1998;281:2016. doi: 10.1126/science.281.5385.2016. [DOI] [PubMed] [Google Scholar]
- 64.Wu XY, Liu HJ, Liu JQ, Haley KN, Treadway JA, Larson JP, Ge NF, Peale F, Bruchez MP. Nat Biotechnol. 2003;21:452. doi: 10.1038/nbt764. [DOI] [PubMed] [Google Scholar]
- 65.Dubertret B, Skourides P, Norris DJ, Noireaux V, Brivanlou AH, Libchaber A. Science. 2002;298:1759. doi: 10.1126/science.1077194. [DOI] [PubMed] [Google Scholar]
- 66.Jaiswal JK, Mattoussi H, Mauro JM, Simon SM. Nat Biotechnol. 2003;21:47. doi: 10.1038/nbt767. [DOI] [PubMed] [Google Scholar]
- 67.Hermanson G. Bioconjugate Techniques. Academic Press; San Diego, CA and London, U.K: 2008. [Google Scholar]
- 68.Crosslinking Reagents Tech Handbook (1601674) C11. ThermoScientific Pierce; 2009. available from technical resources at www.piercenet.com. [Google Scholar]
- 69.Cai WB, Chen K, Li ZB, Gambhir SS, Chen XY. J Nucl Med. 2007;48:1862. doi: 10.2967/jnumed.107.043216. [DOI] [PubMed] [Google Scholar]
- 70.Schipper ML, Cheng Z, Lee SW, Bentolila LA, Iyer G, Rao JH, Chen XY, Wul AM, Weiss S, Gambhir SS. J Nucl Med. 2007;48:1511. doi: 10.2967/jnumed.107.040071. [DOI] [PMC free article] [PubMed] [Google Scholar]
- 71.Jin T, Yoshioka Y, Fujii F, Komai Y, Seki J, Seiyama A. Chem Commun. 2008:5764. doi: 10.1039/b812302k. [DOI] [PubMed] [Google Scholar]
- 72.Chen K, Li ZB, Wang H, Cai WB, Chen XY. Eur J Nucl Med Mol Imaging. 2008;35:2235. doi: 10.1007/s00259-008-0860-8. [DOI] [PubMed] [Google Scholar]
- 73.Gerion D, Herberg J, Bok R, Gjersing E, Ramon E, Maxwell R, Kurhanewicz J, Budinger TF, Gray JW, Shuman MA, Chen FF. J Phys Chem C. 2007;111:12542. [Google Scholar]
- 74.Yang HS, Santra S, Walter GA, Holloway PH. Adv Mater. 2006;18:2890. [Google Scholar]
- 75.Hayat M. Cancer Imaging. 1. Academic Press; San Diego, CA and London, U.K: 2007. [Google Scholar]
- 76.Fernandez B, Galvez N, Cuesta R, Hungria AB, Calvino JJ, Dominguez-Vera JM. Adv Funct Mater. 2008;18:3931. [Google Scholar]
- 77.Prinzen L, Miserus R, Dirksen A, Hackeng TM, Deckers N, Bitsch NJ, Megens RTA, Douma K, Heemskerk JW, Kooi ME, Frederik PM, Slaaf DW, van Zandvoort M, Reutelingsperger CPM. Nano Lett. 2007;7:93. doi: 10.1021/nl062226r. [DOI] [PubMed] [Google Scholar]
- 78.Oostendorp M, Douma K, Hackeng TM, Dirksen A, Post MJ, van Zandvoort MA, Backes WH. Cancer Res. 2008;68:7676. doi: 10.1158/0008-5472.CAN-08-0689. [DOI] [PubMed] [Google Scholar]
- 79.Dirksen A, Langereis S, de Waal BFM, van Genderen MHP, Meijer EW, de Lussanet QG, Hackeng TM. Org Lett. 2004;6:4857. doi: 10.1021/ol048084u. [DOI] [PubMed] [Google Scholar]
- 80.Langereis S, Kooistra HAT, van Genderen MHP, Meijer EW. Org Biomol Chem. 2004;2:1271. doi: 10.1039/b402917h. [DOI] [PubMed] [Google Scholar]
- 81.Mandal SK, Lequeux N, Rotenberg B, Tramier M, Fattaccioli J, Bibette J, Dubertret B. Langmuir. 2005;21:4175. doi: 10.1021/la047025m. [DOI] [PubMed] [Google Scholar]
- 82.Park JH, von Maltzahn G, Ruoslahti E, Bhatia SN, Sailor MJ. Angew Chem, Int Ed. 2008;47:7284. doi: 10.1002/anie.200801810. [DOI] [PMC free article] [PubMed] [Google Scholar]
- 83.Roullier V, Grasset F, Boulmedais F, Artzner F, Cador O, Marchi-Artzner V. Chem Mater. 2008;20:6657. [Google Scholar]
- 84.Yu WW, Chang E, Drezek R, Colvin VL. Biochem Biophys Res Commun. 2006;348:781. doi: 10.1016/j.bbrc.2006.07.160. [DOI] [PubMed] [Google Scholar]
- 85.Bakalova R, Zhelev Z, Aoki I, Masamoto K, Mileva M, Obata T, Higuchi M, Gadjeva V, Kanno I. Bioconjugate Chem. 2008;19:1135. doi: 10.1021/bc700431c. [DOI] [PubMed] [Google Scholar]
- 86.Bakalova R, Zhelev Z, Aoki I, Ohba H, Imai Y, Kanno I. Anal Chem. 2006;78:5925. doi: 10.1021/ac060412b. [DOI] [PubMed] [Google Scholar]
- 87.Koole R, van Schooneveld MM, Hilhorst J, Castermans K, Cormode DP, Strijkers GJ, Donega CD, Vanmaekelbergh D, Griffioen AW, Nicolay K, Fayad ZA, Meijerink A, Mulder WJM. Bioconjugate Chem. 2008;19:2471. doi: 10.1021/bc800368x. [DOI] [PMC free article] [PubMed] [Google Scholar]
- 88.Mulder WJM, Castermans K, van Beijnum JR, Egbrink M, Chin PTK, Fayad ZA, Lowik C, Kaijzel EL, Que I, Storm G, Strijkers GJ, Griffioen AW, Nicolay K. Angiogenesis. 2009;12:17. doi: 10.1007/s10456-008-9124-2. [DOI] [PubMed] [Google Scholar]
- 89.Mulder WJM, Strijkers GJ, Briley-Saboe KC, Frias JC, Aguinaldo JGS, Vucic E, Amirbekian V, Tang C, Chin PTK, Nicolay K, Fayad ZA. Magn Reson Med. 2007;58:1164. doi: 10.1002/mrm.21315. [DOI] [PubMed] [Google Scholar]
- 90.van Schooneveld MM, Vucic E, Koole R, Zhou Y, Stocks J, Cormode DP, Tang CY, Gordon RE, Nicolay K, Meijerink A, Fayad ZA, Mulder WJM. Nano Lett. 2008;8:2517. doi: 10.1021/nl801596a. [DOI] [PubMed] [Google Scholar]
- 91.van Tilborg GAF, Mulder WJM, Chin PTK, Storm G, Reutelingsperger CP, Nicolay K, Strijkers GJ. Bioconjugate Chem. 2006;17:865. doi: 10.1021/bc0600463. [DOI] [PubMed] [Google Scholar]
- 92.Duconge F, Pons T, Pestourie C, Herin L, Theze B, Gombert K, Mahler B, Hinnen F, Kuhnast B, Dolle F, Dubertret B, Tavitian B. Bioconjugate Chem. 2008;19:1921. doi: 10.1021/bc800179j. [DOI] [PubMed] [Google Scholar]
- 93.Erwin SC, Zu LJ, Haftel MI, Efros AL, Kennedy TA, Norris DJ. Nature. 2005;436:91. doi: 10.1038/nature03832. [DOI] [PubMed] [Google Scholar]
- 94.Bhattacharjee AK, Perez-Conde J. Physica E. 2006;32:430. [Google Scholar]
- 95.Beaulac R, Archer PI, Ochsenbein ST, Gamelin DR. Adv Funct Mater. 2008;18:3873. [Google Scholar]
- 96.Behboudnia M, Sen P. Phys Rev B. 2001;63:035316. [Google Scholar]
- 97.Borgstrom M, Johansson J, Landin L, Seifert W. Appl Surf Sci. 2000;165:241. [Google Scholar]
- 98.Feng XB, Xing GC, Ji W. J Opt A: Pure Appl Opt. 2009:11. [Google Scholar]
- 99.Han JS, Zhang H, Tang Y, Liu Y, Yao X, Yang B. J Phys Chem C. 2009;113:7503. [Google Scholar]
- 100.Liu LN, Bin L, Ying J, Wu XD, Zhao HF, Ren XG, Zhu DX, Su ZM. Nanotechnology. 2008;19:495709. doi: 10.1088/0957-4484/19/49/495709. [DOI] [PubMed] [Google Scholar]
- 101.Liu Y, Liu BG. J Magn Magn Mater. 2006;307:245. [Google Scholar]
- 102.Ma L, Zhao JJ, Wang JG, Wang BL, Wang GH. Phys Rev B. 2007;75:045312. [Google Scholar]
- 103.Mahamuni S, Lad AD, Patole S. J Phys Chem C. 2008;112:2271. [Google Scholar]
- 104.Radovanovic PV, Norberg NS, McNally KE, Gamelin DR. J Am Chem Soc. 2002;124:15192. doi: 10.1021/ja028416v. [DOI] [PubMed] [Google Scholar]
- 105.Sarma DD, Viswanatha R, Sapra S, Prakash A, Garcia-Hernandez M. J Nanosci Nanotechnol. 2005;5:1503. doi: 10.1166/jnn.2005.322. [DOI] [PubMed] [Google Scholar]
- 106.Schwartz DA, Norberg NS, Nguyen QP, Parker JM, Gamelin DR. J Am Chem Soc. 2003;125:13205. doi: 10.1021/ja036811v. [DOI] [PubMed] [Google Scholar]
- 107.Singhal A, Achary SN, Tyagi AK, Manna PK, Yusuf SM. Mater Sci Eng, B. 2008;153:47. [Google Scholar]
- 108.Wang YS, Thomas PJ, O’Brien P. J Phys Chem B. 2006;110:21412. doi: 10.1021/jp0654415. [DOI] [PubMed] [Google Scholar]
- 109.Bhattacharjee AK, Perez-Conde J. Phys Rev B. 2003;68:045303. [Google Scholar]
- 110.Huong NQ, Birman JL. Phys Rev B. 2004;69:085321. [Google Scholar]
- 111.Magana D, Perera SC, Harter AG, Dalal NS, Strouse GF. J Am Chem Soc. 2006;128:2931. doi: 10.1021/ja055785t. [DOI] [PubMed] [Google Scholar]
- 112.Mikulec FV, Kuno M, Bennati M, Hall DA, Griffin RG, Bawendi MG. J Am Chem Soc. 2000;122:2532. [Google Scholar]
- 113.Sahoo Y, Poddar P, Srikanth H, Lucey DW, Prasad PN. J Phys Chem B. 2005;109:15221. doi: 10.1021/jp050202n. [DOI] [PubMed] [Google Scholar]
- 114.Lommens P, Loncke F, Smet PF, Callens F, Poelman D, Vrielinck H, Hens Z. Chem Mater. 2007;19:5576. [Google Scholar]
- 115.Zhang X, Brynda M, Britt RD, Carroll EC, Larsen DS, Louie AY, Kauzarich SM. J Am Chem Soc. 2007;129:10668. doi: 10.1021/ja074144q. [DOI] [PMC free article] [PubMed] [Google Scholar]
- 116.Anderson SHC, Elliott H, Wallis DJ, Canham LT, Powell JJ. Phys Status Solidi A. 2003;197:331. [Google Scholar]
- 117.Yong KT. Nanotechnology. 2009;20:015102. doi: 10.1088/0957-4484/20/1/015102. [DOI] [PubMed] [Google Scholar]
- 118.Santra S, Yang HS, Holloway PH, Stanley JT, Mericle RA. J Am Chem Soc. 2005;127:1656. doi: 10.1021/ja0464140. [DOI] [PubMed] [Google Scholar]
- 119.Bol AA, Meijerink A. J Phys Chem B. 2001;105:10197. [Google Scholar]
- 120.Reiss P, Protiere M, Li L. Small. 2009;5:154. doi: 10.1002/smll.200800841. [DOI] [PubMed] [Google Scholar]
- 121.Wang S, Jarrett B, Kauzlarich S, Louie A. J Am Chem Soc. 2007;129:3848. doi: 10.1021/ja065996d. [DOI] [PMC free article] [PubMed] [Google Scholar]
- 122.Kim H, Achermann M, Balet LP, Hollingsworth JA, Klimov VI. J Am Chem Soc. 2005;127:544. doi: 10.1021/ja047107x. [DOI] [PubMed] [Google Scholar]
- 123.Kirchner C, Liedl T, Kudera S, Pellegrino T, Javier AM, Gaub HE, Stolzle S, Fertig N, Parak WJ. Nano Lett. 2005;5:331. doi: 10.1021/nl047996m. [DOI] [PubMed] [Google Scholar]
- 124.Chang E, Thekkek N, Yu WW, Colvin VL, Drezek R. Small. 2006;2:1412. doi: 10.1002/smll.200600218. [DOI] [PubMed] [Google Scholar]
- 125.Chang E, Yu WW, Colvin VL, Drezek R. J Biomed Nanotechnol. 2005;1:397. [Google Scholar]
- 126.Ipe BI, Lehnig M, Niemeyer CM. Small. 2005;1:706. doi: 10.1002/smll.200500105. [DOI] [PubMed] [Google Scholar]
- 127.Lovric J, Cho SJ, Winnik FM, Maysinger D. Chem Biol. 2005;12:1227. doi: 10.1016/j.chembiol.2005.09.008. [DOI] [PubMed] [Google Scholar]
- 128.Abraham JL, Thakral C. Eur J Radiol. 2008;66:200. doi: 10.1016/j.ejrad.2008.01.026. [DOI] [PubMed] [Google Scholar]
- 129.Agarwal R, Brunelli SM, Williams K, Mitchell MD, Feldman HI, Umscheid CA. Nephrol, Dial, Transplant. 2009;24:856. doi: 10.1093/ndt/gfn593. [DOI] [PubMed] [Google Scholar]
- 130.Altun E, Semelka RC, Cakit C. Acad Radiol. 2009;16:897. doi: 10.1016/j.acra.2009.01.001. [DOI] [PubMed] [Google Scholar]
- 131.Bridges MD, Amant BSS, McNeil RB, Cernigliaro JG, Dwyer JP, Fitzpatrick PM. Am J Roentgenol. 2009;192:1538. doi: 10.2214/AJR.07.3895. [DOI] [PubMed] [Google Scholar]
- 132.Hasebroock KM, Serkova NJ. Exp Opin Drug Metab Toxicol. 2009;5:403. doi: 10.1517/17425250902873796. [DOI] [PubMed] [Google Scholar]
- 133.Idee JM, Port M, Medina C, Lancelot E, Fayoux E, Ballet S, Corot C. Toxicology. 2008;248:77. doi: 10.1016/j.tox.2008.03.012. [DOI] [PubMed] [Google Scholar]
- 134.Morcos SK, Thomsen HS. Nephron Clin Pract. 2008;110:C24. doi: 10.1159/000151228. [DOI] [PubMed] [Google Scholar]
- 135.Ortega LM, Contreras G, Lenz O. Nefrologia. 2009;29:109. doi: 10.3265/Nefrologia.2009.29.2.4842.en.full. [DOI] [PubMed] [Google Scholar]
- 136.Shellock FG, Spinazzi A. Am J Roentgenol. 2008;191:1129. doi: 10.2214/AJR.08.1038.1. [DOI] [PubMed] [Google Scholar]
- 137.Banerjee SS, Chen DH. Nanotechnology. 2009;20:185103. doi: 10.1088/0957-4484/20/18/185103. [DOI] [PubMed] [Google Scholar]
- 138.Gallagher JJ, Tekoriute R, O’Reilly JA, Kerskens C, Gun’ko YK, Lynch M. J Mater Chem. 2009;19:4081. [Google Scholar]
- 139.Gunn J, Wallen H, Veiseh O, Sun C, Fang C, Cao JH, Yee C, Zhang MQ. Small. 2008;4:712. doi: 10.1002/smll.200701103. [DOI] [PMC free article] [PubMed] [Google Scholar]
- 140.Maxwell DJ, Bonde J, Hess DA, Hohm SA, Lahey R, Zhou P, Creer MH, Piwnica-Worms D, Nolta JA. Stem Cells. 2008;26:517. doi: 10.1634/stemcells.2007-0016. [DOI] [PMC free article] [PubMed] [Google Scholar]
- 141.Cheng CM, Chu PY, Chuang KH, Roffler SR, Kao CH, Tseng WL, Shiea J, Chang WD, Su YC, Chen BM, Wang YM, Cheng TL. Cancer Gene Ther. 2009;16:83. doi: 10.1038/cgt.2008.50. [DOI] [PubMed] [Google Scholar]
- 142.Quarta A, Di Corato R, Manna L, Argentiere S, Cingolani R, Barbarella G, Pellegrino T. J Am Chem Soc. 2008;130:10545. doi: 10.1021/ja800102v. [DOI] [PubMed] [Google Scholar]
- 143.Hirata N, Tanabe K, Narita A, Tanaka K, Naka K, Chujo Y, Nishimoto S. Biorg Med Chem. 2009;17:3775. doi: 10.1016/j.bmc.2009.04.048. [DOI] [PubMed] [Google Scholar]
- 144.Yeo KM, Gao CJ, Ahn KH, Lee IS. Chem Commun. 2008:4622. doi: 10.1039/b807462c. [DOI] [PubMed] [Google Scholar]
- 145.Pittet MJ, Swirski FK, Reynolds F, Josephson L, Weissleder R. Nat Protoc. 2006;1:73. doi: 10.1038/nprot.2006.11. [DOI] [PubMed] [Google Scholar]
- 146.Jaffer FA, Nahrendorf M, Sosnovik D, Kelly KA, Aikawa E, Weissleder R. Mol Imaging. 2006;5:85. [PubMed] [Google Scholar]
- 147.Kircher MF, Mahmood U, King RS, Weissleder R, Josephson L. Cancer Res. 2003;63:8122. [PubMed] [Google Scholar]
- 148.Trehin R, Figueiredo JL, Pittet MJ, Weissleder R, Josephson L, Mahmood U. Neoplasia. 2006;8:302. doi: 10.1593/neo.05751. [DOI] [PMC free article] [PubMed] [Google Scholar]
- 149.Kelly KA, Allport JR, Tsourkas A, Shinde-Patil VR, Josephson L, Weissleder R. Circ Res. 2005;96:327. doi: 10.1161/01.RES.0000155722.17881.dd. [DOI] [PubMed] [Google Scholar]
- 150.Schellenberger EA, Sosnovik D, Weissleder R, Josephson L. Bioconjugate Chem. 2004;15:1062. doi: 10.1021/bc049905i. [DOI] [PubMed] [Google Scholar]
- 151.Sosnovik DE, Schellenberger EA, Nahrendorf M, Novikov MS, Matsui T, Dai G, Reynolds F, Grazette L, Rosenzweig A, Weissleder R, Josephson L. Magn Reson Med. 2005;54:718. doi: 10.1002/mrm.20617. [DOI] [PubMed] [Google Scholar]
- 152.Moore A, Medarova Z, Potthast A, Dai GP. Cancer Res. 2004;64:1821. doi: 10.1158/0008-5472.can-03-3230. [DOI] [PubMed] [Google Scholar]
- 153.Montet X, Montet-Abou K, Reynolds F, Weissleder R, Josephson L. Neoplasia. 2006;8:214. doi: 10.1593/neo.05769. [DOI] [PMC free article] [PubMed] [Google Scholar]
- 154.Medarova Z, Kumar M, Ng SW, Yang JZ, Barteneva N, Evgenov NV, Petkova V, Moore A. Transplantation. 2008;86:1170. doi: 10.1097/TP.0b013e31818a81b2. [DOI] [PMC free article] [PubMed] [Google Scholar]
- 155.Josephson L, Kircher MF, Mahmood U, Tang Y, Weissleder R. Bioconjugate Chem. 2002;13:554. doi: 10.1021/bc015555d. [DOI] [PubMed] [Google Scholar]
- 156.Yang L, Mao H, Cao ZH, Wang YA, Peng XH, Wang XX, Sajja HK, Wang LY, Duan HW, Ni CC, Staley CA, Wood WC, Gao XH, Nie SM. Gastroenterology. 2009;136:1514. doi: 10.1053/j.gastro.2009.01.006. [DOI] [PMC free article] [PubMed] [Google Scholar]
- 157.Veiseh O, Sun C, Gunn J, Kohler N, Gabikian P, Lee D, Bhattarai N, Ellenbogen R, Sze R, Hallahan A, Olson J, Zhang MQ. Nano Lett. 2005;5:1003. doi: 10.1021/nl0502569. [DOI] [PubMed] [Google Scholar]
- 158.Kohler N, Fryxell GE, Zhang MQ. J Am Chem Soc. 2004;126:7206. doi: 10.1021/ja049195r. [DOI] [PubMed] [Google Scholar]
- 159.Wang DS, He JB, Rosenzweig N, Rosenzweig Z. Nano Lett. 2004;4:409. [Google Scholar]
- 160.Lee HY, Li Z, Chen K, Hsu AR, Xu CJ, Xie J, Sun SH, Chen XY. J Nucl Med. 2008;49:1371. doi: 10.2967/jnumed.108.051243. [DOI] [PubMed] [Google Scholar]
- 161.Nahrendorf M, Zhang HW, Hembrador S, Panizzi P, Sosnovik DE, Aikawa E, Libby P, Swirski FK, Weissleder R. Circulation. 2008;117:379. doi: 10.1161/CIRCULATIONAHA.107.741181. [DOI] [PMC free article] [PubMed] [Google Scholar]
- 162.Natarajan A, Gruettner C, Ivkov R, DeNardo GL, Mirick G, Yuan A, Foreman A, DeNardo SJ. Bioconjugate Chem. 2008;19:1211. doi: 10.1021/bc800015n. [DOI] [PMC free article] [PubMed] [Google Scholar]
- 163.Choi JS, Park JC, Nah H, Woo S, Oh J, Kim KM, Cheon GJ, Chang Y, Yoo J, Cheon J. Angew Chem, Int Ed. 2008;47:6259. doi: 10.1002/anie.200801369. [DOI] [PubMed] [Google Scholar]
- 164.Devaraj NK, Keliher EJ, Thurber GM, Nahrendorf M, Weissleder R. Bioconjugate Chem. 2009;20:397. doi: 10.1021/bc8004649. [DOI] [PMC free article] [PubMed] [Google Scholar]
- 165.Fuster V, Moreno PR, Fayad ZA, Corti R, Badimon JJ. J Am Coll Cardiol. 2005;46:937. doi: 10.1016/j.jacc.2005.03.074. [DOI] [PubMed] [Google Scholar]
- 166.Lafont A. Heart. 2003;89:1262. doi: 10.1136/heart.89.10.1262. [DOI] [PMC free article] [PubMed] [Google Scholar]
- 167.Shah PK. J Am Coll Cardiol. 2003;41:15S. doi: 10.1016/s0735-1097(02)02834-6. [DOI] [PubMed] [Google Scholar]
- 168.Tiong AY, Brieger D. Am Heart J. 2005;150:11. doi: 10.1016/j.ahj.2004.12.019. [DOI] [PubMed] [Google Scholar]
- 169.Zheng J, El Naqa I, Rowold FE, Pilgram TK, Woodard PK, Saffitz JE, Tang D. Magn Reson Med. 2005;54:1360. doi: 10.1002/mrm.20724. [DOI] [PMC free article] [PubMed] [Google Scholar]
- 170.Garvin HL, Green TM, Lipworth E. Phys Rev. 1958;111:534. [Google Scholar]
- 171.Muhler A, Zhang XW, Wang H, Lawaczeck R, Weinmann HJ. Invest Radiol. 1995;30:98. doi: 10.1097/00004424-199502000-00006. [DOI] [PubMed] [Google Scholar]
- 172.Kolb HC, Finn MG, Sharpless KB. Angew Chem, Int Ed. 2001;40:2004. doi: 10.1002/1521-3773(20010601)40:11<2004::AID-ANIE2004>3.0.CO;2-5. [DOI] [PubMed] [Google Scholar]
- 173.Gad SC. Handbook of Pharmaceutical Biotechnology. John Wiley and Sons; Hoboken, NJ: 2007. [Google Scholar]
- 174.Wu SH, Lin YS, Hung Y, Chou YH, Hsu YH, Chang C, Mou CY. ChemBioChem. 2008;9:53. doi: 10.1002/cbic.200700509. [DOI] [PubMed] [Google Scholar]
- 175.Makovec D, Campelj S, Bele M, Maver U, Zorko M, Drofenik M, Jamnik J, Gaberscek M. Colloids Surf, A. 2009;334:74. [Google Scholar]
- 176.Lee K, Moon HY, Park C, Kim OR, Ahn E, Lee SY, Park HE, Ihm SH, Seung KB, Chang K, Yoon TJ, Lee C, Cheong C, Hong KS. Curr Appl Phys. 2009;9:S15. [Google Scholar]
- 177.Ichiyanagi Y, Moritake S, Taira S, Setou M. J Magn Magn Mater. 2007;310:2877. [Google Scholar]
- 178.Ren CL, Li JH, Liu Q, Ren J, Chen XG, Hu ZD, Xue DS. Nanoscale Res Lett. 2008;3:496. doi: 10.1007/s11671-008-9186-5. [DOI] [PMC free article] [PubMed] [Google Scholar]
- 179.Yoon TJ, Kim JS, Kim BG, Yu KN, Cho MH, Lee JK. Angew Chem, Int Ed. 2005;44:1068. doi: 10.1002/anie.200461910. [DOI] [PubMed] [Google Scholar]
- 180.Ma ZY, Dosev D, Nichkova M, Dumas RK, Gee SJ, Hammock BD, Liu K, Kennedy IM. J Magn Magn Mater. 2009;321:1368. doi: 10.1016/j.jmmm.2009.02.040. [DOI] [PMC free article] [PubMed] [Google Scholar]
- 181.Heitsch AT, Smith DK, Patel RN, Ress D, Korgel BA. J Solid State Chem. 2008;181:1590. doi: 10.1016/j.jssc.2008.05.002. [DOI] [PMC free article] [PubMed] [Google Scholar]
- 182.Nagao D, Yokoyama M, Yamauchi N, Matsumoto H, Kobayashi Y, Konno M. Langmuir. 2008;24:9804. doi: 10.1021/la801364w. [DOI] [PubMed] [Google Scholar]
- 183.Salgueirino-Maceira V, Correa-Duarte MA, Lopez-Quintela MA, Rivas J. J Nanosci Nanotechnol. 2009;9:3684. doi: 10.1166/jnn.2009.ns51. [DOI] [PubMed] [Google Scholar]
- 184.Stober W, Fink A, Bohn E. J Colloid Interface Sci. 1968;26:62. [Google Scholar]
- 185.Lu CW, Hung Y, Hsiao JK, Yao M, Chung TH, Lin YS, Wu SH, Hsu SC, Liu HM, Mou CY, Yang CS, Huang DM, Chen YC. Nano Lett. 2007;7:149. doi: 10.1021/nl0624263. [DOI] [PubMed] [Google Scholar]
- 186.Zhang Y, Wang SN, Ma S, Guan JJ, Li D, Zhang XD, Zhang ZD. J Biomed Mater Res, Part A. 2008;85A:840. doi: 10.1002/jbm.a.31609. [DOI] [PubMed] [Google Scholar]
- 187.Santra S, Kaittanis C, Grimm J, Perez JM. Small. 2009;5:1862. doi: 10.1002/smll.200900389. [DOI] [PMC free article] [PubMed] [Google Scholar]
- 188.Li LL, Li HB, Chen D, Liu HY, Tang FQ, Zhang YQ, Ren J, Li Y. J Nanosci Nanotechnol. 2009;9:2540. doi: 10.1166/jnn.2009.dk04. [DOI] [PubMed] [Google Scholar]
- 189.Du GH, Liu ZL, Wang D, Xia X, Jia LH, Yao KL, Chu Q, Zhang SM. J Nanosci Nanotechnol. 2009;9:1304. doi: 10.1166/jnn.2009.c143. [DOI] [PubMed] [Google Scholar]
- 190.Selvan ST, Patra PK, Ang CY, Ying JY. Angew Chem, Int Ed. 2007;46:2448. doi: 10.1002/anie.200604245. [DOI] [PubMed] [Google Scholar]
- 191.Dosev D, Nichkova M, Dumas RK, Gee SJ, Hammock BD, Liu K, Kennedy IM. Nanotechnology. 2007;18:055102. doi: 10.1088/0957-4484/18/5/055102. [DOI] [PMC free article] [PubMed] [Google Scholar]
- 192.He H, Xie MY, Ding Y, Yu XF. Appl Surf Sci. 2009;255:4623. [Google Scholar]
- 193.Ma ZY, Dosev D, Nichkova M, Gee SJ, Hammock BD, Kennedy IM. J Mater Chem. 2009;19:4695. doi: 10.1039/b901427f. [DOI] [PMC free article] [PubMed] [Google Scholar]
- 194.Lu HC, Yi GS, Zhao SY, Chen DP, Guo LH, Cheng J. J Mater Chem. 2004;14:1336. [Google Scholar]
- 195.Kang YS, Risbud S, Rabolt JF, Stroeve P. Chem Mater. 1996;8:2209. [Google Scholar]
- 196.Cho SJ, Jarrett BR, Louie AY, Kauzlarich SM. Nanotechnology. 2006;17:640. [Google Scholar]
- 197.Larson TA, Bankson J, Aaron J, Sokolov K. Nanotechnology. 2007;18:325101. [Google Scholar]
- 198.Seo WS, Lee JH, Sun XM, Suzuki Y, Mann D, Liu Z, Terashima M, Yang PC, McConnell MV, Nishimura DG, Dai HJ. Nat Mater. 2006;5:971. doi: 10.1038/nmat1775. [DOI] [PubMed] [Google Scholar]
- 199.Soenen SJH, Vercauteren D, Braeckmans K, Noppe W, De Smedt S, De Cuyper M. ChemBioChem. 2009;10:257. doi: 10.1002/cbic.200800510. [DOI] [PubMed] [Google Scholar]
- 200.Zhang YX, Das GK, Xu R, Tan TTY. J Mater Chem. 2009;19:3696. [Google Scholar]
- 201.Alric C, Taleb J, Le Duc G, Mandon C, Billotey C, Le Meur-Herland A, Brochard T, Vocanson F, Janier M, Perriat P, Roux S, Tillement O. J Am Chem Soc. 2008;130:5908. doi: 10.1021/ja078176p. [DOI] [PubMed] [Google Scholar]
- 202.Moffat DB. The Mammalian Kidney. Cambridge University Press; Cambridge, U.K: 1975. [Google Scholar]
- 203.Nitin N, Javier DJ, Richards-Kortum R. Bioconjugate Chem. 2007;18:2090. doi: 10.1021/bc0701242. [DOI] [PubMed] [Google Scholar]
- 204.Gao JH, Zhang B, Gao Y, Pan Y, Zhang XX, Xu B. J Am Chem Soc. 2007;129:11928. doi: 10.1021/ja0731017. [DOI] [PubMed] [Google Scholar]
- 205.Tian ZQ, Zhang ZL, Gao JH, Huang BH, Xie HY, Xie M, Abruna HD, Pang DW. Chem Commun. 2009:4025. doi: 10.1039/b906149e. [DOI] [PubMed] [Google Scholar]
- 206.Bridot JL, Faure AC, Laurent S, Riviere C, Billotey C, Hiba B, Janier M, Josserand V, Coll JL, Vander Elst L, Muller R, Roux S, Perriat P, Tillement O. J Am Chem Soc. 2007;129:5076. doi: 10.1021/ja068356j. [DOI] [PubMed] [Google Scholar]
- 207.Huang CC, Su CH, Li WM, Liu TY, Chen JH, Yeh CS. Adv Funct Mater. 2009;19:249. [Google Scholar]
- 208.McDonald MA, Watkin KL. Invest Radiol. 2003;38:305. [PubMed] [Google Scholar]
- 209.Kumar R, Nyk M, Ohulchanskyy TY, Flask CA, Prasad PN. Adv Funct Mater. 2009;19:853. [Google Scholar]
- 210.Louis C, Bazzi R, Marquette CA, Bridot JL, Roux S, Ledoux G, Mercier B, Blum L, Perriat P, Tillement O. Chem Mater. 2005;17:1673. [Google Scholar]
- 211.Petoral RM, Soderlind F, Klasson A, Suska A, Fortin MA, Abrikossova N, Selegard L, Kall PO, Engstrom M, Uvdal K. J Phys Chem C. 2009;113:6913. [Google Scholar]
- 212.Bazzi R, Flores MA, Louis C, Lebbou K, Zhang W, Dujardin C, Roux S, Mercier B, Ledoux G, Bernstein E, Perriat P, Tillement O. J Colloid Interface Sci. 2004;273:191. doi: 10.1016/j.jcis.2003.10.031. [DOI] [PubMed] [Google Scholar]
- 213.Taylor KML, Jin A, Lin WB. Angew Chem, Int Ed. 2008;47:7722. doi: 10.1002/anie.200802911. [DOI] [PubMed] [Google Scholar]
- 214.Hirano S, Suzuki KT. Environ Health Perspect. 1996;104:85. doi: 10.1289/ehp.96104s185. [DOI] [PMC free article] [PubMed] [Google Scholar]
- 215.Bastus NG, Casals E, Vazquez-Campos S, Puntes V. Nanotoxicology. 2008;2:99. [Google Scholar]
- 216.Hoet P, Boczkowski J. Nanotoxicology. 2008;2:171. doi: 10.3109/17435390903428844. [DOI] [PubMed] [Google Scholar]
- 217.Sarkander HI, Brade WP. Arch Toxicol. 1976;36:1. doi: 10.1007/BF00277559. [DOI] [PubMed] [Google Scholar]
- 218.Gu HW, Zheng RK, Zhang XX, Xu B. J Am Chem Soc. 2004;126:5664. doi: 10.1021/ja0496423. [DOI] [PubMed] [Google Scholar]
- 219.Choi JS, Jun YW, Yeon SI, Kim HC, Shin JS, Cheon J. J Am Chem Soc. 2006;128:15982. doi: 10.1021/ja066547g. [DOI] [PubMed] [Google Scholar]
- 220.Choi SH, Bin Na H, Il Park Y, An K, Kwon SG, Jang Y, Park M, Moon J, Son JS, Song IC, Moon WK, Hyeon T. J Am Chem Soc. 2008;130:15573. doi: 10.1021/ja805311x. [DOI] [PubMed] [Google Scholar]
- 221.Greiner NR, Phillips DS, Johnson JD, Volk F. Nature. 1988;333:440. [Google Scholar]
- 222.Chang IP, Hwang KC, Chiang CS. J Am Chem Soc. 2008;130:15476. doi: 10.1021/ja804253y. [DOI] [PubMed] [Google Scholar]
- 223.Tsai CP, Hung Y, Chou YH, Huang DM, Hsiao JK, Chang C, Chen YC, Mou CY. Small. 2008;4:186. doi: 10.1002/smll.200700457. [DOI] [PubMed] [Google Scholar]
- 224.Choi JH, Nguyen FT, Barone PW, Heller DA, Moll AE, Patel D, Boppart SA, Strano MS. Nano Lett. 2007;7:861. doi: 10.1021/nl062306v. [DOI] [PMC free article] [PubMed] [Google Scholar]
- 225.Tsotsalas M, Busby M, Gianolio E, Aime S, De Cola L. Chem Mater. 2008;20:5888. [Google Scholar]
- 226.Zhang S, Zhu HY, Hu ZB, Liu L, Chen SF, Yu SH. Chem Commun. 2009:2326. doi: 10.1039/b821762a. [DOI] [PubMed] [Google Scholar]
- 227.Yang J, Lim EK, Lee HJ, Park J, Lee SC, Lee K, Yoon HG, Suh JS, Huh YM, Haam S. Biomaterials. 2008;29:2548. doi: 10.1016/j.biomaterials.2007.12.036. [DOI] [PubMed] [Google Scholar]
- 228.Zhang BB, Cheng J, Gong XQ, Dong XQ, Liu XH, Ma GP, Chang J. J Colloid Interface Sci. 2008;322:485. doi: 10.1016/j.jcis.2008.03.038. [DOI] [PubMed] [Google Scholar]
- 229.Cartier R, Kaufner L, Paulke BR, Wustneck R, Pietschmann S, Michel R, Bruhn H, Pison U. Nanotechnology. 2007;18:195102. [Google Scholar]
- 230.Seo SB, Yang J, Lee ES, Jung Y, Kim K, Lee SY, Kim D, Suh JS, Huh YM, Haam S. J Mater Chem. 2008;18:4402. [Google Scholar]
- 231.Doiron AL, Homan KA, Emelianov S, Brannon-Peppas L. Pharm Res. 2009;26:674. doi: 10.1007/s11095-008-9786-x. [DOI] [PMC free article] [PubMed] [Google Scholar]
- 232.Doiron AL, Chu K, Ali A, Brannon-Peppas L. Proc Natl Acad Sci USA. 2008;105:17232. doi: 10.1073/pnas.0710205105. [DOI] [PMC free article] [PubMed] [Google Scholar]
- 233.Tu CF, Yang YH, Gao MY. Nanotechnology. 2008;19:105601. doi: 10.1088/0957-4484/19/10/105601. [DOI] [PubMed] [Google Scholar]
- 234.Xie M, Hu J, Long YM, Zhang ZL, Xie HY, Pang DW. Biosens Bioelectron. 2009;24:1311. doi: 10.1016/j.bios.2008.07.058. [DOI] [PubMed] [Google Scholar]
- 235.Wilson R, Spiller DG, Prior IA, Bhatt R, Hutchinson A. J Mater Chem. 2007;17:4400. [Google Scholar]
- 236.Hatakeyama M, Mochizuki Y, Kita Y, Kishi H, Nishio K, Sakamoto S, Abe M, Handa H. J Magn Magn Mater. 2009;321:1364. [Google Scholar]
- 237.Yang S, Liu HR, Zhang ZC. New J Chem. 2009;33:620. [Google Scholar]
- 238.Zhang PF, Dou HJ, Li WW, Tao K, Xing B, Sun K. Chem Lett. 2007;36:1458. [Google Scholar]
- 239.Sun G, Hagooly A, Xu J, Nystrom AM, Li ZC, Rossin R, Moore DA, Wooley KL, Welch MJ. Biomacromolecules. 2008;9:1997. doi: 10.1021/bm800246x. [DOI] [PubMed] [Google Scholar]
- 240.Tan WB, Zhang Y. Adv Mater. 2005;17:2375. [Google Scholar]
- 241.Tan WB, Zhang Y. J Nanosci Nanotechnol. 2007;7:2389. doi: 10.1166/jnn.2007.415. [DOI] [PubMed] [Google Scholar]
- 242.Ge YQ, Zhang Y, He SY, Nie F, Teng GJ, Gu N. Nanoscale Res Lett. 2009;4:287. doi: 10.1007/s11671-008-9239-9. [DOI] [PMC free article] [PubMed] [Google Scholar]
- 243.Li LL, Chen D, Zhang YQ, Deng ZT, Ren XL, Meng XW, Tang FQ, Ren J, Zhang L. Nanotechnology. 2007;18:405102. [Google Scholar]
- 244.Yuan XB, Li H, Yuan YB. Carbohydr Polym. 2006;65:337. [Google Scholar]
- 245.Santra S, Dutta D, Walter GA, Moudgil BM. Technol Cancer Res Treat. 2005;4:593. doi: 10.1177/153303460500400603. [DOI] [PubMed] [Google Scholar]
- 246.Yang J, Lee J, Kang J, Chung CH, Lee K, Suh JS, Yoon HG, Huh YM, Haam S. Nanotechnology. 2008;19:075610. doi: 10.1088/0957-4484/19/7/075610. [DOI] [PubMed] [Google Scholar]
- 247.Kim JS, Rieter WJ, Taylor KML, An H, Lin WL, Lin WB. J Am Chem Soc. 2007;129:8962. doi: 10.1021/ja073062z. [DOI] [PMC free article] [PubMed] [Google Scholar]
- 248.Ren CL, Sun JF, Li JH, Chen XG, Hu ZD, Xue DS. Nanoscale Res Lett. 2009;4:640. doi: 10.1007/s11671-009-9295-9. [DOI] [PMC free article] [PubMed] [Google Scholar]
- 249.Wang QB, Liu Y, Lin CX, Yan H. Nanotechnology. 2007;18:405604. [Google Scholar]
- 250.Lin YS, Wu SH, Hung Y, Chou YH, Chang C, Lin ML, Tsai CP, Mou CY. Chem Mater. 2006;18:5170. [Google Scholar]
- 251.Lee JH, Jun YW, Yeon SI, Shin JS, Cheon J. Angew Chem, Int Ed. 2006;45:8160. doi: 10.1002/anie.200603052. [DOI] [PubMed] [Google Scholar]
- 252.Rieter WJ, Kim JS, Taylor KML, An HY, Lin WL, Tarrant T, Lin WB. Angew Chem, Int Ed. 2007;46:3680. doi: 10.1002/anie.200604738. [DOI] [PubMed] [Google Scholar]
- 253.Santra S, Bagwe RP, Dutta D, Stanley JT, Walter GA, Tan W, Moudgil BM, Mericle RA. Adv Mater. 2005;17:2165. [Google Scholar]
- 254.Li L, Choo ESG, Liu ZY, Ding J, Xue JM. Chem Phys Lett. 2008;461:114. [Google Scholar]
- 255.He R, You XG, Shao J, Gao F, Pan BF, Cui DX. Nanotechnology. 2007;18:315601. doi: 10.1088/0957-4484/18/3/035701. [DOI] [PubMed] [Google Scholar]
- 256.Sharma P, Brown SC, Bengtsson N, Zhang QZ, Walter GA, Grobmyer SR, Santra S, Jiang HB, Scott EW, Moudgil BM. Chem Mater. 2008;20:6087. doi: 10.1021/cm801020s. [DOI] [PMC free article] [PubMed] [Google Scholar]
- 257.Tomalia DA, Reyna LA, Svenson S. Biochem Soc Trans. 2007;35:61. doi: 10.1042/BST0350061. [DOI] [PubMed] [Google Scholar]
- 258.Sarin H, Kanevsky AS, Wu HT, Brimacombe KR, Fung SH, Sousa AA, Auh S, Wilson CM, Sharma K, Aronova MA, Leapman RD, Griffiths GL, Hall MD. J Transl Med. 2008:6. doi: 10.1186/1479-5876-6-80. [DOI] [PMC free article] [PubMed] [Google Scholar]
- 259.Xu H, Regino CAS, Koyama Y, Hama Y, Gunn AJ, Bernardo M, Kobayashi H, Choyke PL, Brechbiel MW. Bioconjugate Chem. 2007;18:1474. doi: 10.1021/bc0701085. [DOI] [PubMed] [Google Scholar]
- 260.Boswell CA, Eck PK, Regino CAS, Bernardo M, Wong KJ, Milenic DE, Choyke PL, Brechbiel MW. Mol Pharmaceutics. 2008;5:527. doi: 10.1021/mp800022a. [DOI] [PMC free article] [PubMed] [Google Scholar]
- 261.Talanov VS, Regino CAS, Kobayashi H, Bernardo M, Choyke PL, Brechbiel MW. Nano Lett. 2006;6:1459. doi: 10.1021/nl060765q. [DOI] [PubMed] [Google Scholar]
- 262.Najlah M, D’Emanuele A. Curr Opin Drug Discovery Dev. 2007;10:756. [PubMed] [Google Scholar]
- 263.Nandivada H, Jiang XW, Lahann J. Adv Mater. 2007;19:2197. [Google Scholar]
- 264.Samad A, Alam MI, Saxena K. Curr Pharm Des. 2009;15:2958. doi: 10.2174/138161209789058200. [DOI] [PubMed] [Google Scholar]
- 265.Singh I, Rehni AK, Kalra R, Joshi G, Kumar M. Pharmazie. 2008;63:491. [PubMed] [Google Scholar]
- 266.Trinchi A, Muster TH. Supramol Chem. 2007;19:431. [Google Scholar]
- 267.Uzgiris EE, Sood A, Bove K, Grimmond B, Lee D, Lomnes S. Technol Cancer Res Treat. 2006;5:301. doi: 10.1177/153303460600500401. [DOI] [PubMed] [Google Scholar]
- 268.Melancon MP, Wang YT, Wen XX, Bankson JA, Stephens LC, Jasser S, Gelovani JG, Myers JN, Li C. Invest Radiol. 2007;42:569. doi: 10.1097/RLI.0b013e31804f5a79. [DOI] [PMC free article] [PubMed] [Google Scholar]
- 269.Modo M, Mellodew K, Cash D, Fraser SE, Meade TJ, Price J, Williams SCR. Neuroimage. 2004;21:311. doi: 10.1016/j.neuroimage.2003.08.030. [DOI] [PubMed] [Google Scholar]
- 270.Modo M, Roberts TJ, Sandhu JK, Williams SCR. Exp Opin Biol Ther. 2004;4:145. doi: 10.1517/14712598.4.2.145. [DOI] [PubMed] [Google Scholar]
- 271.Brekke C, Morgan SC, Lowe AS, Meade TJ, Price J, Williams SCR, Modo M. NMR Biomed. 2007;20:77. doi: 10.1002/nbm.1077. [DOI] [PubMed] [Google Scholar]
- 272.Mizukami S, Takikawa R, Sugihara F, Shirakawa M, Kikuchi K. Angew Chem, Int Ed. 2009;48:3641. doi: 10.1002/anie.200806328. [DOI] [PubMed] [Google Scholar]
- 273.Edwards WB, Akers WJ, Ye YP, Cheney PP, Bloch S, Xu BG, Laforest R, Achilefu S. Mol Imaging. 2009;8:101. [PMC free article] [PubMed] [Google Scholar]
- 274.Edwards WB, Xu B, Akers W, Cheney PP, Liang K, Rogers BE, Anderson CJ, Achilefu S. Bioconjugate Chem. 2008;19:192. doi: 10.1021/bc700291m. [DOI] [PMC free article] [PubMed] [Google Scholar]
- 275.Wang W, Ke S, Kwon S, Yallampalli S, Cameron AG, Adams KE, Mawad ME, Sevick-Muraca EM. Bioconjugate Chem. 2007;18:397. doi: 10.1021/bc0602679. [DOI] [PubMed] [Google Scholar]
- 276.Houston JP, Ke S, Wang W, Li C, Sevick-Muraca EM. J Biomed Opt. 2005:10. doi: 10.1117/1.2114748. [DOI] [PubMed] [Google Scholar]
- 277.Dafni H, Gilead A, Nevo N, Eilam R, Harmelin A, Neeman M. Magn Reson Med. 2003;50:904. doi: 10.1002/mrm.10638. [DOI] [PubMed] [Google Scholar]
- 278.Mishra A, Pfeuffer J, Mishra R, Engelmann J, Mishra AK, Ugurbil K, Logothetis NK. Bioconjugate Chem. 2006;17:773. doi: 10.1021/bc050295b. [DOI] [PubMed] [Google Scholar]
- 279.Tu C, Nagao R, Louie AY. Angew Chem, Int Ed. 2009;48:6547. doi: 10.1002/anie.200900984. [DOI] [PMC free article] [PubMed] [Google Scholar]
- 280.Tu CQ, Louie AY. Chem Commun. 2007:1331. doi: 10.1039/b616991k. [DOI] [PMC free article] [PubMed] [Google Scholar]
- 281.Tu CQ, Osborne EA, Louie AY. Tetrahedron. 2009;65:1241. doi: 10.1016/j.tet.2008.12.020. [DOI] [PMC free article] [PubMed] [Google Scholar]
- 282.Zhang ZR, Liang KX, Bloch S, Berezin M, Achilefu S. Bioconjugate Chem. 2005;16:1232. doi: 10.1021/bc050136s. [DOI] [PubMed] [Google Scholar]
- 283.Zhang ZR, Achilefu S. Photochem Photobiol. 2005;81:1499. doi: 10.1562/2005-06-08-RA-568. [DOI] [PubMed] [Google Scholar]
- 284.Li C, Wang W, Wu QP, Shi K, Houston J, Sevick-Muraca E, Dong L, Chow D, Charnsangavej C, Gelovani JG. Nucl Med Biol. 2006;33:349. doi: 10.1016/j.nucmedbio.2006.01.001. [DOI] [PubMed] [Google Scholar]
- 285.Xu H, Baidoo K, Gunn AJ, Boswell CA, Milenic DE, Choyke PL, Brechbiel MW. J Med Chem. 2007;50:4759. doi: 10.1021/jm070657w. [DOI] [PMC free article] [PubMed] [Google Scholar]
- 286.Bhushan KR, Misra P, Liu F, Mathur S, Lenkinski RE, Frangioni JV. J Am Chem Soc. 2008;130:17648. doi: 10.1021/ja807099s. [DOI] [PMC free article] [PubMed] [Google Scholar]
- 287.Pandey SK, Gryshuk AL, Sajjad M, Zheng X, Chen Y, Abouzeid MM, Morgan J, Charamisinau I, Nabi HA, Oseroff A, Pandey RK. J Med Chem. 2005;48:6286. doi: 10.1021/jm050427m. [DOI] [PubMed] [Google Scholar]
- 288.Blasberg RG. Nucl Med Biol. 2003;30:879. doi: 10.1016/s0969-8051(03)00115-x. [DOI] [PubMed] [Google Scholar]
- 289.Doubrovin M, Serganova I, Mayer-Kuckuk P, Ponomarev V, Blasberg RG. Bioconjugate Chem. 2004;15:1376. doi: 10.1021/bc0498572. [DOI] [PubMed] [Google Scholar]
- 290.Chalfie M. Photochem Photobiol. 1995;62:651. doi: 10.1111/j.1751-1097.1995.tb08712.x. [DOI] [PubMed] [Google Scholar]
- 291.Wang Y, Yu YA, Shabahang S, Wang G, Szalay AA. Mol Genet Genomics. 2002;268:160. doi: 10.1007/s00438-002-0751-9. [DOI] [PubMed] [Google Scholar]
- 292.Wang Y, Wang G, O’Kane DJ, Szalay AA. Mol Gen Genet. 2001;264:578. doi: 10.1007/s004380000322. [DOI] [PubMed] [Google Scholar]
- 293.Oh SC, Nam SY, Kwon HC, Kim CM, Seo JS, Seong RH, Jang YJ, Chung YH, Chung HY. Mol Cells. 2001;11:192. [PubMed] [Google Scholar]
- 294.Paquin A, Jaalouk DE, Galipeau J. Hum Gene Ther. 2001;12:13. doi: 10.1089/104303401450924. [DOI] [PubMed] [Google Scholar]
- 295.Yang L, Chiang YW, Lenz HJ, Danenberg KD, Spears CP, Gordon EM, Anderson WF, Parekh D. Hum Gene Ther. 1998;9:719. doi: 10.1089/hum.1998.9.5-719. [DOI] [PubMed] [Google Scholar]
- 296.Luker GD, Luker KE, Pica CM, Dahlheimer JL, Fahrner TJ, Milbrandt J, Piwnica-Worms D. J Nucl Med. 2001;42:285. [Google Scholar]
- 297.Jacobs A, Dubrovin M, Hewett J, Sena-Esteves M, Tan C, Slack M, Breakefield X, Tjuvajuv J. Neoplasia. 1999;1:154. doi: 10.1038/sj.neo.7900007. [DOI] [PMC free article] [PubMed] [Google Scholar]
- 298.Ray P, Lewis X, Wu A, Gambhir SS. J Nucl Med. 2002;43:248. [Google Scholar]
- 299.Ponomarev V, Doubrovin M, Serganova I, Vider J, Shavrin A, Beresten T, Ivanova A, Ageyeva L, Tourkova V, Balatoni J, Bornman W, Blasberg R, Tjuvajev J. Mol Imaging. 2004;31:740. doi: 10.1007/s00259-003-1441-5. [DOI] [PubMed] [Google Scholar]
- 300.Ray P, De A, Min JJ, Tsien RY, Gambhir SS. Cancer Res. 2004;64:1323. doi: 10.1158/0008-5472.can-03-1816. [DOI] [PMC free article] [PubMed] [Google Scholar]
- 301.Deroose C, De A, Loenig A, Chow P, Ray P, Chatziioannou A, Gambhir S. J Nucl Med. 2007;48:295. [PMC free article] [PubMed] [Google Scholar]
- 302.Lin KM, Hsu CH, Chang WSW, Chen CT, Lee TW. Mol Imaging Biol. 2008;10:253. doi: 10.1007/s11307-008-0147-2. [DOI] [PubMed] [Google Scholar]
- 303.Padmanabhan P, Otero J, Ray P, Paulmurugan R, Hoffman AR, Gambhir SS, Biswal S, Ulaner GA. J Nucl Med. 2006;47:270. [PMC free article] [PubMed] [Google Scholar]
- 304.Ray P, Tsien R, Gambhir SS. Cancer Res. 2007;67:3085. doi: 10.1158/0008-5472.CAN-06-2402. [DOI] [PubMed] [Google Scholar]
- 305.Kesarwala AH, Prior JL, Sun JW, Harpstrite SE, Sharma V, Piwnica-Worms D. Mol Imaging. 2006;5:465. [PubMed] [Google Scholar]
- 306.Tsien RY. Angew Chem, Int Ed. 2009;48:5612. doi: 10.1002/anie.200901916. [DOI] [PubMed] [Google Scholar]
- 307.Dementieva EI, Fedorchuk EA, Brovko LY, Savitskii AP, Ugarova NN. Biosci Rep. 2000;20:21. doi: 10.1023/a:1005579016387. [DOI] [PubMed] [Google Scholar]
- 308.Luker G, Luker K. J Nucl Med. 2008;49:1. doi: 10.2967/jnumed.107.045799. [DOI] [PubMed] [Google Scholar]
- 309.Golzio M, Rols MP, Gabriel B, Teissie J. Gene Ther. 2004;11:S85. doi: 10.1038/sj.gt.3302374. [DOI] [PubMed] [Google Scholar]
- 310.Ray P, De A, Patel M, Gambhir SS. Clin Cancer Res. 2008;14:5801. doi: 10.1158/1078-0432.CCR-07-5244. [DOI] [PMC free article] [PubMed] [Google Scholar]
- 311.Winnard PT, Kluth JB, Kato Y, Artemov D, Roman V. Cancer Biol Ther. 2007;6:1889. doi: 10.4161/cbt.6.12.4963. [DOI] [PubMed] [Google Scholar]
- 312.Higuchi T, Anton M, Dumler K, Seidl S, Pelisek J, Saraste A, Welling A, Hofmann F, Oostendorp RA, Gansbacher B, Nekolla SG, Bengel FM, Botnar RM, Schwaiger M. J Nucl Med. 2009;50:1088. doi: 10.2967/jnumed.108.060665. [DOI] [PubMed] [Google Scholar]
- 313.Aime S, Frullano L, Crich SG. Angew Chem, Int Ed. 2002;41:1017. doi: 10.1002/1521-3773(20020315)41:6<1017::aid-anie1017>3.0.co;2-p. [DOI] [PubMed] [Google Scholar]
- 314.Prasuhn DE, Jr, Yeh RM, Obenaus A, Manchester M, Finn MG. Chem Commun. 2007:1269. doi: 10.1039/b615084e. [DOI] [PubMed] [Google Scholar]
- 315.Douglas T, Strable E, Willits D, Aitouchen A, Libera M, Young M. Adv Mater. 2002;14:415. [Google Scholar]
- 316.Uchida M, Klem MT, Allen M, Suci P, Flenniken M, Gillitzer E, Varpness Z, Liepold LO, Young M, Douglas T. Adv Mater. 2007;19:1025. [Google Scholar]
- 317.Flenniken ML, Uchida M, Liepold LO, Kang S, Young MJ, Douglas T. In: Viruses and Nanotechnology. Manchester M, Steinmetz NF, editors. Springer-Verlag; Berlin: 2009. p. 327. [Google Scholar]
- 318.Singh R, Kostarelos K. Trends Biotechnol. 2009;27:220. doi: 10.1016/j.tibtech.2009.01.003. [DOI] [PubMed] [Google Scholar]
- 319.Kim J, Lee JE, Lee SH, Yu JH, Lee JH, Park TG, Hyeon T. Adv Mater. 2008;20:478. [Google Scholar]
- 320.Lucignani G. Eur J Nucl Med Mol Imaging. 2009;36:869. doi: 10.1007/s00259-009-1104-2. [DOI] [PubMed] [Google Scholar]
- 321.Nasongkla N, Bey E, Ren JM, Ai H, Khemtong C, Guthi JS, Chin SF, Sherry AD, Boothman DA, Gao JM. Nano Lett. 2006;6:2427. doi: 10.1021/nl061412u. [DOI] [PubMed] [Google Scholar]
- 322.Nehilla BJ, Allen PG, Desai TA. ACS Nano. 2008;2:538. doi: 10.1021/nn700281b. [DOI] [PubMed] [Google Scholar]
- 323.Pandey RK, Goswami LN, Chen YH, Gryshuk A, Missert JR, Oseroff A, Dougherty TJ. Lasers Surg Med. 2006;38:445. doi: 10.1002/lsm.20352. [DOI] [PubMed] [Google Scholar]
- 324.Sumer B, Gao JM. Nanomedicine. 2008;3:137. doi: 10.2217/17435889.3.2.137. [DOI] [PubMed] [Google Scholar]
- 325.Boerman OC, Oyen WJG. J Nucl Med. 2008;49:1213. doi: 10.2967/jnumed.108.052274. [DOI] [PubMed] [Google Scholar]
- 326.Mulder WJM, Koole R, Brandwijk RJ, Storm G, Chin PTK, Strijkers GJ, Donega CD, Nicolay K, Griffioen AW. Nano Lett. 2006;6:1. doi: 10.1021/nl051935m. [DOI] [PubMed] [Google Scholar]
- 327.Bouchard LS, Anwar MS, Liu GL, Hann B, Xie ZH, Gray JW, Wang XD, Pines A, Chen FF. Proc Natl Acad Sci USA. 2009;106:4085. doi: 10.1073/pnas.0813019106. [DOI] [PMC free article] [PubMed] [Google Scholar]
- 328.Mulder WJM, Strijkers GJ, Habets JW, Bleeker EJW, van der Schaft DWJ, Storm G, Koning GA, Griffioen AW, Nicolay K. FASEB J. 2005;19:2008. doi: 10.1096/fj.05-4145fje. [DOI] [PubMed] [Google Scholar]
- 329.Bol AA, Meijerink A. J Lumin. 2000;87–9:315. [Google Scholar]
- 330.Bol AA, Meijerink A. Phys Status Solidi B. 2001;224:291. [Google Scholar]
- 331.Biswas S, Kar S, Chaudhuri S. J Phys Chem. 2005;109:17526. doi: 10.1021/jp053138i. [DOI] [PubMed] [Google Scholar]
- 332.Kobayashi H, Kawamoto S, Brechbiel MW, Bernardo M, Sato N, Waldmann TA, Tagaya Y, Choyke PL. Neoplasia. 2005;7:984. doi: 10.1593/neo.05454. [DOI] [PMC free article] [PubMed] [Google Scholar]
- 333.Zhang X, Lovejoy K, Jasanoff A, Lippard S. Proc Natl Acad Sci USA. 2007;104:10780. doi: 10.1073/pnas.0702393104. [DOI] [PMC free article] [PubMed] [Google Scholar]
- 334.Tanaka K, Inafuku K, Chujo Y. Biorg Med Chem. 2008;16:10029. doi: 10.1016/j.bmc.2008.10.016. [DOI] [PubMed] [Google Scholar]


